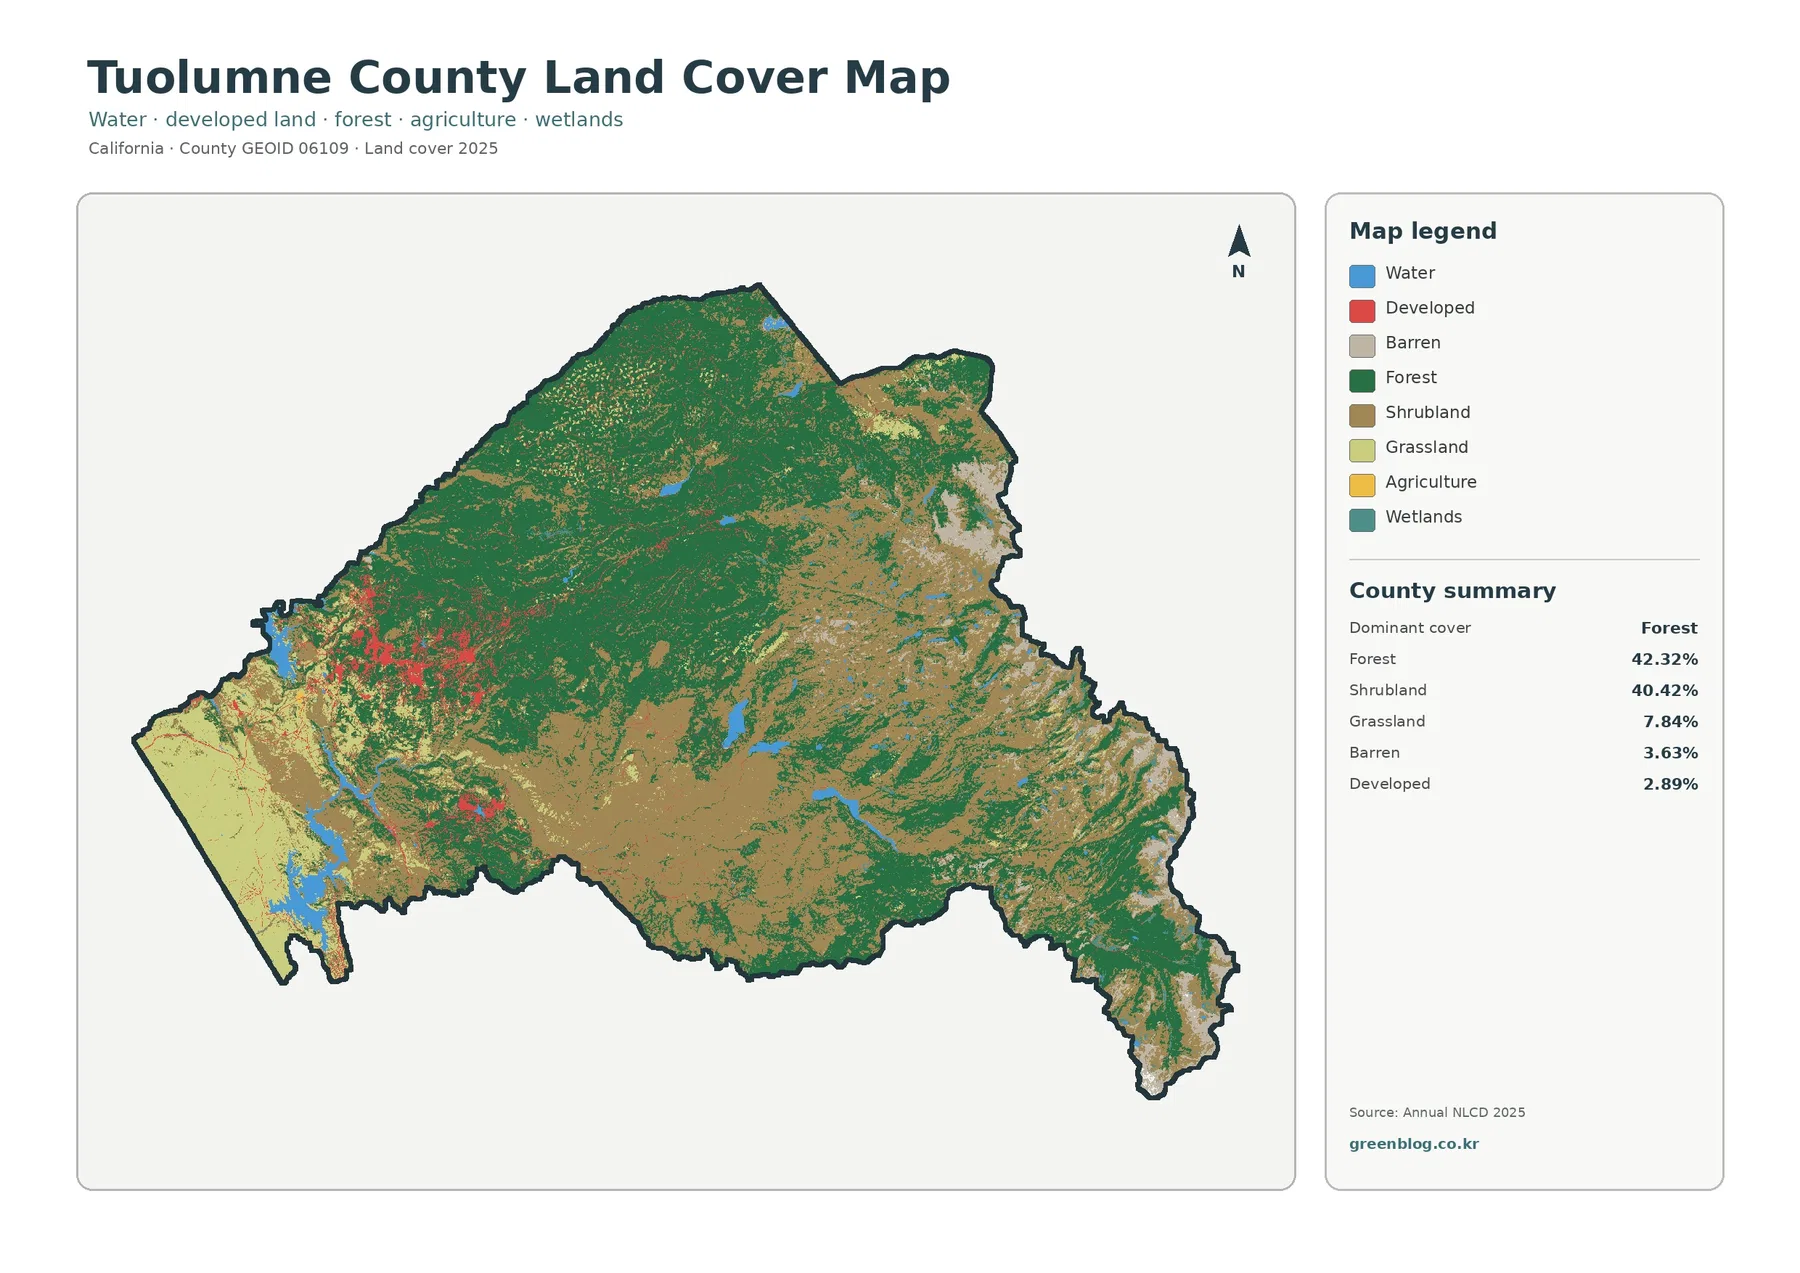
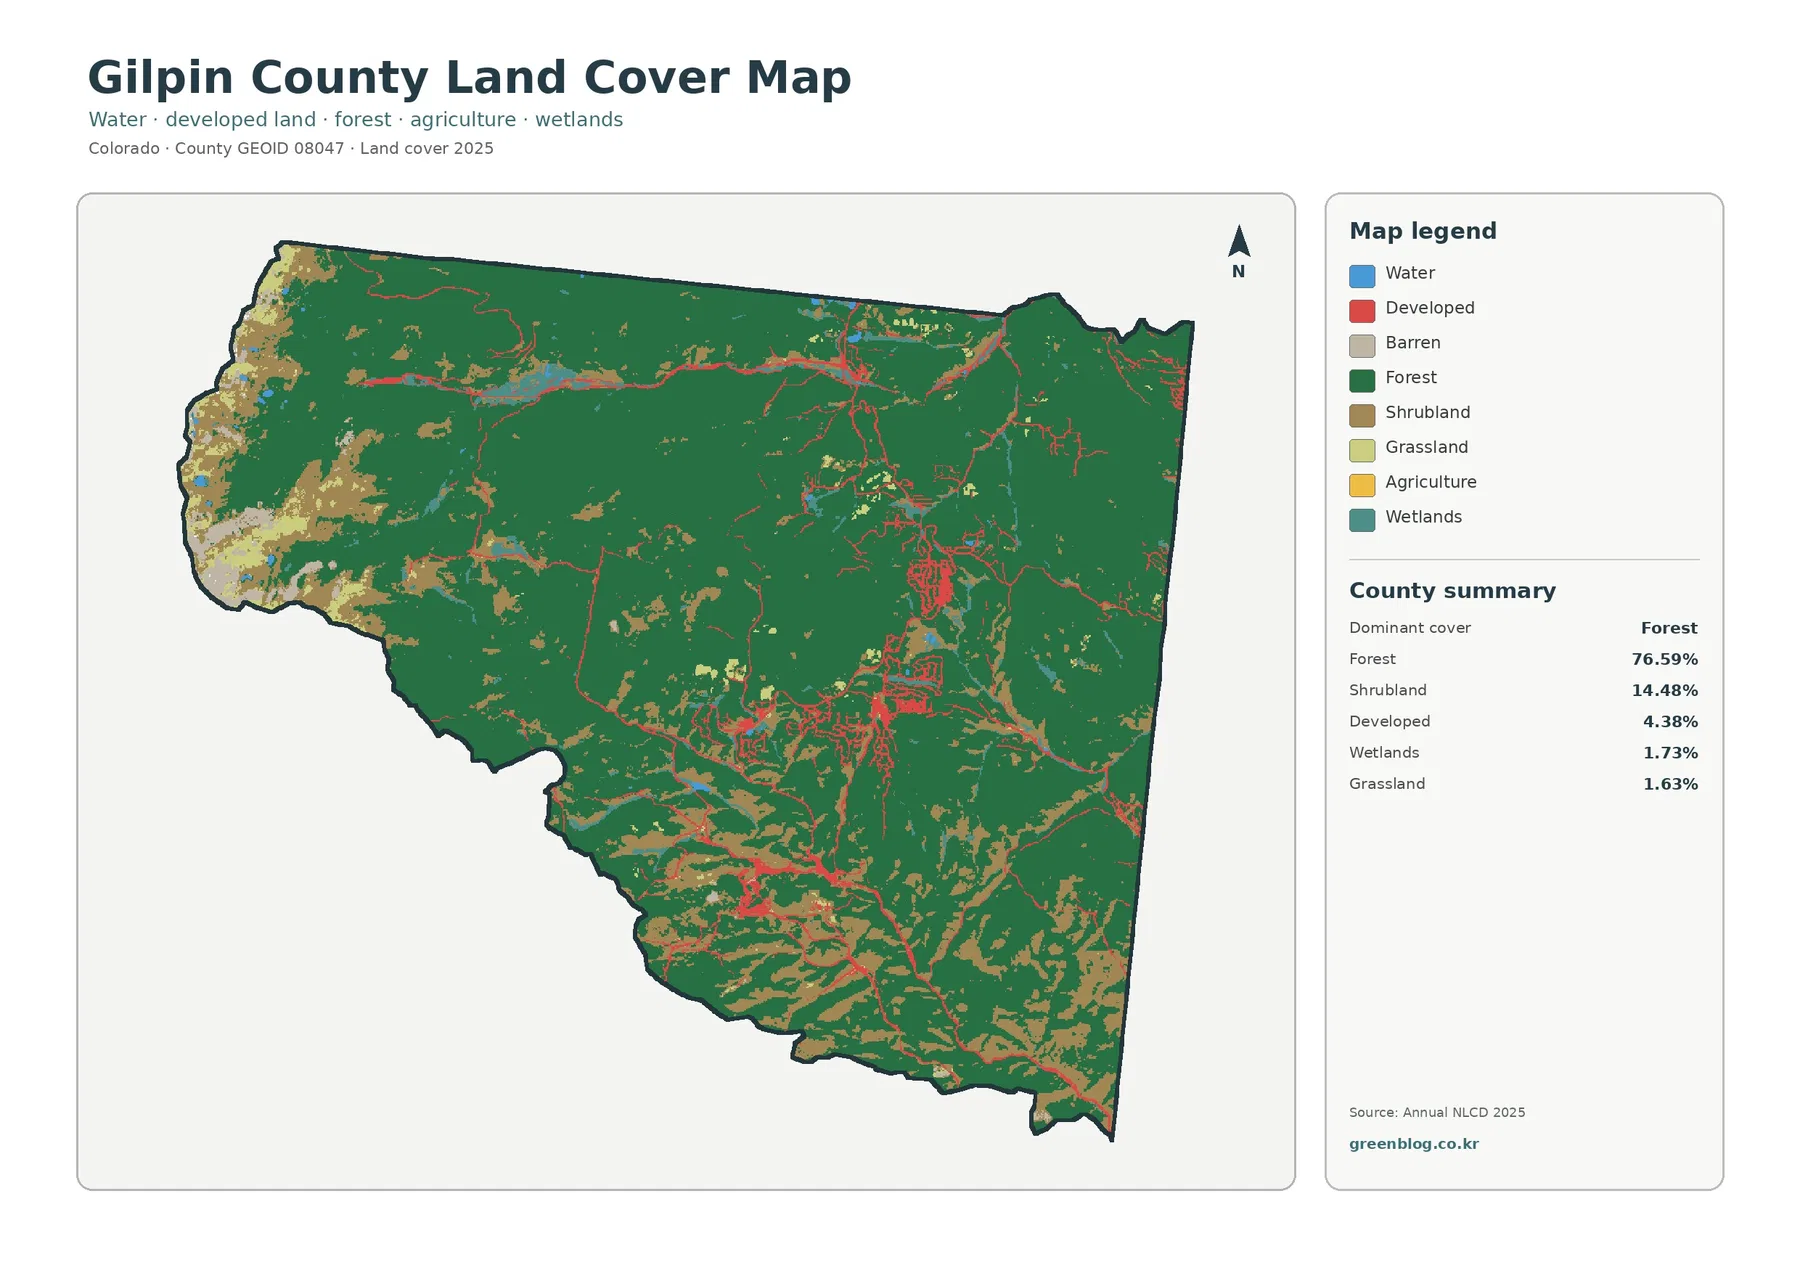
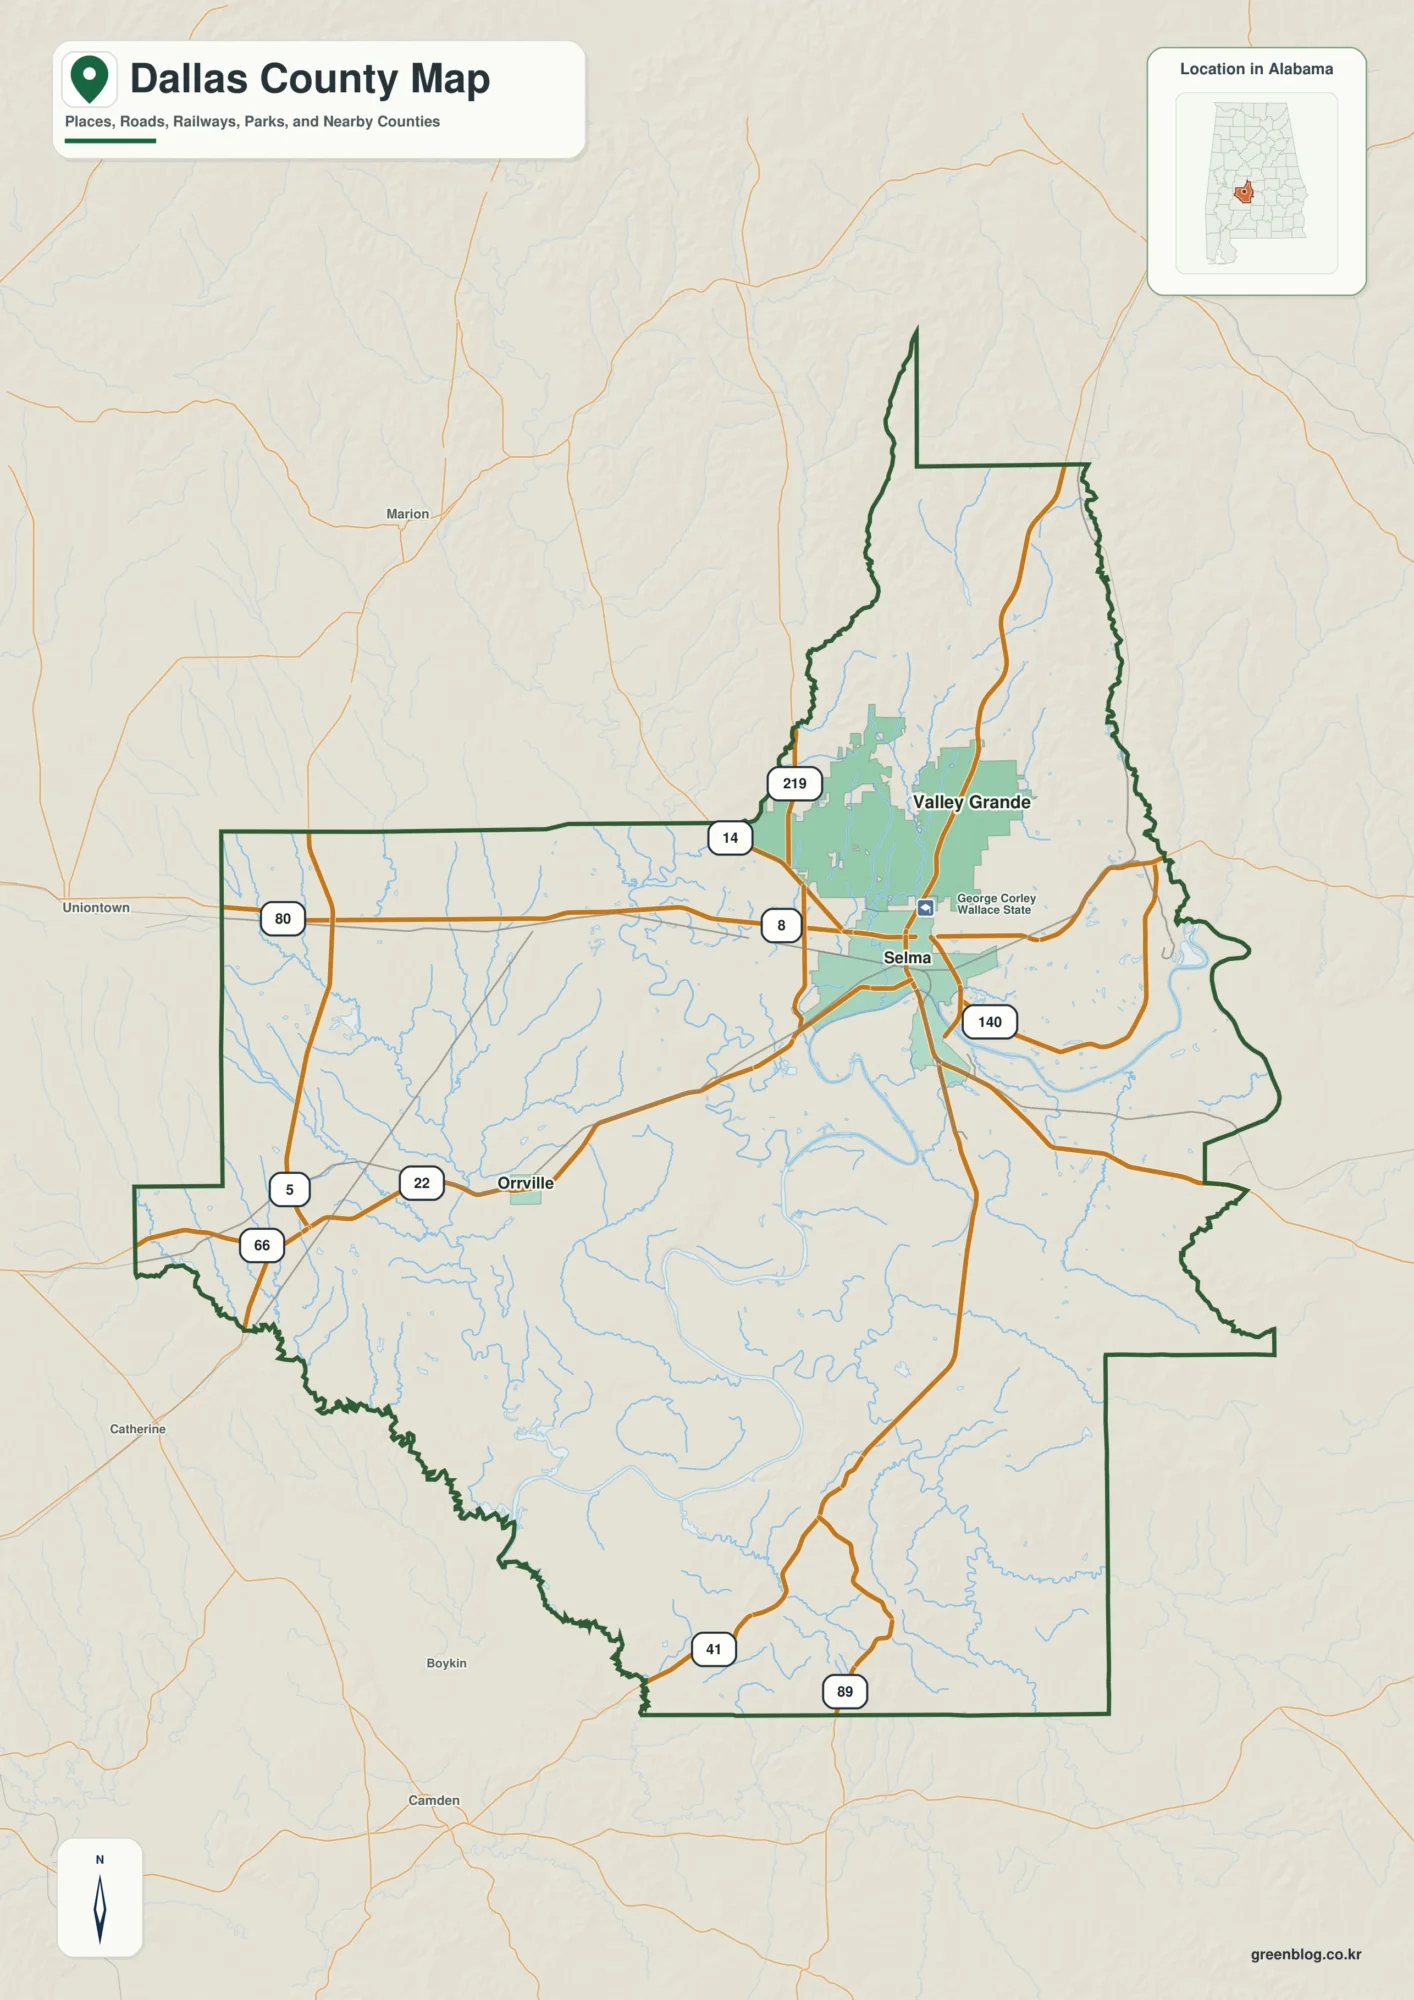
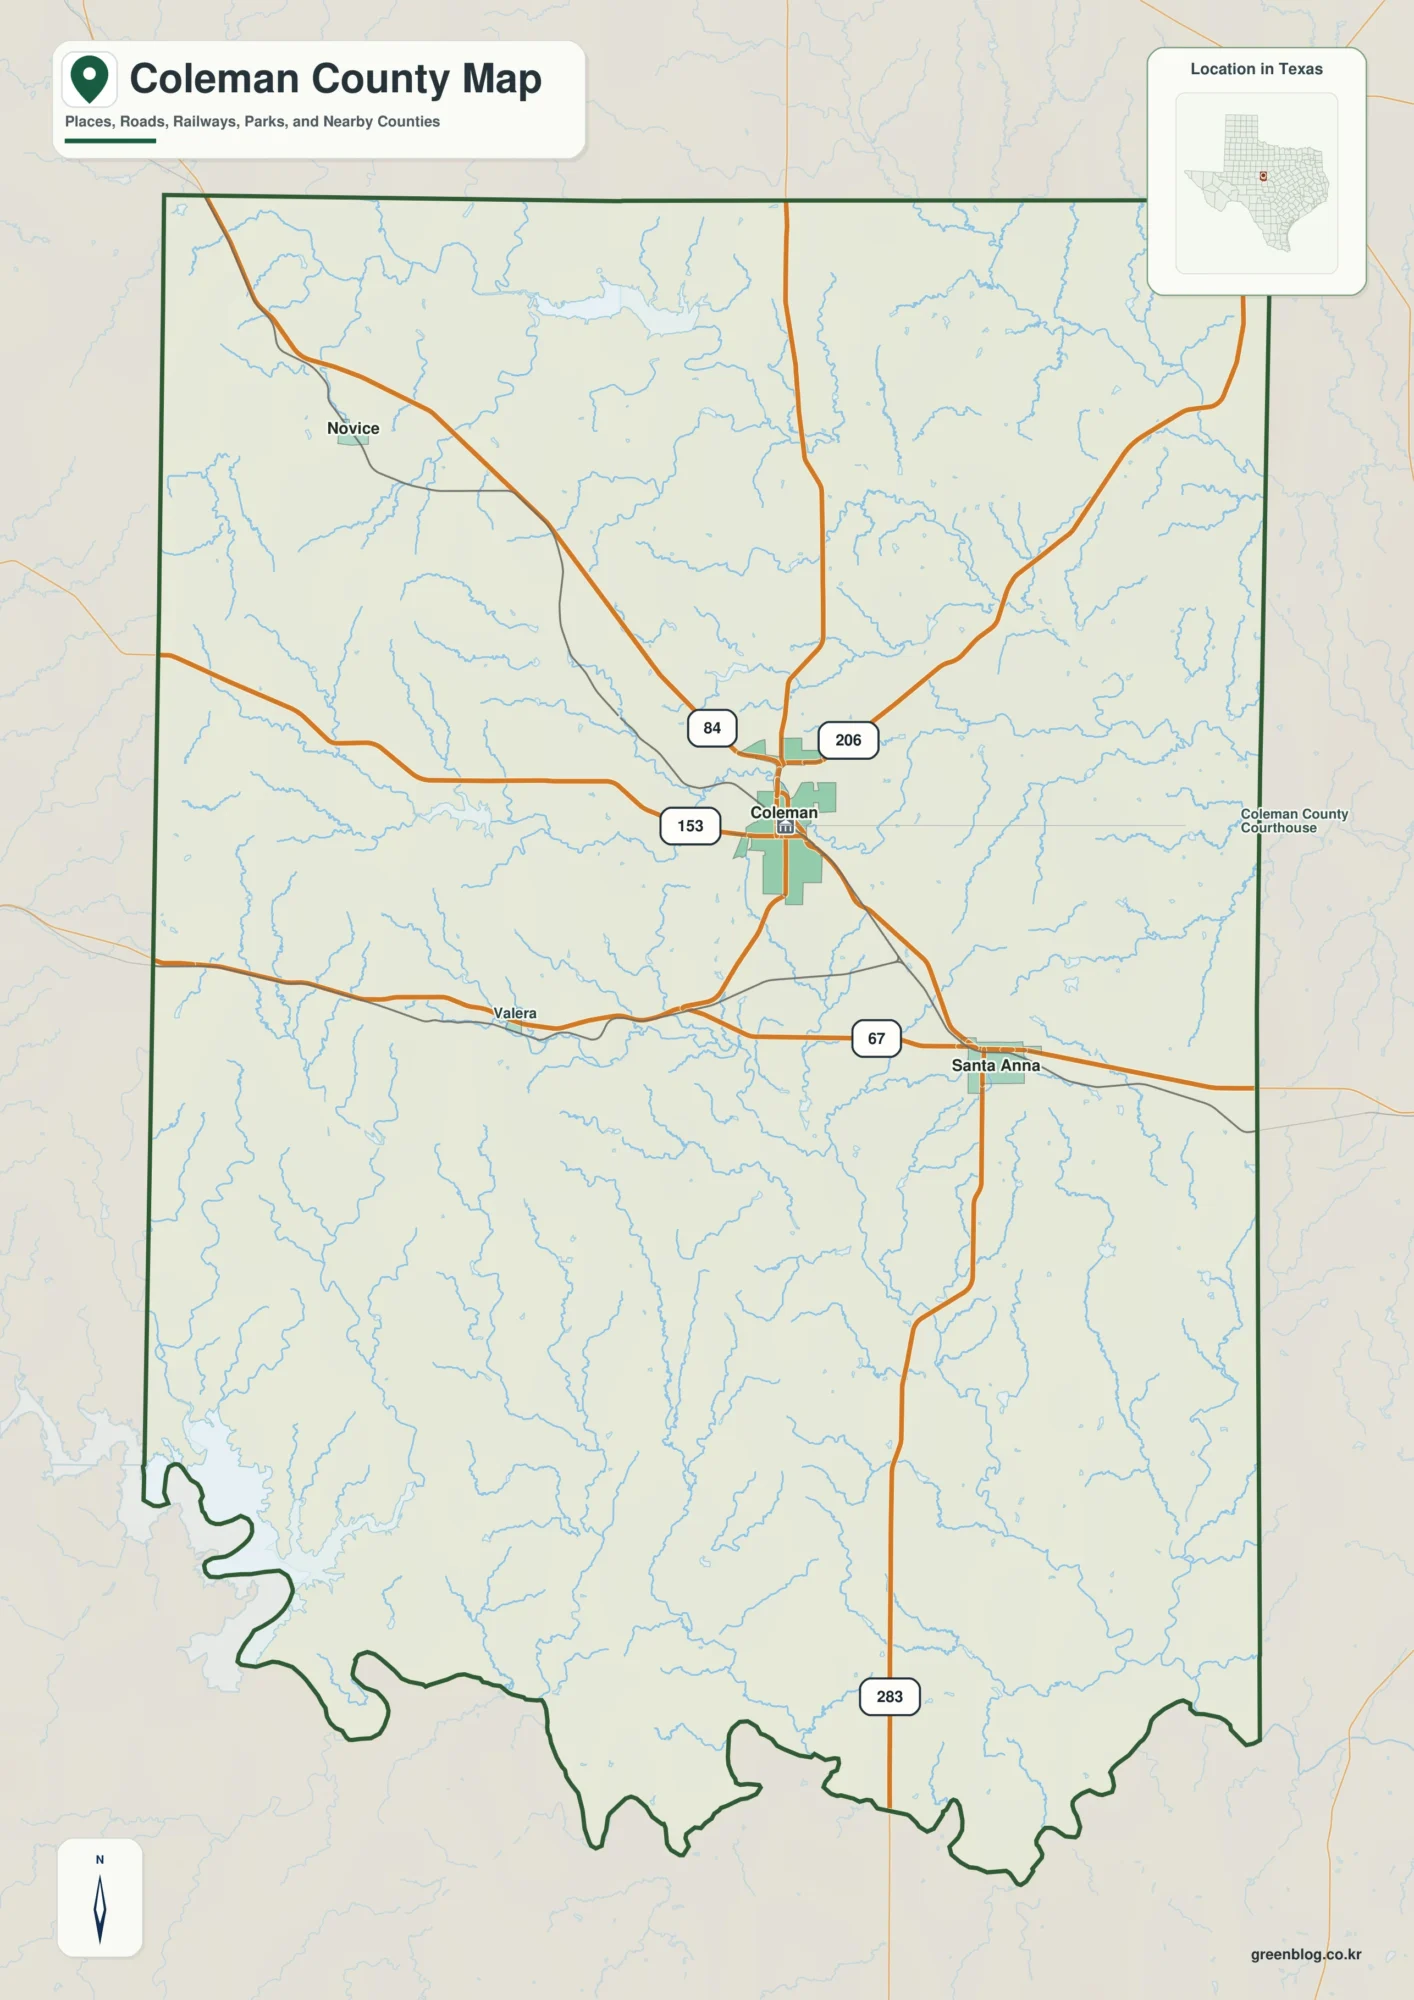
Tift County’s 2025 map has a clear rural–urban contrast. Agriculture is the largest mapped cover at 44.19%, spreading across much of the county, while a dense developed concentration occupies the central area. Wetlands account for 19.96% and repeatedly cut through the farm pattern, so the county is not simply a solid block of cropland surrounding one town. The four maps on this page separate present land cover, forest and farmland, impervious surface, and mapped class differences from 1985 to 2025.
For on-screen reading, the article uses WebP previews, and the four original JPG maps are available together in one ZIP download. They are most useful when viewed as a set: the general map establishes the 2025 pattern, the simplified rural-cover map clarifies farm and wetland edges, the impervious map isolates hard surfaces, and the change layer shows where classifications differ between two dates. Keeping those questions separate prevents current development, pavement, and long-term change from being treated as the same thing.
Table of Contents
A broad agricultural matrix surrounds a concentrated central developed area
On the general land-cover map, 44.19% of Tift County is assigned to agriculture. Yellow areas appear across every major side of the county and form many large blocks outside the center. Wetlands are the next largest class at 19.96%, followed by developed land at 15.64%, forest at 15.12%, and open water at 2.28%. The companion forest-and-farmland summary lists grassland at 1.40% and shrubland at 1.34%. Barren land is present in the legend but does not have a separate printed percentage, so no value has been calculated for it.
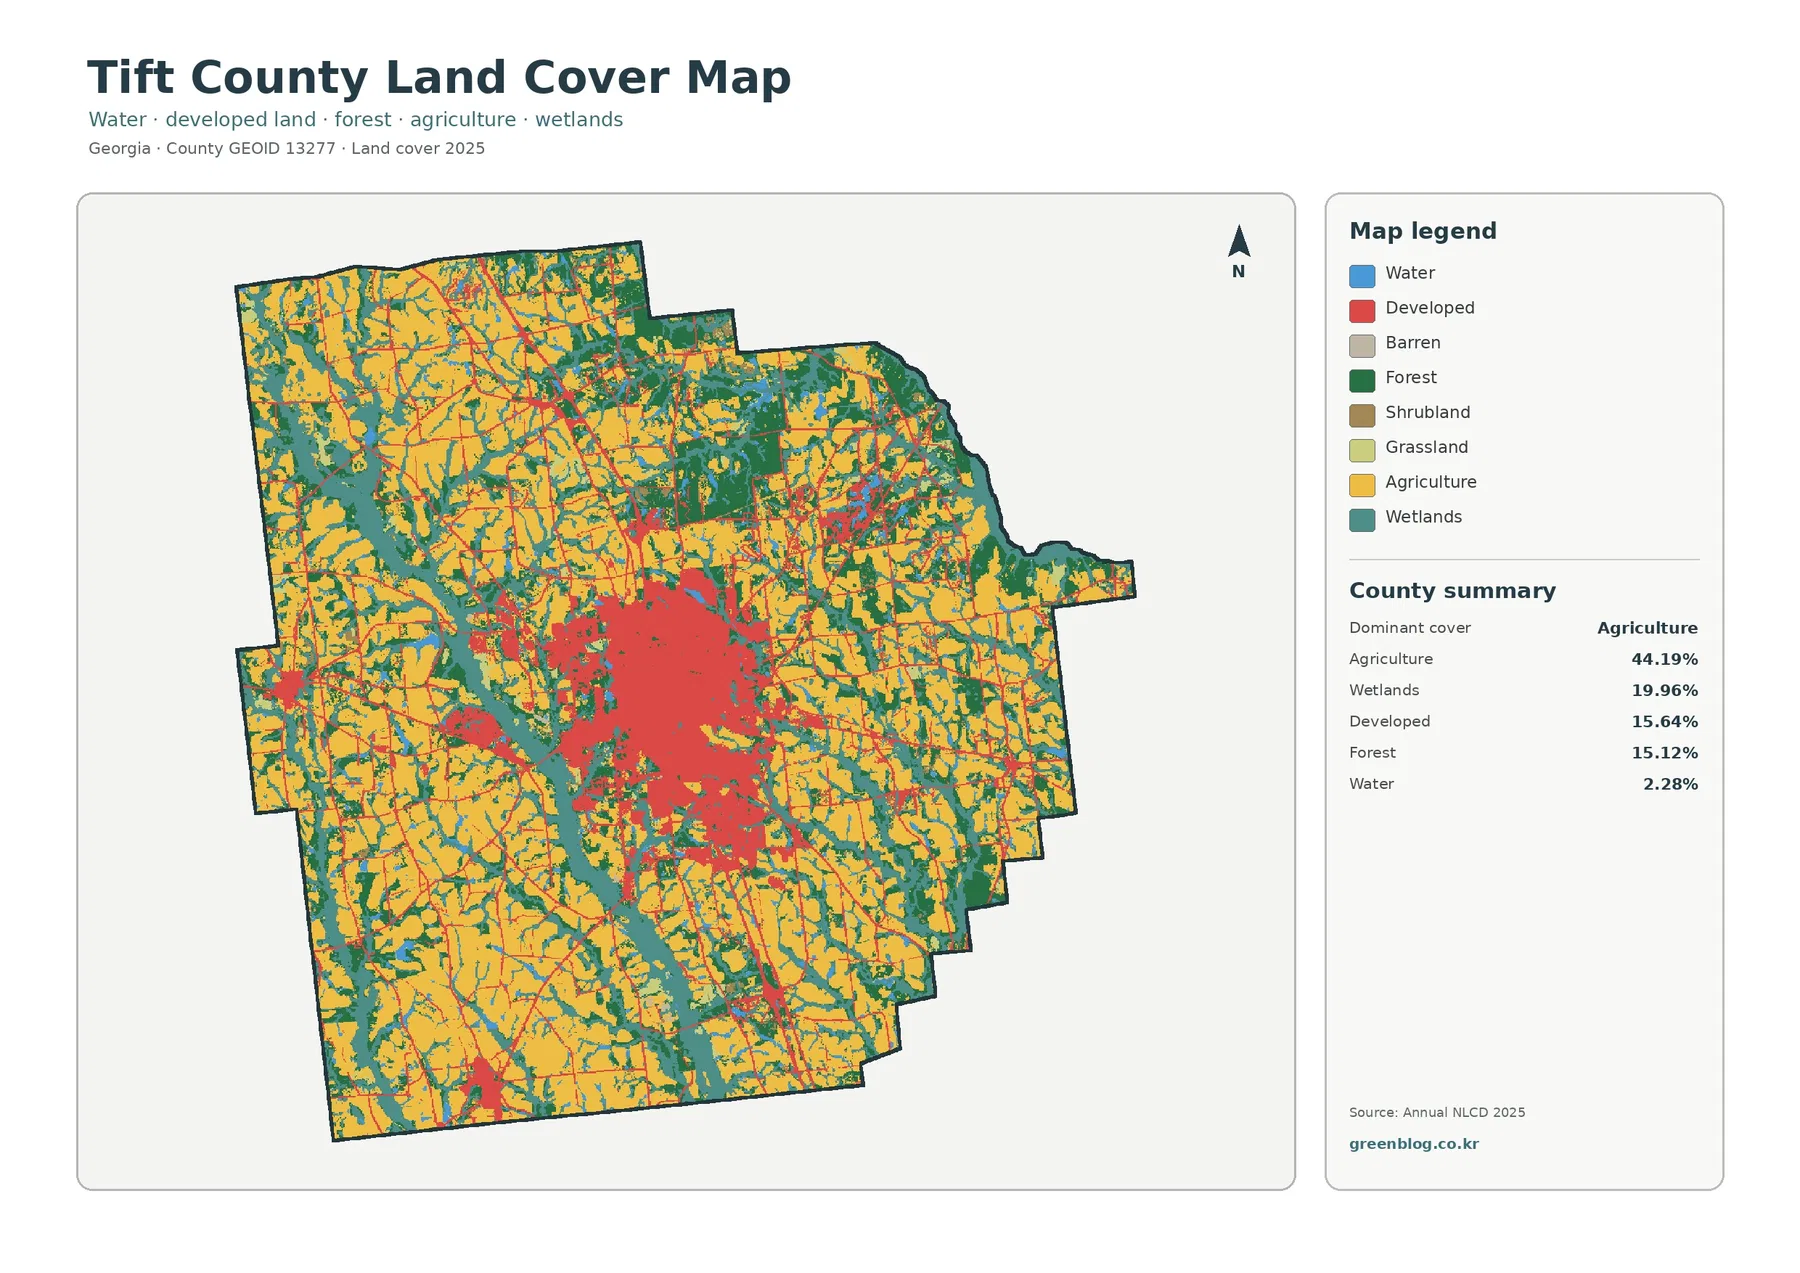
The spatial arrangement is more informative than the ranking alone. Farm-colored blocks dominate the outer landscape, yet teal wetland bands divide them into smaller pieces and dark-green forest patches interrupt the yellow areas. The central developed cluster is much more continuous than the narrow developed lines that extend away from it. That difference in shape helps distinguish the county’s main urban concentration from smaller roads, settlements, and built sites scattered through the rural surroundings.
Open water is only 2.28%, even though wetlands occupy nearly one-fifth of the county. That distinction matters when reading the teal and blue colors. Wetlands are not simply “water areas”; they represent land-cover classes associated with wet ground and vegetation, while open water is mapped separately. Treating them as one category would hide a major part of the county’s rural landscape.
| 2025 land-cover summary | Share |
|---|---|
| Agriculture | 44.19% |
| Wetlands | 19.96% |
| Developed land | 15.64% |
| Forest | 15.12% |
| Water | 2.28% |
| Grassland | 1.40% |
| Shrubland | 1.34% |
These percentages describe mapped cover, not legal land use. An agricultural cell does not establish zoning, ownership, crop type, or whether a parcel is currently being farmed. A developed cell also does not mean that the entire 30-meter area is pavement or a building. The map is strongest as a county-scale picture of what types of surface cover are dominant and how they are arranged.
The forest-and-farmland view reveals how wetlands break up the farm landscape
Removing most developed-color detail makes the rural pattern easier to follow. In the simplified map, agriculture remains the dominant yellow cover, while forest appears in dark green and wetlands in teal. The farm areas are widespread, but they are repeatedly separated by irregular wet and wooded corridors. Large agricultural blocks are especially clear away from the central developed zone, while natural-cover strips create boundaries that are easy to miss on the more colorful general map.
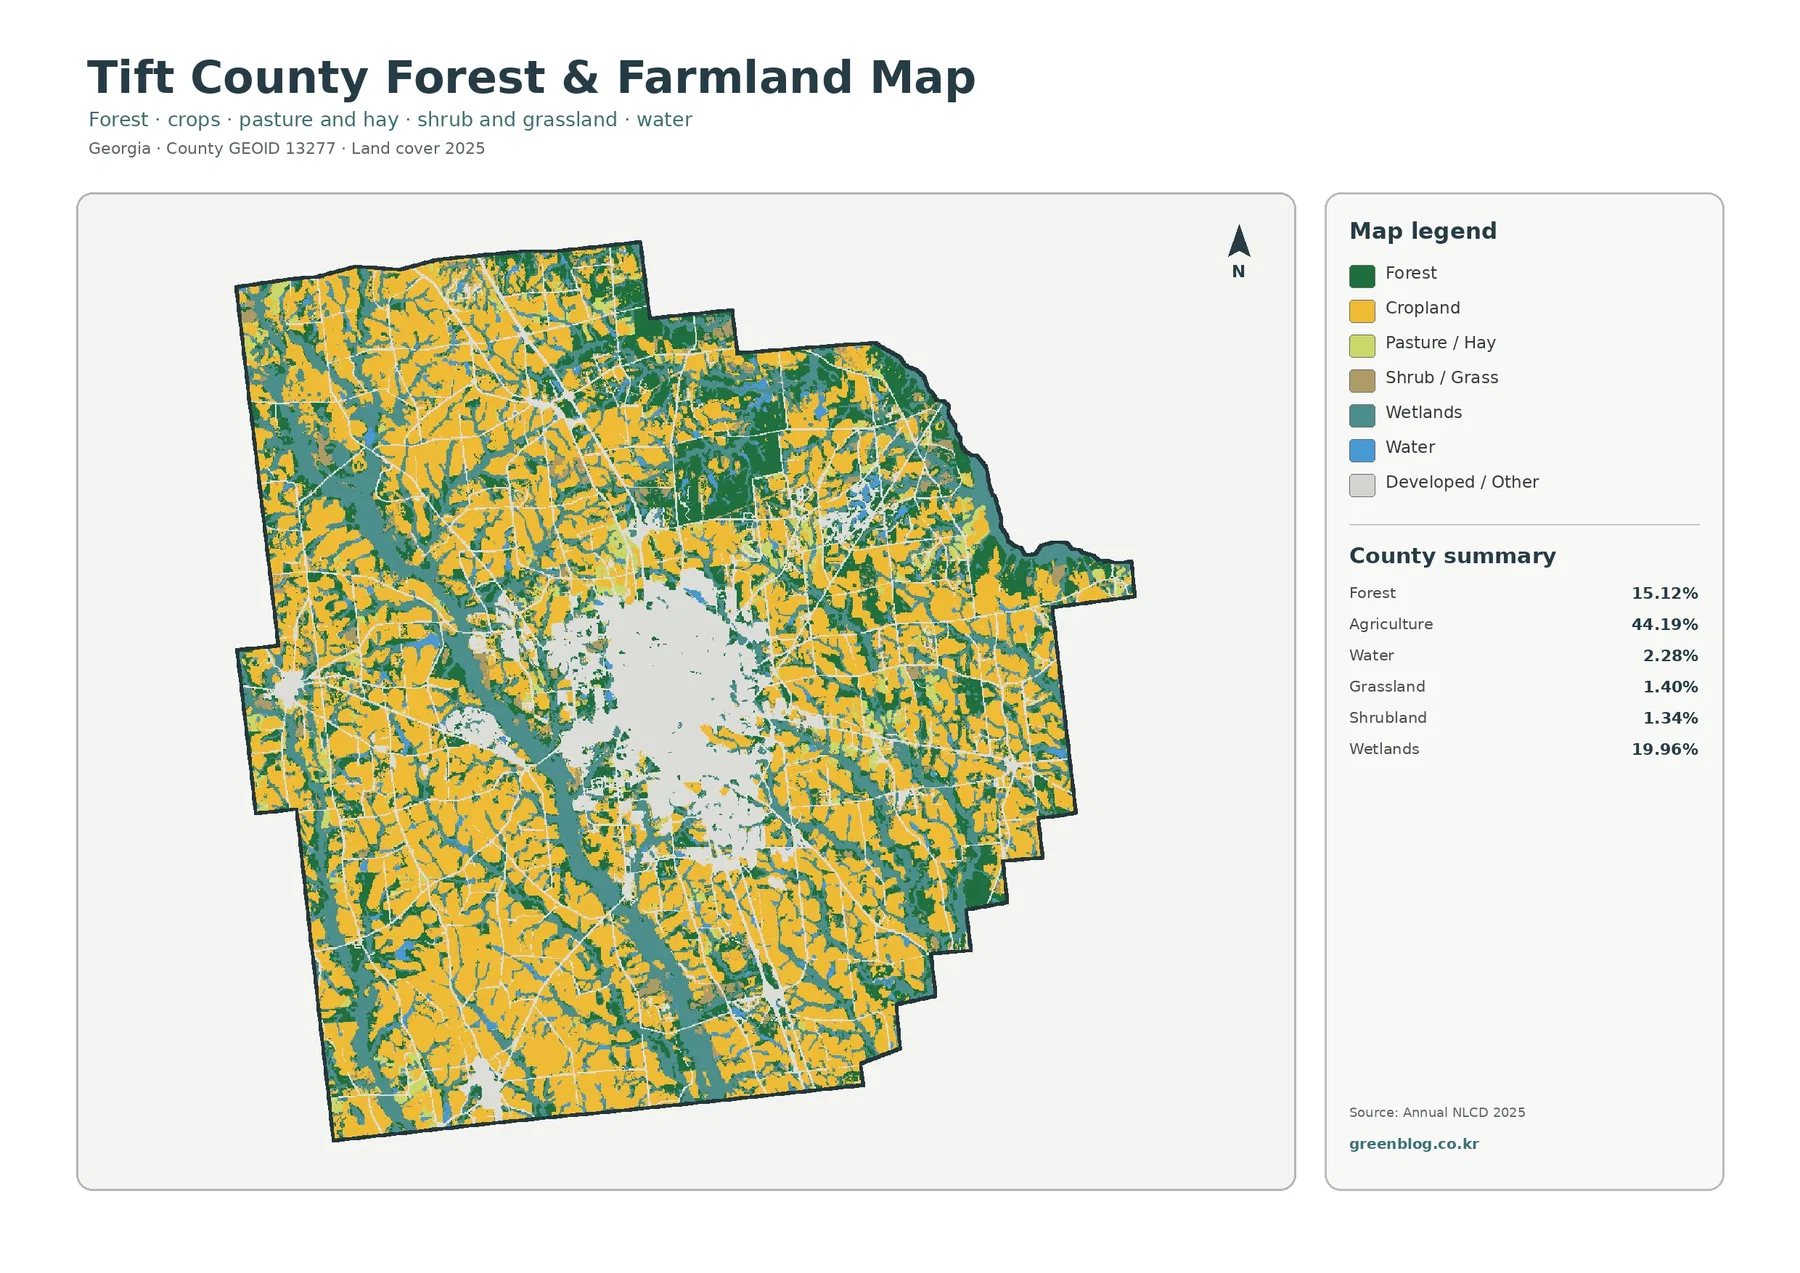
The central area becomes pale on this version because developed and other surfaces are grouped into a neutral class. That visual simplification is useful when the question is not “where is every developed cell?” but “how are farms, forests, and wetlands arranged around the developed center?” Wetlands form winding and branching shapes rather than isolated spots, while forest is distributed in uneven patches and blocks. The result is a mosaic rather than a clean separation between agricultural and natural land cover.
UGA Extension’s Tift County office identifies Agriculture and Natural Resources as one of its service areas and provides research-based education and assistance to county residents. That local context supports the importance of agriculture as a regional topic, but the NLCD colors should not be converted into crop labels. The supplied map does not identify cotton, peanuts, vegetables, pasture, or any other specific commodity. It only shows the broader land-cover classification used by the dataset.
Forest and wetland colors have similar limits. Forest cover does not identify tree species, timber ownership, conservation status, or a management plan. Wetland cover is not a regulatory delineation. These layers can show where broad natural-cover patterns occur at county scale, but parcel decisions require more detailed boundary records, site information, and, when necessary, field investigation.
Impervious cover isolates Tifton’s hard-surface core from the broader developed class
Tift County’s mean impervious value is 4.25%, and 2.38% of the county is mapped at 50% or more impervious cover. Both figures are well below the 15.64% developed-land share on the general map. The reason is simple: developed land-cover classes can contain lawns, trees, soil, and other permeable surfaces, while the impervious layer measures the fraction of a cell occupied by rooftops, pavement, parking areas, and similarly hard surfaces.
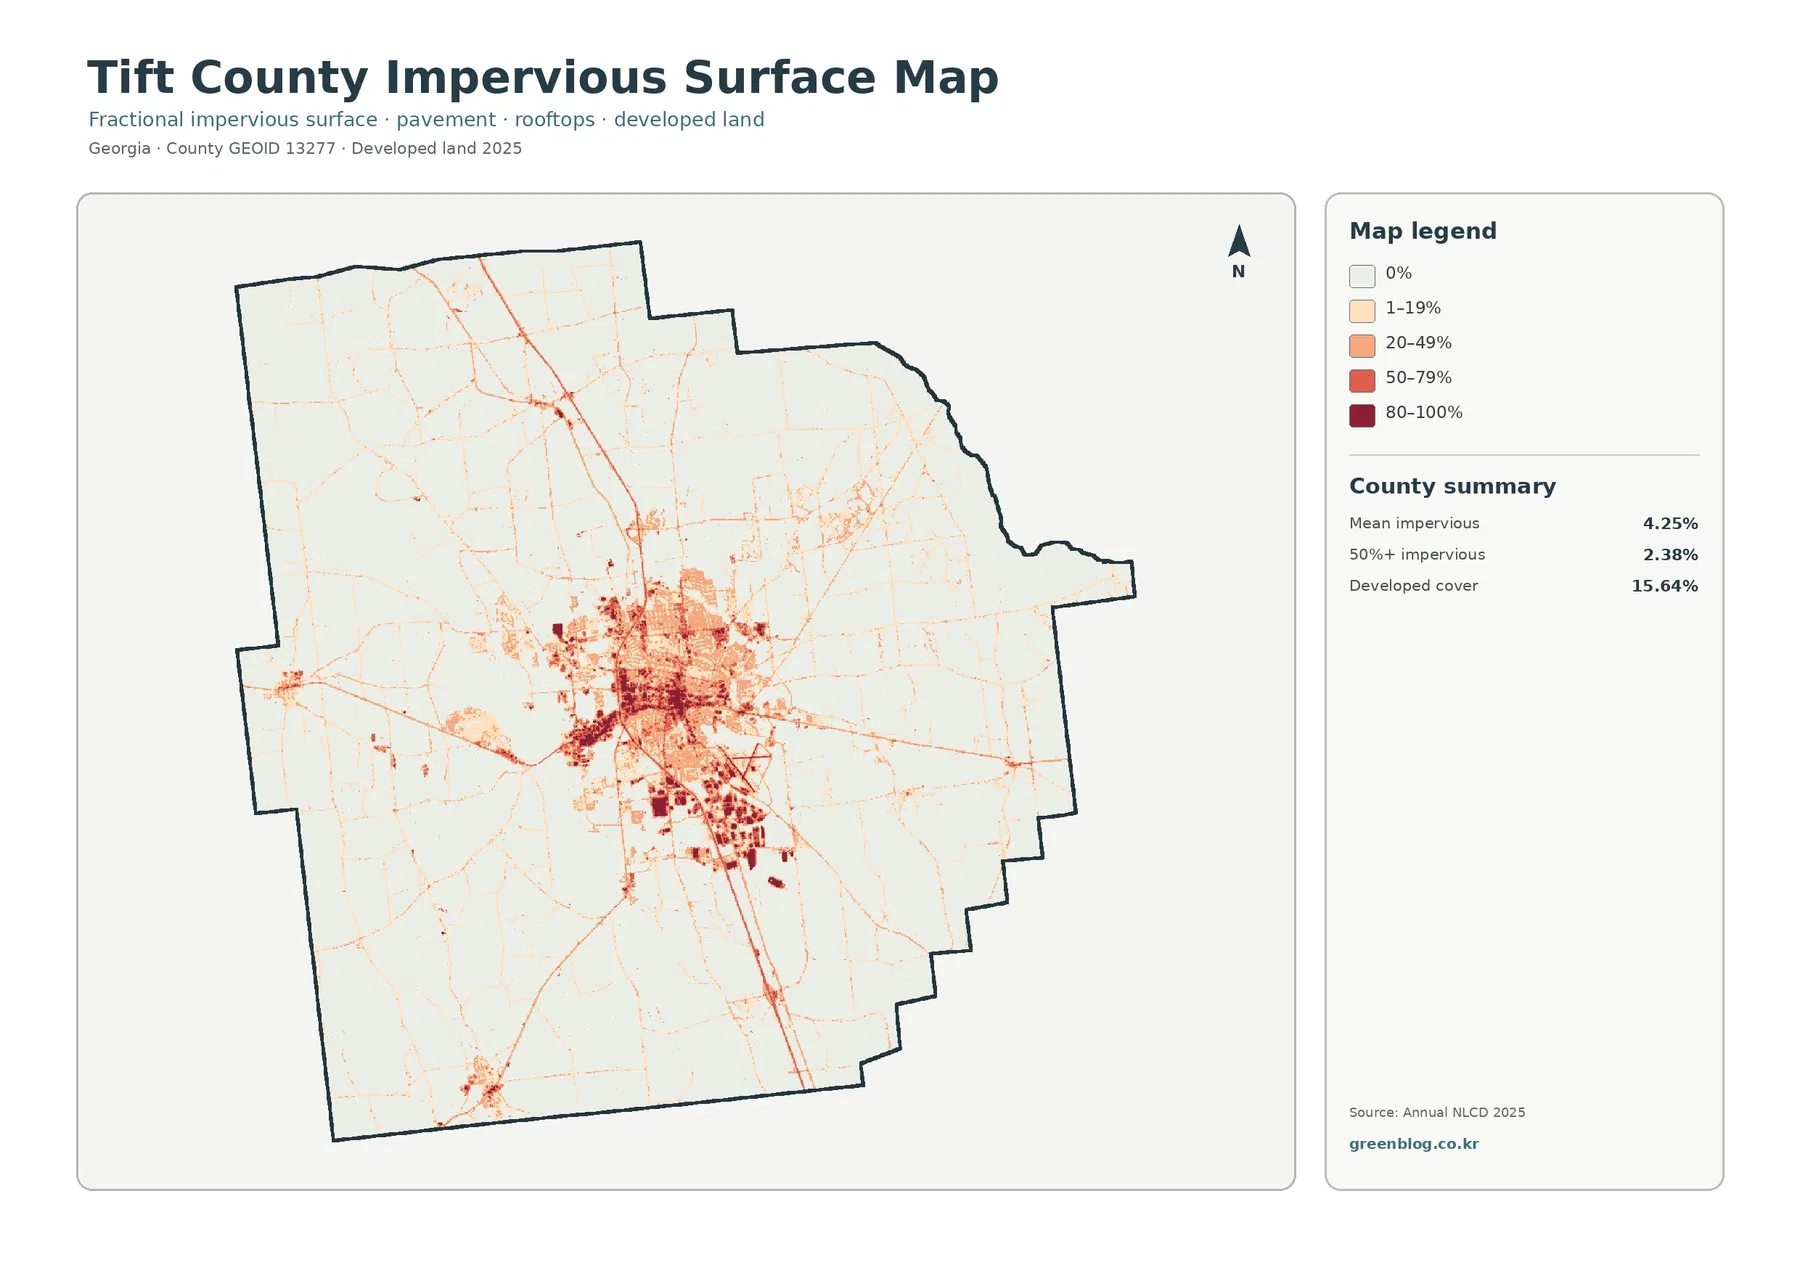
The darkest reds are concentrated in the middle of the county, with thinner lines extending outward and several smaller hard-surface nodes elsewhere. Georgia Department of Community Affairs material describes Tifton as the county seat and largest city of Tift County. That official context makes the central hard-surface concentration consistent with the Tifton area, but the map does not draw municipal boundaries. The colored cluster should therefore be treated as an urban-area pattern rather than an exact outline of the City of Tifton.
A strong north–south and southeast linear structure is visible in the impervious layer, along with smaller scattered patches toward the county edges. Road names are not printed on the supplied map, so those lines should not be assigned to specific highways from the image alone. Census TIGER/Line roads and place boundaries are appropriate companion data when a project needs precise route names or a city-by-city overlay.
| Impervious and developed summary | Share |
|---|---|
| Mean impervious surface | 4.25% |
| Area at 50%+ impervious | 2.38% |
| 2025 developed cover | 15.64% |
Impervious percentage is a useful indicator of surface hardness, but it is not a direct stormwater model. Runoff also depends on rainfall, soil, slope, drainage infrastructure, vegetation, and site design. This map is best used to compare where hard surfaces are concentrated across the county. Engineering design, flood assessment, and drainage decisions need more detailed local data.
The 1985–2025 layer records several kinds of class difference, not one growth rate
The change map reports a total class difference of 20.77% between 1985 and 2025. Within that total, 4.34% is listed as classified to developed, 5.21% as forest loss, 3.99% as agricultural loss, and 4.81% as other difference. Wetland difference appears in the legend, but the supplied summary does not print a separate percentage for it. No remainder has been converted into a wetland-change figure in this article.
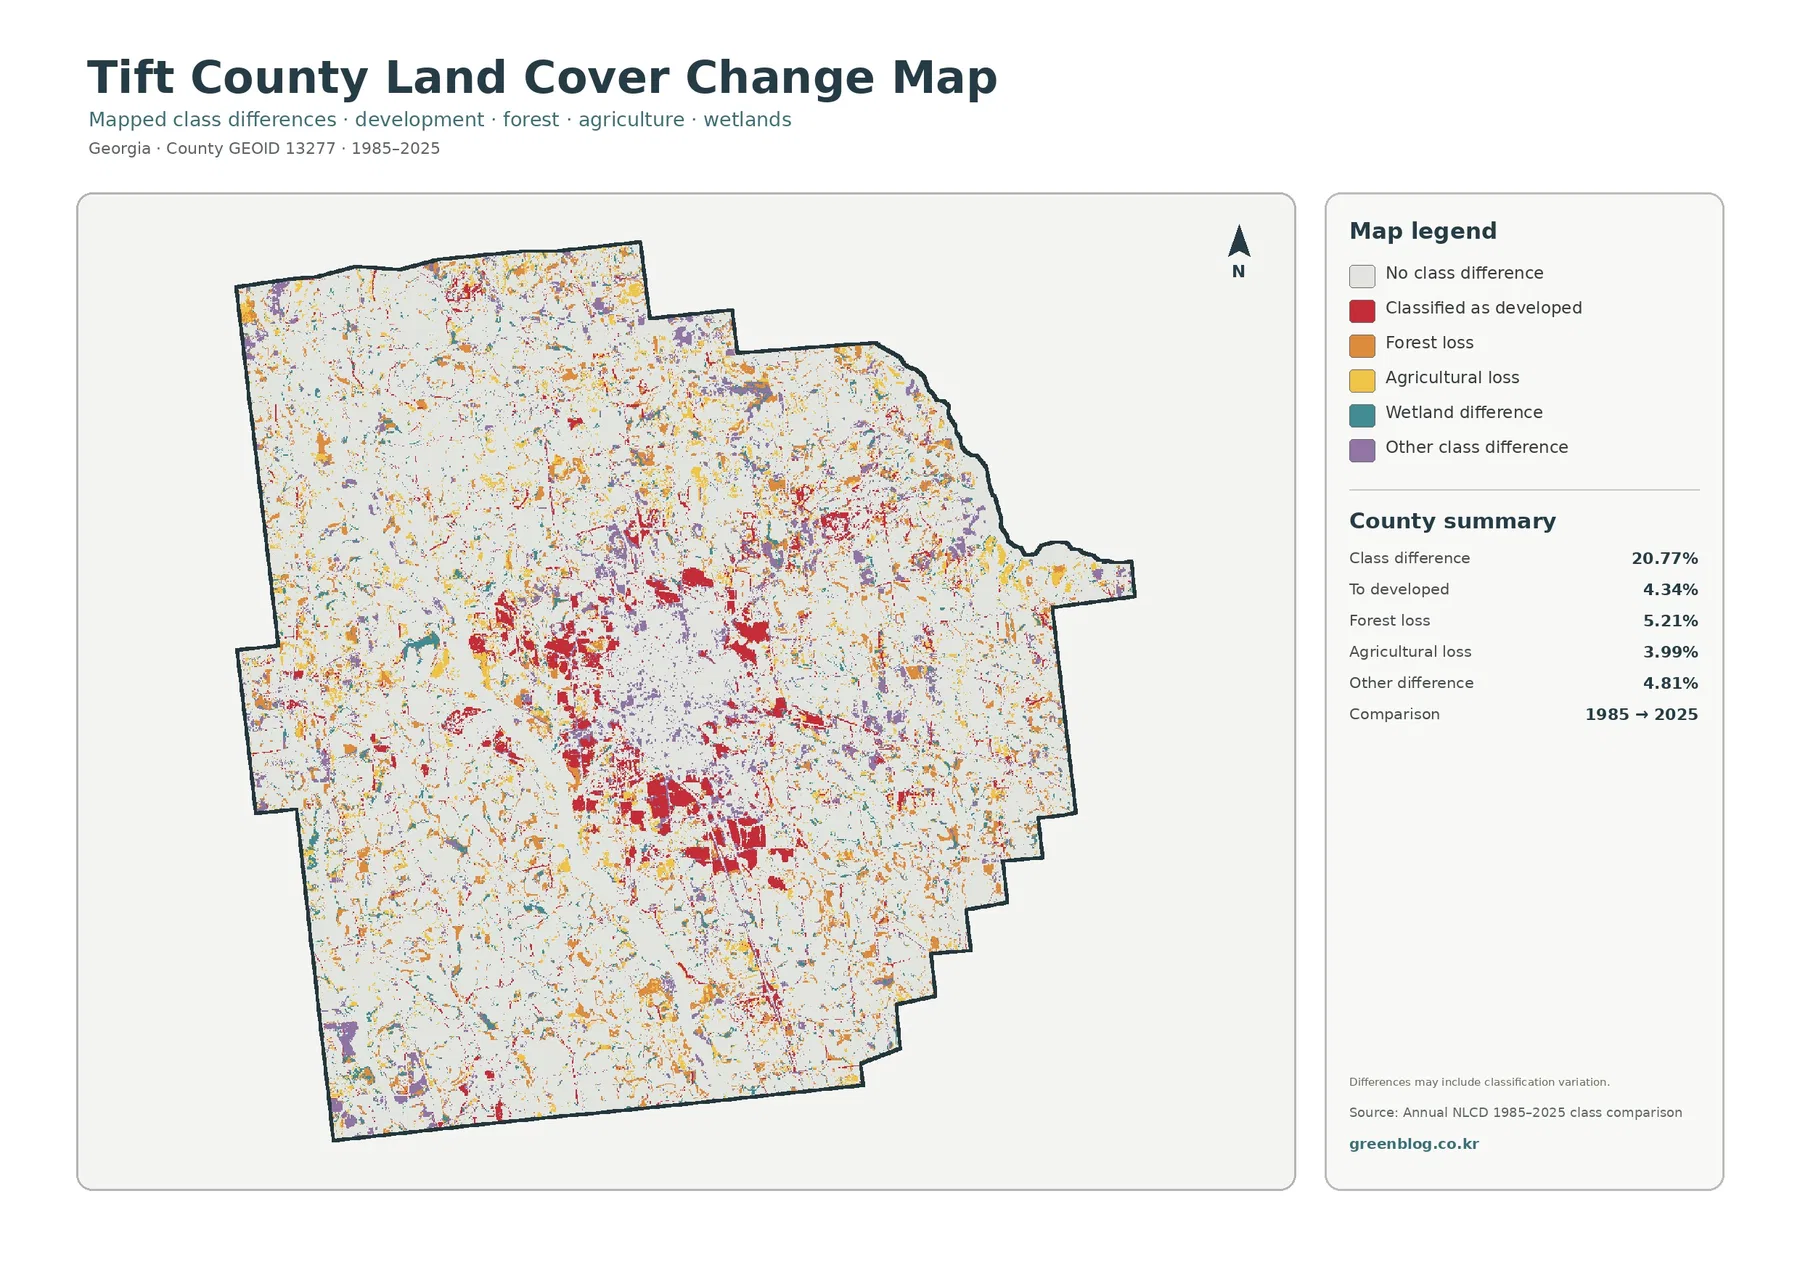
Change colors are scattered across the county, with red developed-change cells more noticeable around the central urban concentration and in several connected patches. Orange and yellow loss categories appear in smaller fragments across the rural landscape, while wetland and other differences add additional fine texture. The pattern does not resemble a single wave moving outward from one point. Multiple cover classes changed or were classified differently over the comparison period.
The 20.77% headline value should not be described as “20.77% urbanized.” The map explicitly separates cells classified to developed at 4.34%, and it also notes that differences may include classification variation. Edge cells, mixed surfaces, imagery differences, and classification methods can all influence a two-date comparison. The layer is a useful screening map for where classifications differ, not a parcel-by-parcel history of land conversion.
| 1985–2025 class-difference summary | Share |
|---|---|
| Total class difference | 20.77% |
| Classified to developed | 4.34% |
| Forest loss | 5.21% |
| Agricultural loss | 3.99% |
| Other difference | 4.81% |
Reading the current and change maps together keeps the time dimension clear. The 15.64% developed share describes the 2025 landscape. The 4.34% figure describes cells that fall into the change map’s developed-change category between 1985 and 2025. Those figures answer different questions and should remain labeled with their map and year whenever they appear in a presentation or report.
Choose the map that matches the question instead of using all four the same way
For a quick county overview, start with the general 2025 map because it combines agriculture, wetlands, developed land, forest, water, grassland, shrubland, and the smaller legend classes in one view. When the main topic is the rural landscape, switch to the forest-and-farmland version. Its simplified colors make agricultural blocks and wetland corridors much easier to compare without the central development colors dominating the page.
The impervious map is the better choice for a discussion of the built environment. It separates a concentrated Tifton-area hard-surface core from the broader developed class and shows how quickly hard-surface intensity drops in most rural parts of the county. The change map should be used only when the question involves the 1985–2025 comparison. Using it as a substitute for the current land-cover map can make historical class differences look like present-day cover.
Tift County planning materials cover the county together with Tifton, Omega, and Ty Ty. Those names provide useful administrative context, but the supplied land-cover maps do not draw city-limit lines. Smaller developed nodes should not be assigned to a particular municipality unless a boundary layer is added. Keeping administrative geography separate from raster land cover makes captions and local comparisons more defensible.
Because each map uses the same county outline, the set also works well for education and regional comparison. A class can be followed from one view to another without changing the frame of reference. For example, a reader can locate the central developed area on the general map, inspect its hard-surface intensity on the impervious map, and then check whether nearby cells are marked as class differences on the change map.
Get the four original 2480×1754 JPG maps in one ZIP
Body previews use 1800×1273 WebP files. The ZIP download contains four original JPG maps at 2480×1754 pixels each: current land cover, forest and farmland, impervious surface with developed land, and the 1985–2025 class-difference map. Because the outlines and layout are consistent, the files can be placed side by side in a document or presentation without having to realign the county shape.
According to the asset manifest, these JPGs are not marked as meeting the package’s A3 high-resolution reference. They are suitable for normal on-screen use and many document layouts, but a test print is sensible before making a large poster. Fine impervious lines and small change-map cells become less distinct as the image is enlarged, so the legend and key percentages should remain readable at the intended output size.
If a map is cropped for a slide, keep its title, year, and legend whenever possible. Red means current developed land on the 2025 land-cover map, while red on the change map marks cells classified to developed in the two-date comparison. Removing the legend can make the 15.64% current developed share and the 4.34% developed-change category look interchangeable even though they measure different things.
Thirty-meter raster cells show county patterns, not surveyed parcel boundaries
Annual NLCD is raster data built from cells of roughly 30 meters. A single cell can include a road edge, trees, a field, a yard, a drainage feature, or a small structure at the same time. The assigned class generalizes that mixed surface. Narrow streams, small buildings, and sharp field boundaries may therefore look wider, narrower, or more simplified than they do in detailed aerial imagery.
Land cover also differs from zoning, ownership, and permitted use. Agriculture on the map does not prove that a parcel is legally zoned for farming. Forest does not identify a public property or protected tract, and wetland cover is not a regulatory wetland delineation. Development, conservation, property, and permitting decisions should use the official records and field methods designed for those purposes.
The current layers summarize 2025 conditions, while the change layer compares 1985 and 2025. Construction, clearing, regrowth, crop changes, or other events after 2025 are not represented. Recent aerial imagery and local records are appropriate when the latest condition of a specific site matters. At county scale, however, the four supplied maps consistently show broad agriculture, extensive wetland corridors, a concentrated central hard-surface area, and a mix of class differences across the rural landscape.
Every percentage used here comes directly from the summaries printed on the supplied maps. No acreage, unprinted class share, crop-specific percentage, or wetland-change value has been inferred. Staying within those reported values makes the maps easier to compare with other counties and avoids turning a visual classification into a claim the source does not support.
Frequently Asked Questions
What is the largest 2025 land-cover class in Tift County?
Agriculture is the largest at 44.19%. Wetlands account for 19.96%, developed land 15.64%, forest 15.12%, and water 2.28%. That summary also lists grassland at 1.40% and shrubland at 1.34%.
Why is developed land 15.64% while mean impervious cover is only 4.25%?
A developed land-cover cell can still contain lawns, trees, soil, and other permeable surfaces. The impervious layer measures the fraction occupied by hard surfaces such as rooftops, pavement, and parking areas, so its countywide mean is lower.
Does the 20.77% class difference from 1985 to 2025 mean 20.77% of Tift County became urban?
No. Only 4.34% is listed as classified to developed. The total also includes 5.21% forest loss, 3.99% agricultural loss, 4.81% other difference, wetland differences, and possible classification variation noted on the supplied map.
Map File Information
Four original JPG maps for Tift County are included in the ZIP: 2025 land cover, forest and farmland, impervious/developed land, and mapped land-cover class differences from 1985 to 2025.
- Printable Size: 2480×1754 pixels each
Related Maps
- Appling County Georgia Land Cover Map
- Atkinson County Georgia Land Cover Map
- Bacon County Georgia Land Cover Map
Sources and references
- MRLC Annual NLCD Data – official access point for the Annual NLCD data represented in the supplied 2025 maps.
- USGS Annual NLCD Land Cover Classification – official explanation of the land-cover classes used by Annual NLCD.
- U.S. Census Bureau TIGER/Line Shapefiles – official boundary and geographic reference data for county, place, and road context.
- UGA Extension Tift County – county-level research-based services in agriculture, natural resources, and other community topics.
- Georgia DCA Tift County Comprehensive Plan – official planning materials for Tift County and the cities of Omega, Tifton, and Ty Ty.
- Georgia DCA City of Tifton Comprehensive Plan Update – official local planning material identifying Tifton as the Tift County seat.
Green Map creates custom-edited map images using open geographic data sources such as geoBoundaries, Natural Earth, OpenStreetMap, and government open data.
These maps are edited visual materials, not raw data files, and are provided for education, documents, presentations, and graphic reference.