Utah has a distinctive population geography: most residents are concentrated in a relatively narrow north-central corridor, while vast portions of the state remain sparsely settled. The strongest urban pattern runs from the Ogden and Layton area through Salt Lake Valley and south into Utah Valley around Lehi, Orem, and Provo. Logan forms another northern center, and St. George stands out as the major population cluster in the southwest. Eastern and southern interior counties cover large areas but contain far fewer residents.
The supplied 2024 ACS 5-year estimates place Utah’s population at 3,392,331. Using the county population and density data in the project, the statewide average is roughly 41 people per square mile. That average hides an enormous internal range: Salt Lake County averages about 1,589 people per square mile, while Garfield County is close to one. Current size and historical growth also produce different rankings. Salt Lake County leads population and density, but Wasatch County recorded the fastest percentage growth from 2010 to 2020.
Table of Contents
The census-tract map shows a long north-central settlement spine from Ogden through Salt Lake to Provo
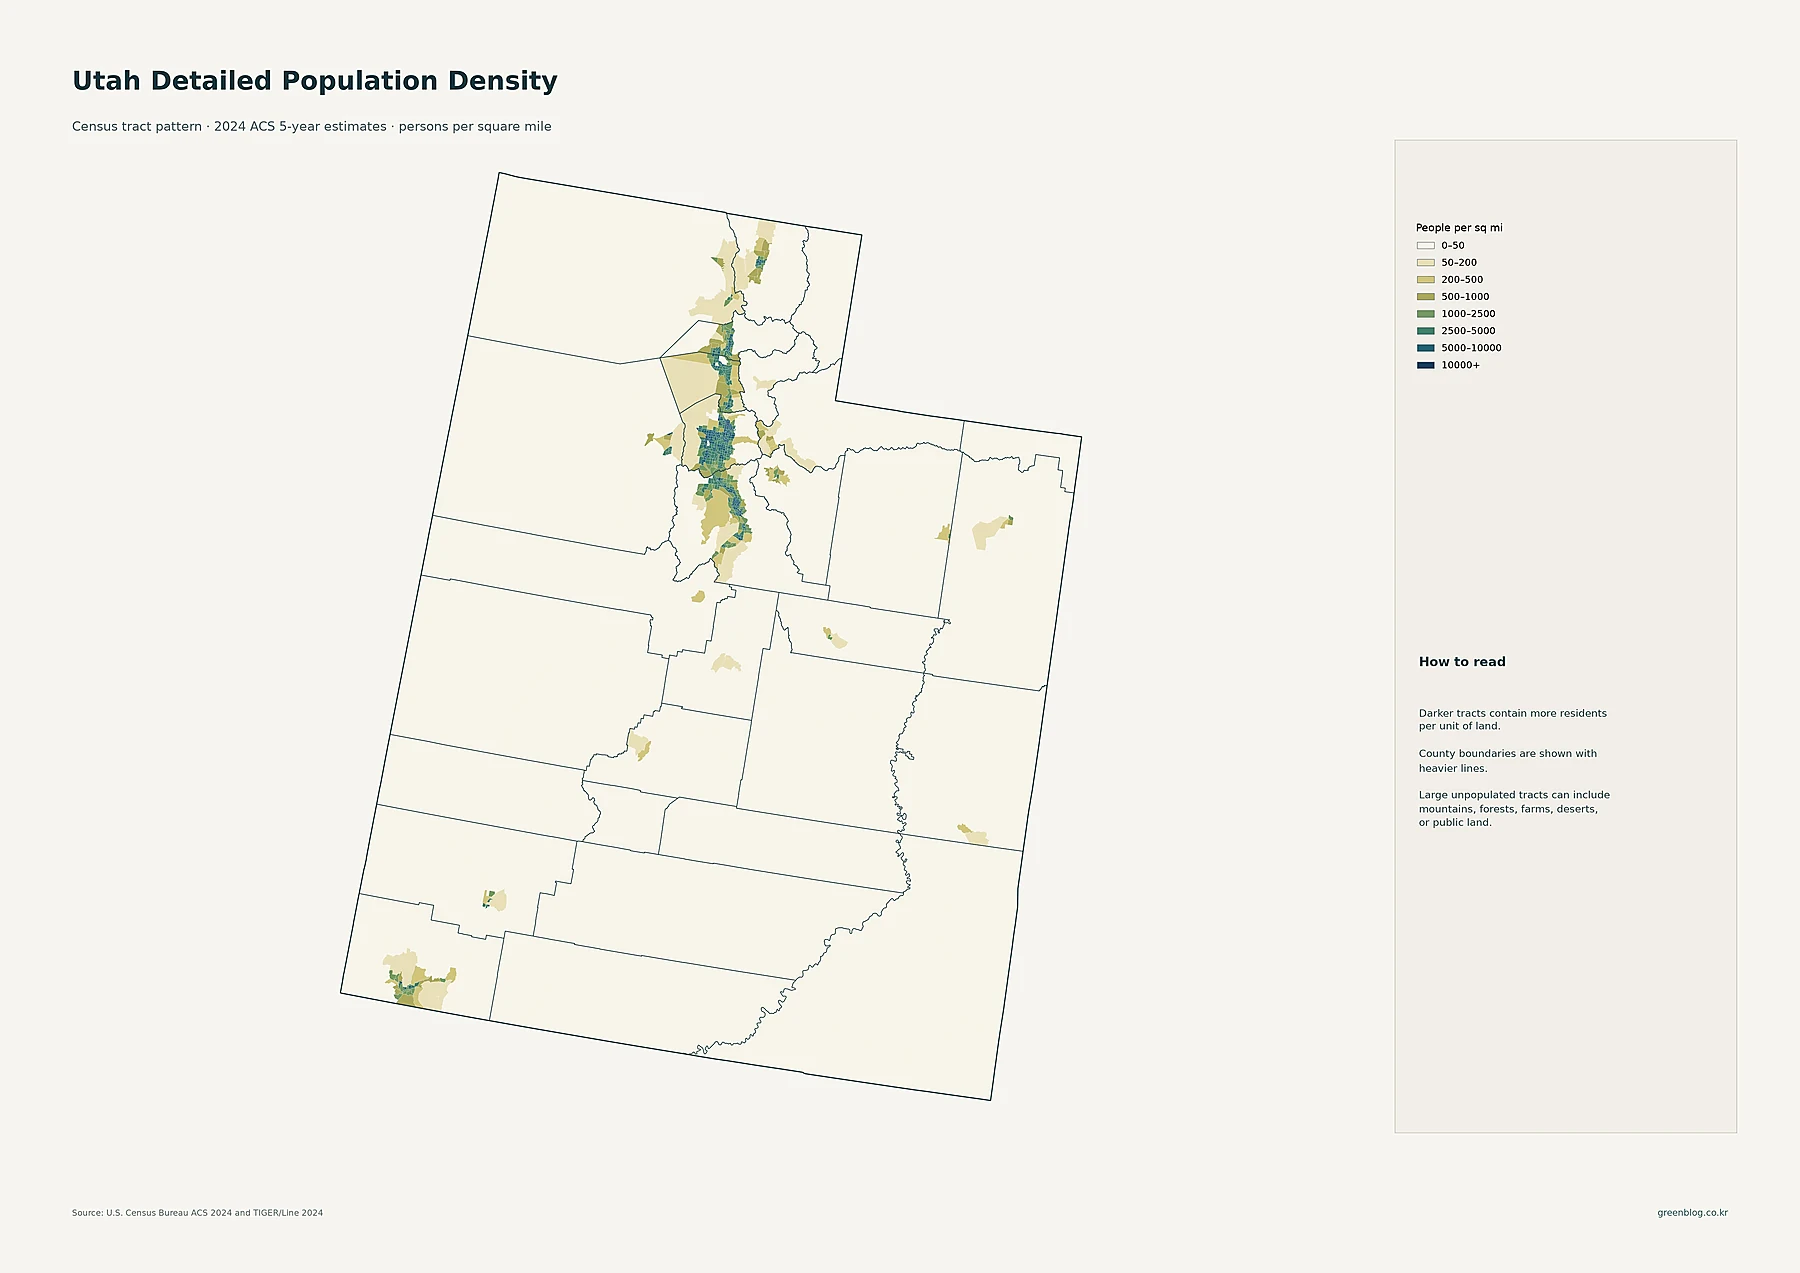
The most obvious tract-level pattern follows the Wasatch Front. Salt Lake City and West Valley City sit inside a broad group of high-density tracts in Salt Lake County. That concentration continues south through West Jordan, Sandy, South Jordan, and Draper and then into Utah County, where Lehi, Orem, and Provo form another large group of medium- and high-density tracts. County boundaries are visible, but the settlement pattern reads as one long urbanized corridor.
North of Salt Lake County, dense tracts continue through Davis County and into Weber County around Layton, Clearfield, and Ogden. Logan creates a smaller but distinct concentration in Cache Valley. These northern clusters are separated from one another less sharply than the vast low-density areas farther east and west, reinforcing the importance of the north-central corridor in Utah’s current population distribution.
Southwestern Utah has a separate cluster around St. George. Washington County is much less dense on average than Salt Lake, Davis, Weber, or Utah counties, yet the tract map shows a compact settlement concentration around St. George and nearby communities. Across much of eastern and southern Utah, most tracts fall into the 0–50 people-per-square-mile class. The tract layer is therefore especially useful for separating localized cities from the large low-density landscapes surrounding them.
Salt Lake City is the largest census place, but Utah’s urban corridor contains many sizable cities
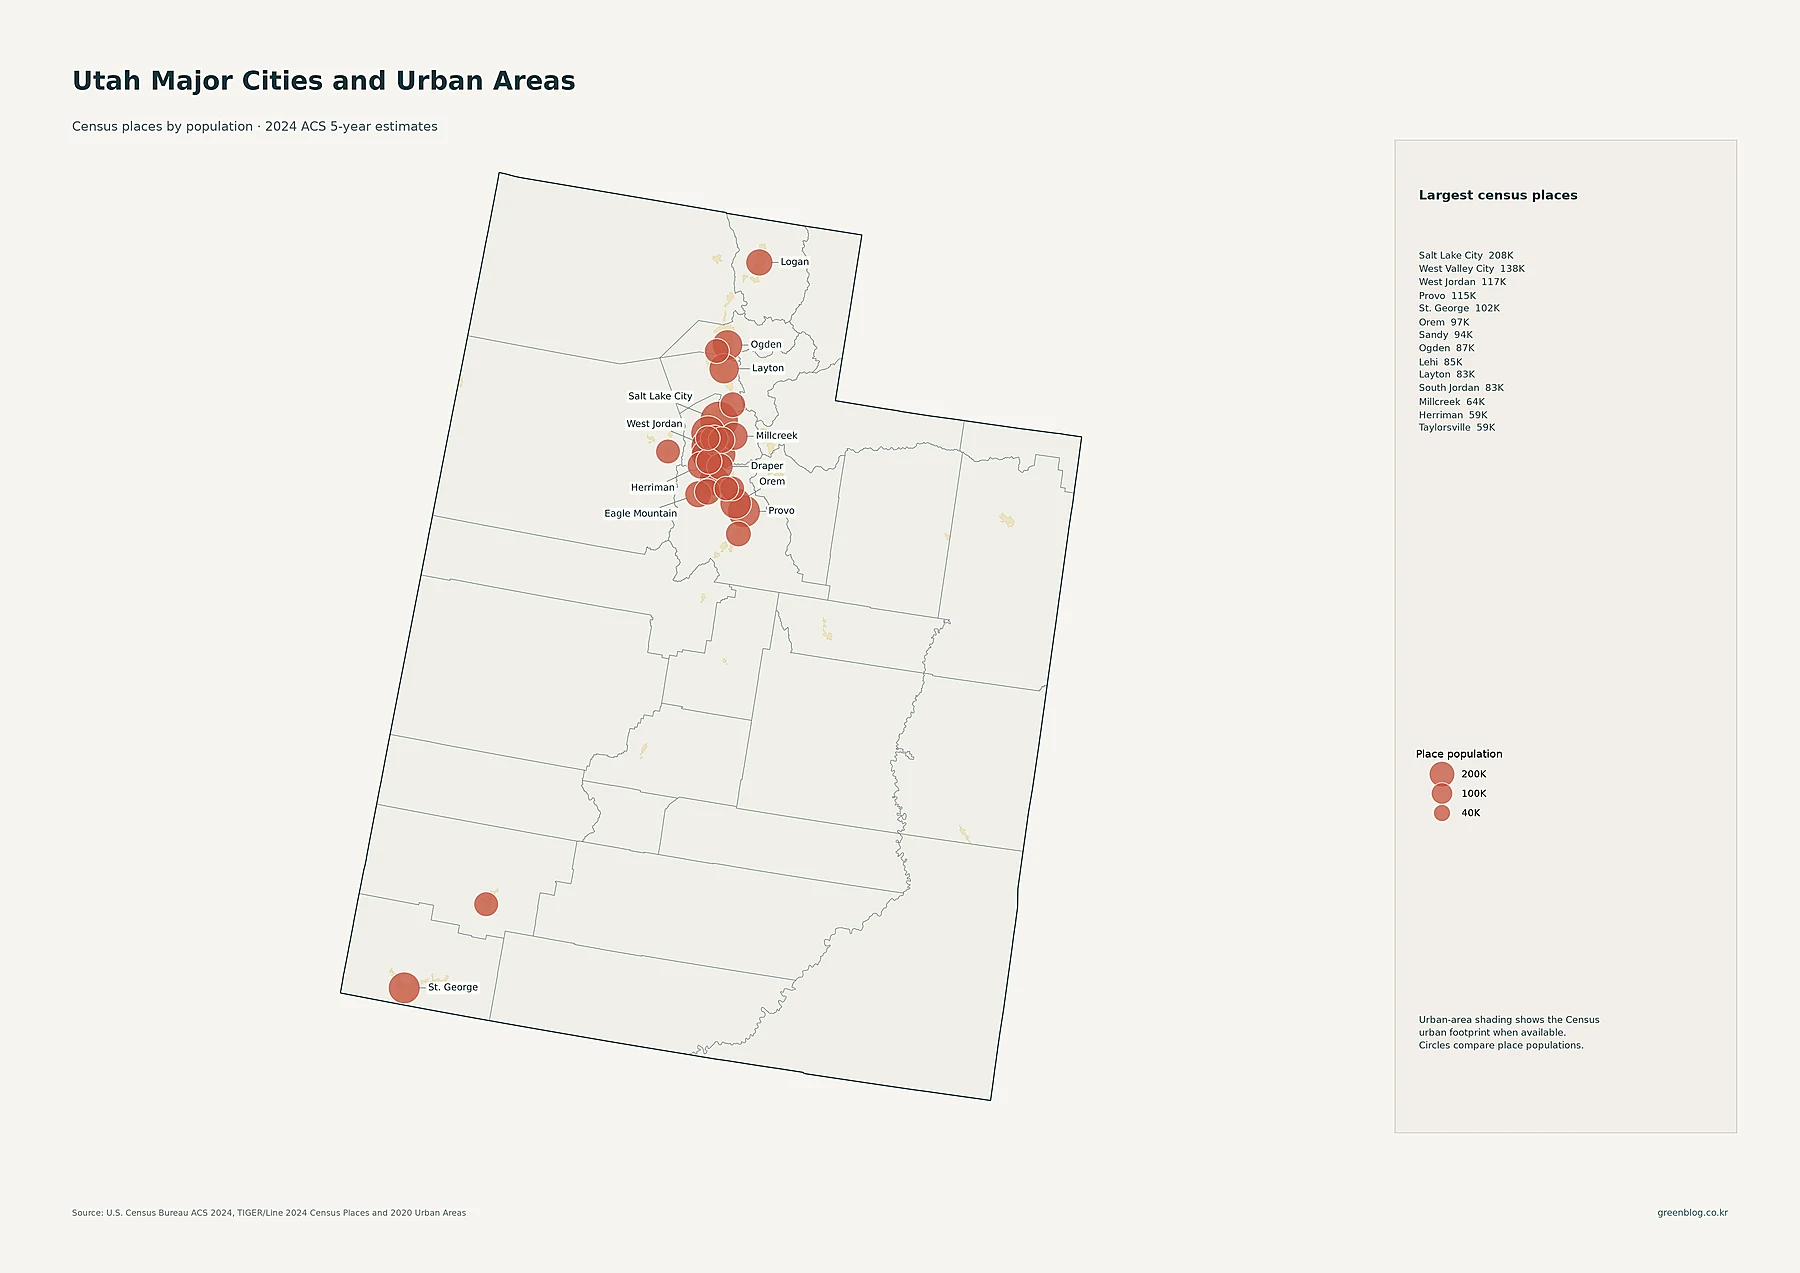
Salt Lake City has 208,007 residents in the supplied census-place data, making it the largest place in Utah. West Valley City is second at 138,437, followed by West Jordan at 116,692 and Provo at 114,766. St. George has 101,995 residents, Orem 97,182, Sandy 94,291, Ogden 87,413, Lehi 85,173, Layton 83,286, and South Jordan 82,686.
The next group includes Millcreek at 63,648, Herriman at 59,346, Taylorsville at 58,678, Logan at 54,907, Eagle Mountain at 53,290, Draper at 50,278, Murray at 50,188, and Saratoga Springs at 48,425. The ranking illustrates an important feature of Utah: the largest city is not surrounded by empty suburbs. Instead, Salt Lake Valley and Utah Valley contain many independently named cities with substantial populations located close together.
The proportional circles represent total place population, not density. Salt Lake City’s larger circle means it contains the most residents within its census-place boundary. It does not establish the highest density among all cities. The tract map is better for seeing how closely residents are packed and how the separate municipalities combine into a wider continuous settlement pattern.
Salt Lake County has nearly 1.2 million residents, while Utah County has more than 700,000
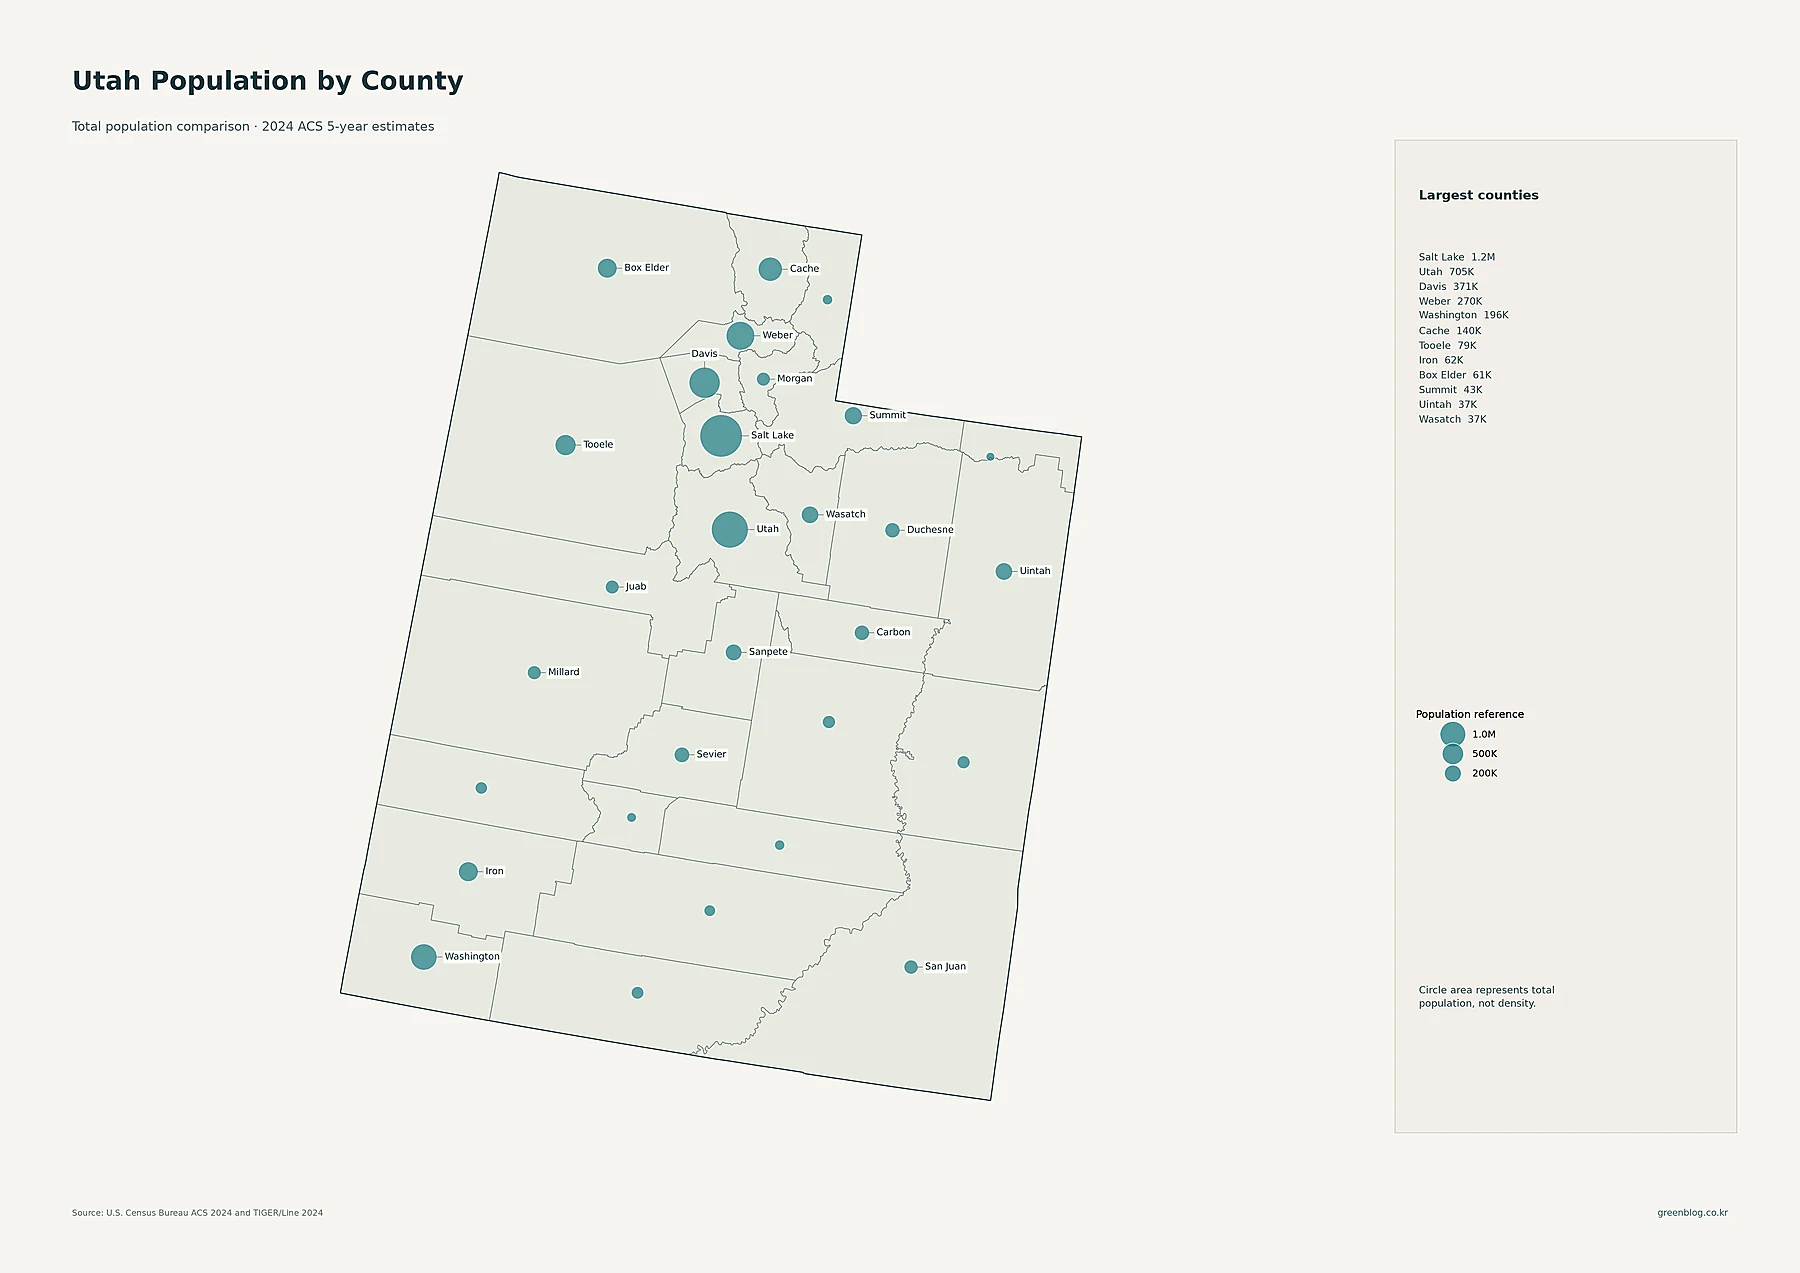
Salt Lake County has 1,196,523 residents, by far the largest county total in the supplied data. Utah County follows with 705,400. Davis County has 370,924 residents and Weber County 269,648. Together, these four counties account for most of the population along the north-central urban corridor. Washington County, with 196,431 residents, is the largest county population outside that main northern concentration, and Cache County has 140,046.
Tooele County has 79,347 residents, Iron County 62,252, Box Elder 61,246, Summit 42,970, and Wasatch 36,642. At the smaller end, Daggett County has 783 residents, Piute 1,694, Wayne 2,584, and Rich 2,631. The difference between a county with almost 1.2 million residents and another with fewer than one thousand illustrates the extreme concentration of Utah’s population.
County totals answer how many people live inside each county boundary. They do not account for land area. Washington County, for example, has a large population by Utah standards but covers enough land that its county-average density is well below the four leading Wasatch Front counties. Density changes the ranking by adding the denominator of land area.
Salt Lake and Davis counties lead density, while many southern and eastern counties average only a few people per square mile
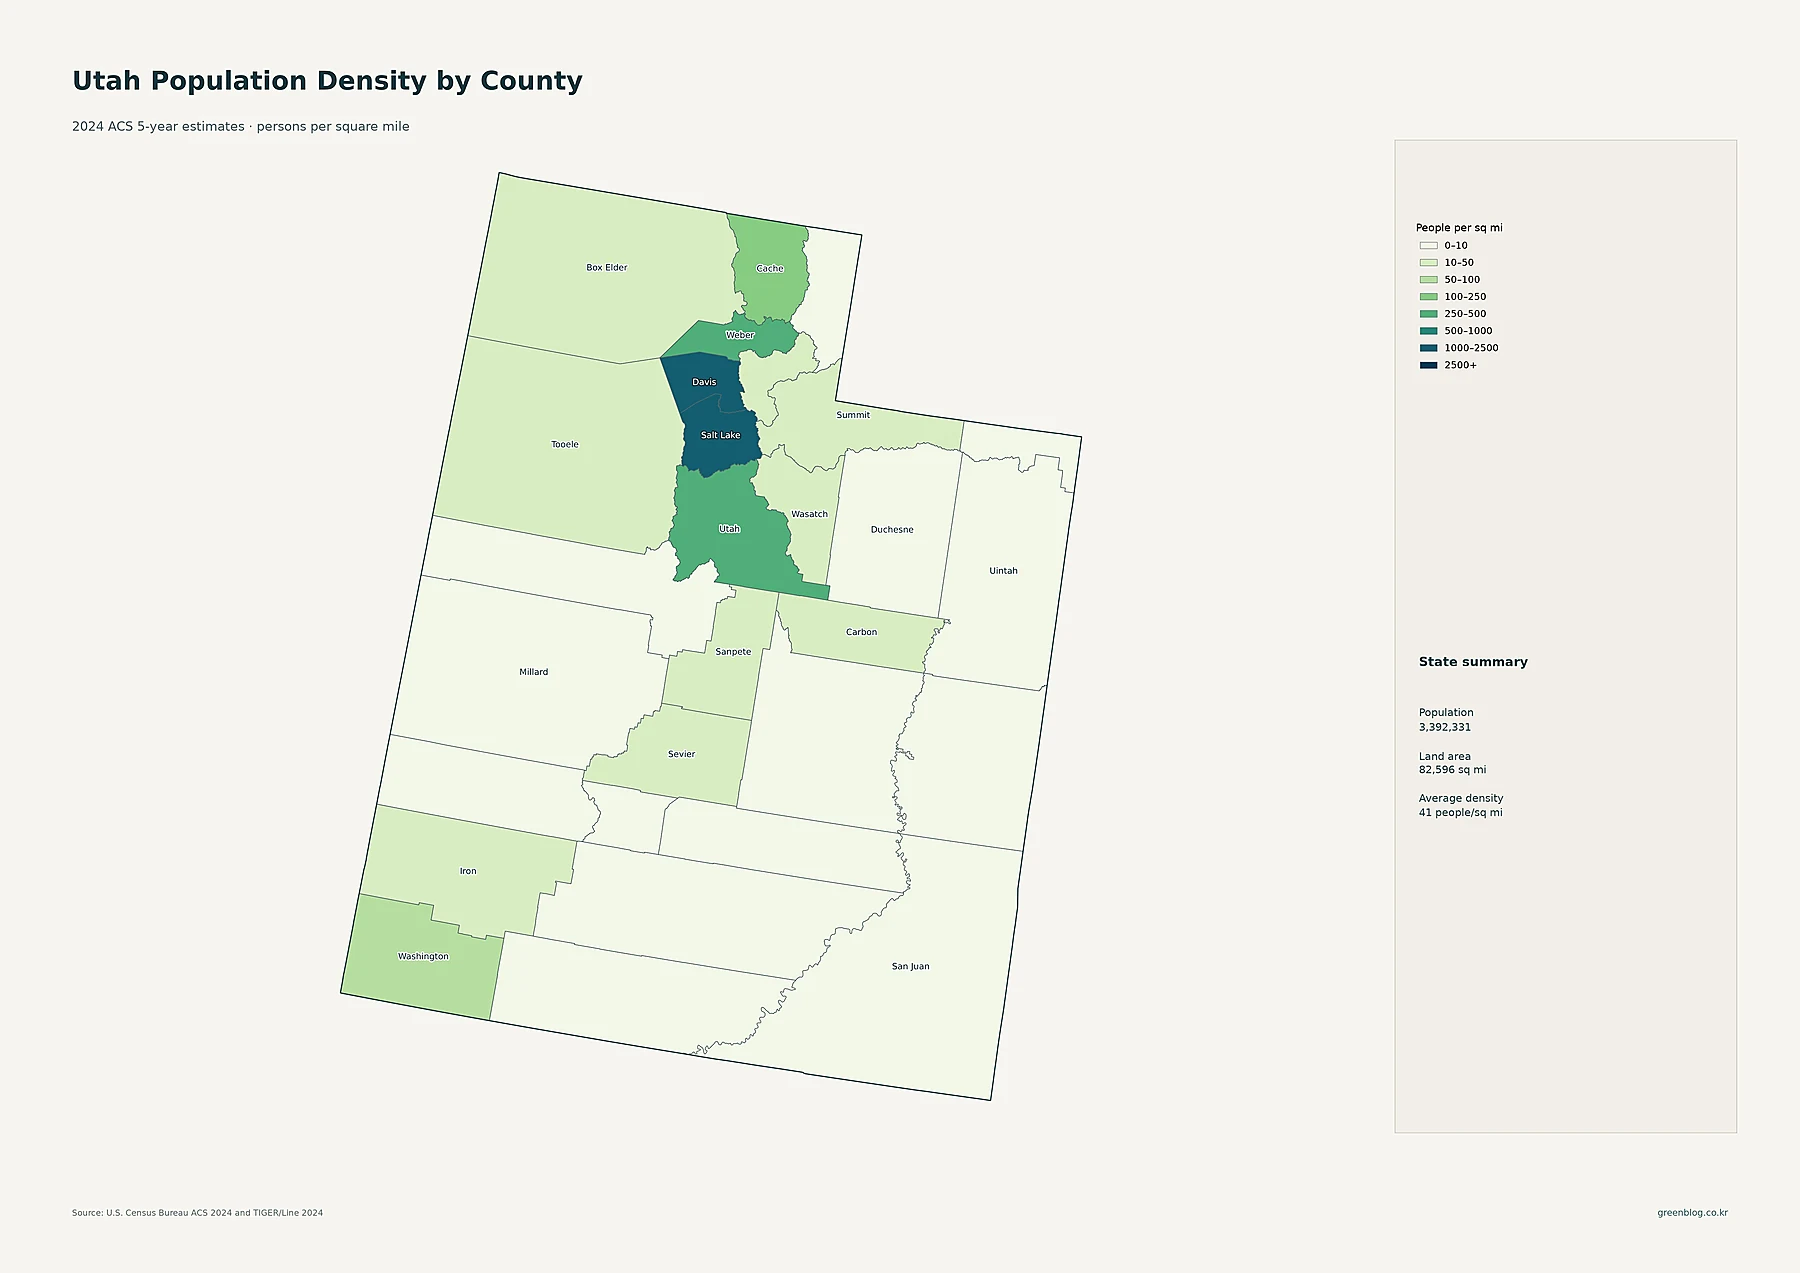
Salt Lake County has the highest average density at about 1,589.3 people per square mile. Davis County is second at about 1,142.2. Weber County averages about 441.3 and Utah County 351.9. Cache County is about 120.2, while Washington County is about 80.9 people per square mile. The top of the density ranking therefore closely follows the north-central urban spine visible on the census-tract map.
Wasatch County averages about 31.1 people per square mile, Summit 23.0, Morgan 21.0, and Iron 18.9. The lowest county averages are dramatically smaller: Garfield is about 1.01 person per square mile, Wayne 1.05, Daggett 1.12, San Juan 1.85, and Millard 1.96. Salt Lake County is therefore more than a thousand times denser than the sparsest counties.
The statewide average of roughly 41 people per square mile compresses this range into one number. Northern urban counties are far denser than the average, while much of the south and east remains extremely sparse. St. George is an important population center, but the broad land area of Washington County keeps the countywide average below 100 people per square mile.
| Measure | Leading area | Value in supplied data |
|---|---|---|
| State population | Utah | 3,392,331 |
| Largest place population | Salt Lake City | 208,007 |
| Largest county population | Salt Lake County | 1,196,523 |
| Highest county density | Salt Lake County | about 1,589.3/sq mi |
| Fastest 2010–2020 growth | Wasatch County | +47.8% |
| Largest 2010–2020 decline | Daggett County | -11.7% |
Wasatch County led 2010–2020 growth, with strong gains in Washington, Morgan, and Utah counties
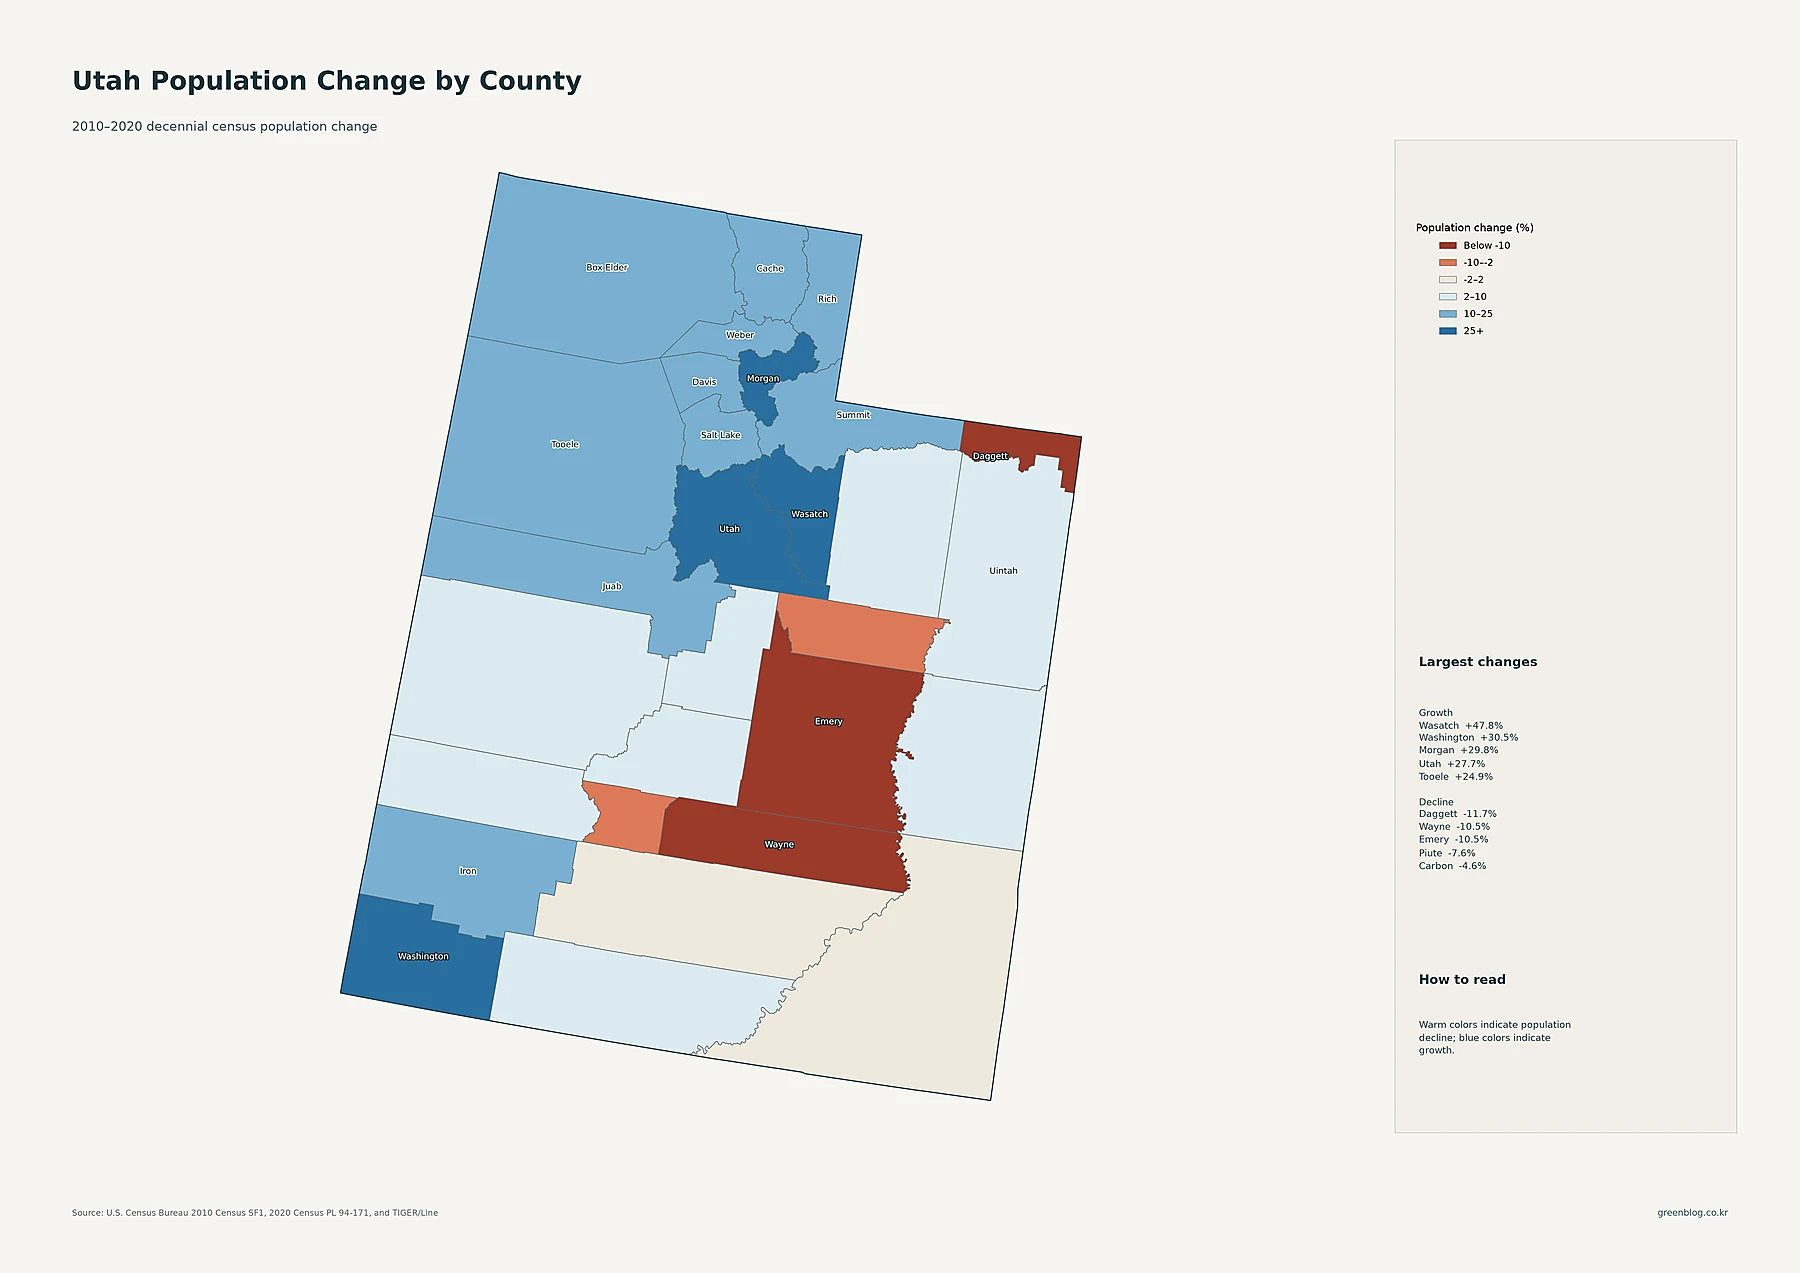
Wasatch County recorded the fastest percentage increase in the supplied decade data. Its population rose from 23,530 in 2010 to 34,788 in 2020, an increase of about 47.8%. Washington County grew from 138,115 to 180,279, or about 30.5%. Morgan County increased 29.8%, Utah County 27.7%, Tooele County 24.9%, and Iron County 24.1%.
The large north-central counties also grew substantially. Davis County increased 18.3%, Cache 18.2%, Summit 16.6%, Box Elder 15.4%, Salt Lake 15.1%, and Weber 13.4%. That means Utah’s existing population core continued to add residents, but the fastest percentage growth occurred in smaller adjacent or regional counties. Salt Lake County remains the current population and density leader, while Wasatch County leads the 2010–2020 growth ranking.
Several counties moved in the opposite direction. Daggett County fell from 1,059 residents in 2010 to 935 in 2020, a decline of about 11.7%. Wayne County declined 10.5%, Emery County also about 10.5%, Piute County 7.6%, and Carbon County 4.6%. Garfield declined 1.7% and San Juan 1.5%. The warm colors on the map are therefore concentrated in several central, eastern, and southern counties rather than in Utah’s main urban corridor.
These percentages belong specifically to the 2010–2020 decennial-census period. They should not be presented as changes in the 2024 ACS estimate. The 2024 layers describe the current estimated population and density, while the historical map describes how county population changed during the previous census decade.
Utah’s current population core and its fastest-growing counties overlap, but they are not identical
The five maps tell a consistent but multi-layered story. Salt Lake County dominates current population and density. Davis, Weber, and Utah counties extend that concentration along the Wasatch Front, and the place map shows many sizable cities packed into Salt Lake Valley and Utah Valley. Logan adds a northern regional center, while St. George creates a major southwestern cluster far from the main urban spine.
The historical map shifts attention toward Wasatch, Washington, Morgan, Utah, Tooele, and Iron counties, which all posted strong percentage gains during the 2010s. Meanwhile, Daggett, Wayne, Emery, and several other sparsely populated counties declined. The best way to understand Utah is therefore to keep place totals, county totals, county density, tract-level density, and historical change separate. Together, those layers show a concentrated north-central settlement spine, expanding adjacent counties, a growing southwestern hub, and vast low-density landscapes beyond them.
Download the Utah population map collection
The ZIP includes detailed census-tract density, major cities and urban areas, county population totals, 2010–2020 county population change, and county population density.
FAQ
Which Utah county has the largest population?
Salt Lake County is the largest in the supplied 2024 ACS 5-year estimates, with 1,196,523 residents. Utah County has 705,400 and Davis County 370,924.
Which Utah county has the highest population density?
Salt Lake County has the highest county-average density at about 1,589.3 people per square mile. Davis County is about 1,142.2 and Weber County about 441.3 people per square mile.
Which Utah county grew fastest from 2010 to 2020?
Wasatch County grew about 47.8%, followed by Washington at 30.5%, Morgan at 29.8%, and Utah County at 27.7%. These percentages compare the 2010 and 2020 decennial censuses.
Related Maps
Sources
- U.S. Census Bureau — American Community Survey (ACS): 2024 5-year population and density estimates
- U.S. Census Bureau — TIGER/Line Shapefiles: 2024 state, county, census tract, and census place boundaries
- U.S. Census Bureau — Decennial Census: 2010 and 2020 county population comparison
Green Map creates custom-edited map images using open geographic data sources such as geoBoundaries, Natural Earth, OpenStreetMap, and government open data.
These maps are edited visual materials, not raw data files, and are provided for education, documents, presentations, and graphic reference.