Tennessee’s long east-west shape produces several distinct population systems rather than one statewide urban core. Memphis dominates the far west. Middle Tennessee contains Nashville and a broad ring of substantial suburban cities and counties. Knoxville and Chattanooga anchor two different parts of eastern Tennessee, while Johnson City and Kingsport form additional population centers in the northeast. The supplied 2024 ACS 5-year estimates place the state population at 7,066,383, and the county-density map reports about 41,224 square miles of land with an average near 171 people per square mile.
Those statewide figures only make sense when the map types are kept separate. The detailed map shows density at the census-tract level. The city and county-population maps use proportional circles to represent total residents, not people per square mile. County density divides population by land area. The change map compares the 2010 and 2020 decennial censuses, so its growth rates are not 2024 ACS changes. Tennessee is a good example of why these distinctions matter: Shelby leads county population, Davidson leads county density, and Trousdale led percentage growth during the 2010s.
Table of Contents
Middle Tennessee forms the broadest tract-level concentration, while Memphis stands out sharply in the west
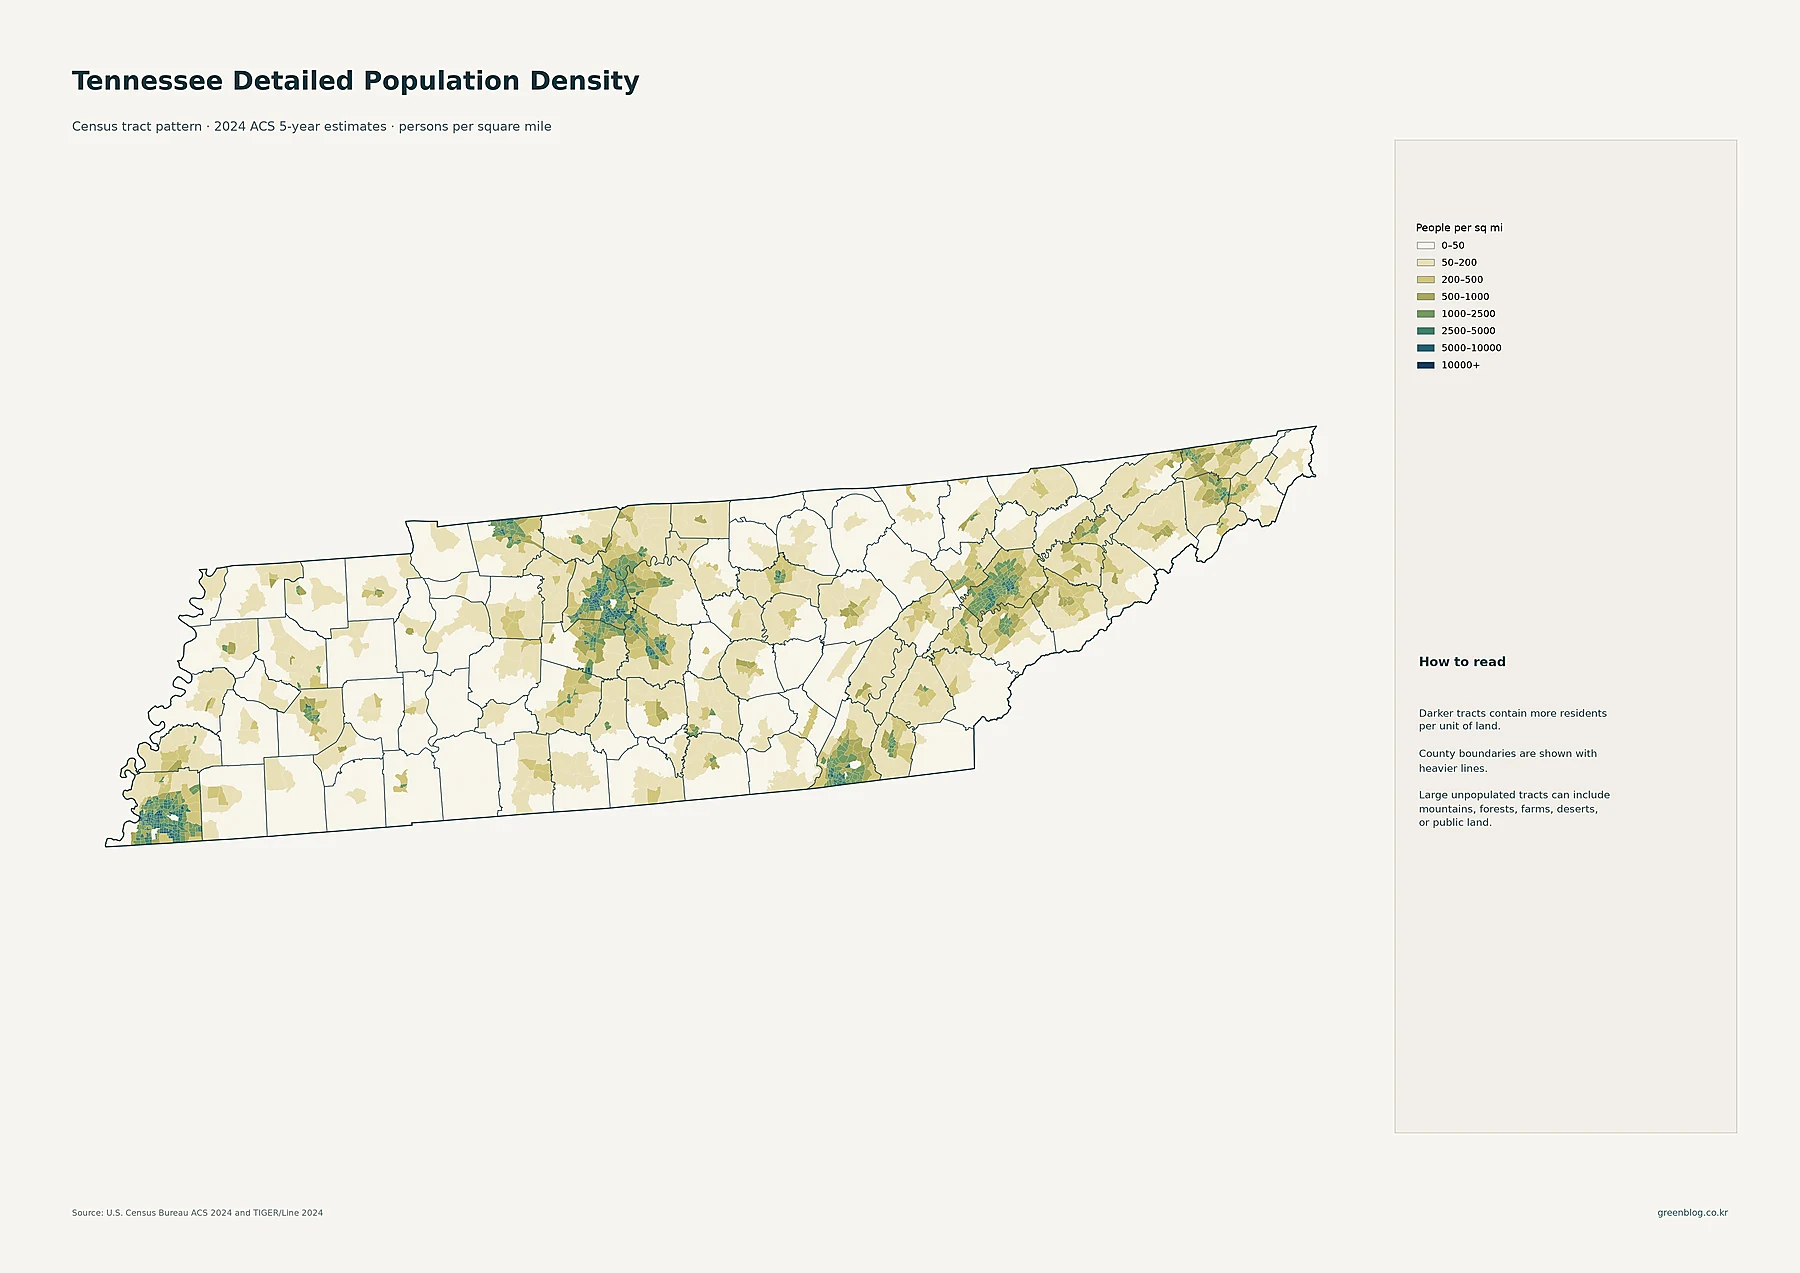
The most expansive concentration of darker tracts surrounds Nashville in Davidson County and extends into Williamson, Rutherford, Wilson, and Sumner counties. Franklin, Murfreesboro, Smyrna, Hendersonville, Gallatin, and Lebanon appear within or along this larger settlement belt. The pattern is important because it shows that Middle Tennessee’s concentration is not limited to the Nashville city boundary. High- and medium-density tracts continue across several county lines.
Memphis creates a different pattern in Shelby County. The city and nearby Bartlett and Collierville produce a dense cluster at the state’s western edge, but the surrounding western counties are much lighter. Memphis therefore stands out as a large, concentrated western anchor rather than one part of a broad multi-county density field like Nashville’s.
Eastern Tennessee contains several separate clusters. Knoxville dominates Knox County, Chattanooga stands out along the southeastern border, and the Johnson City–Kingsport area forms a northeastern concentration. Between these centers, the Cumberland Plateau and many rural counties contain broad tracts in the 0–50 or 50–200 people-per-square-mile classes. The tract layer makes the contrast between urban centers and sparsely settled terrain much clearer than a county average alone.
Nashville-Davidson and Memphis dominate place population, with a second tier spread across the state
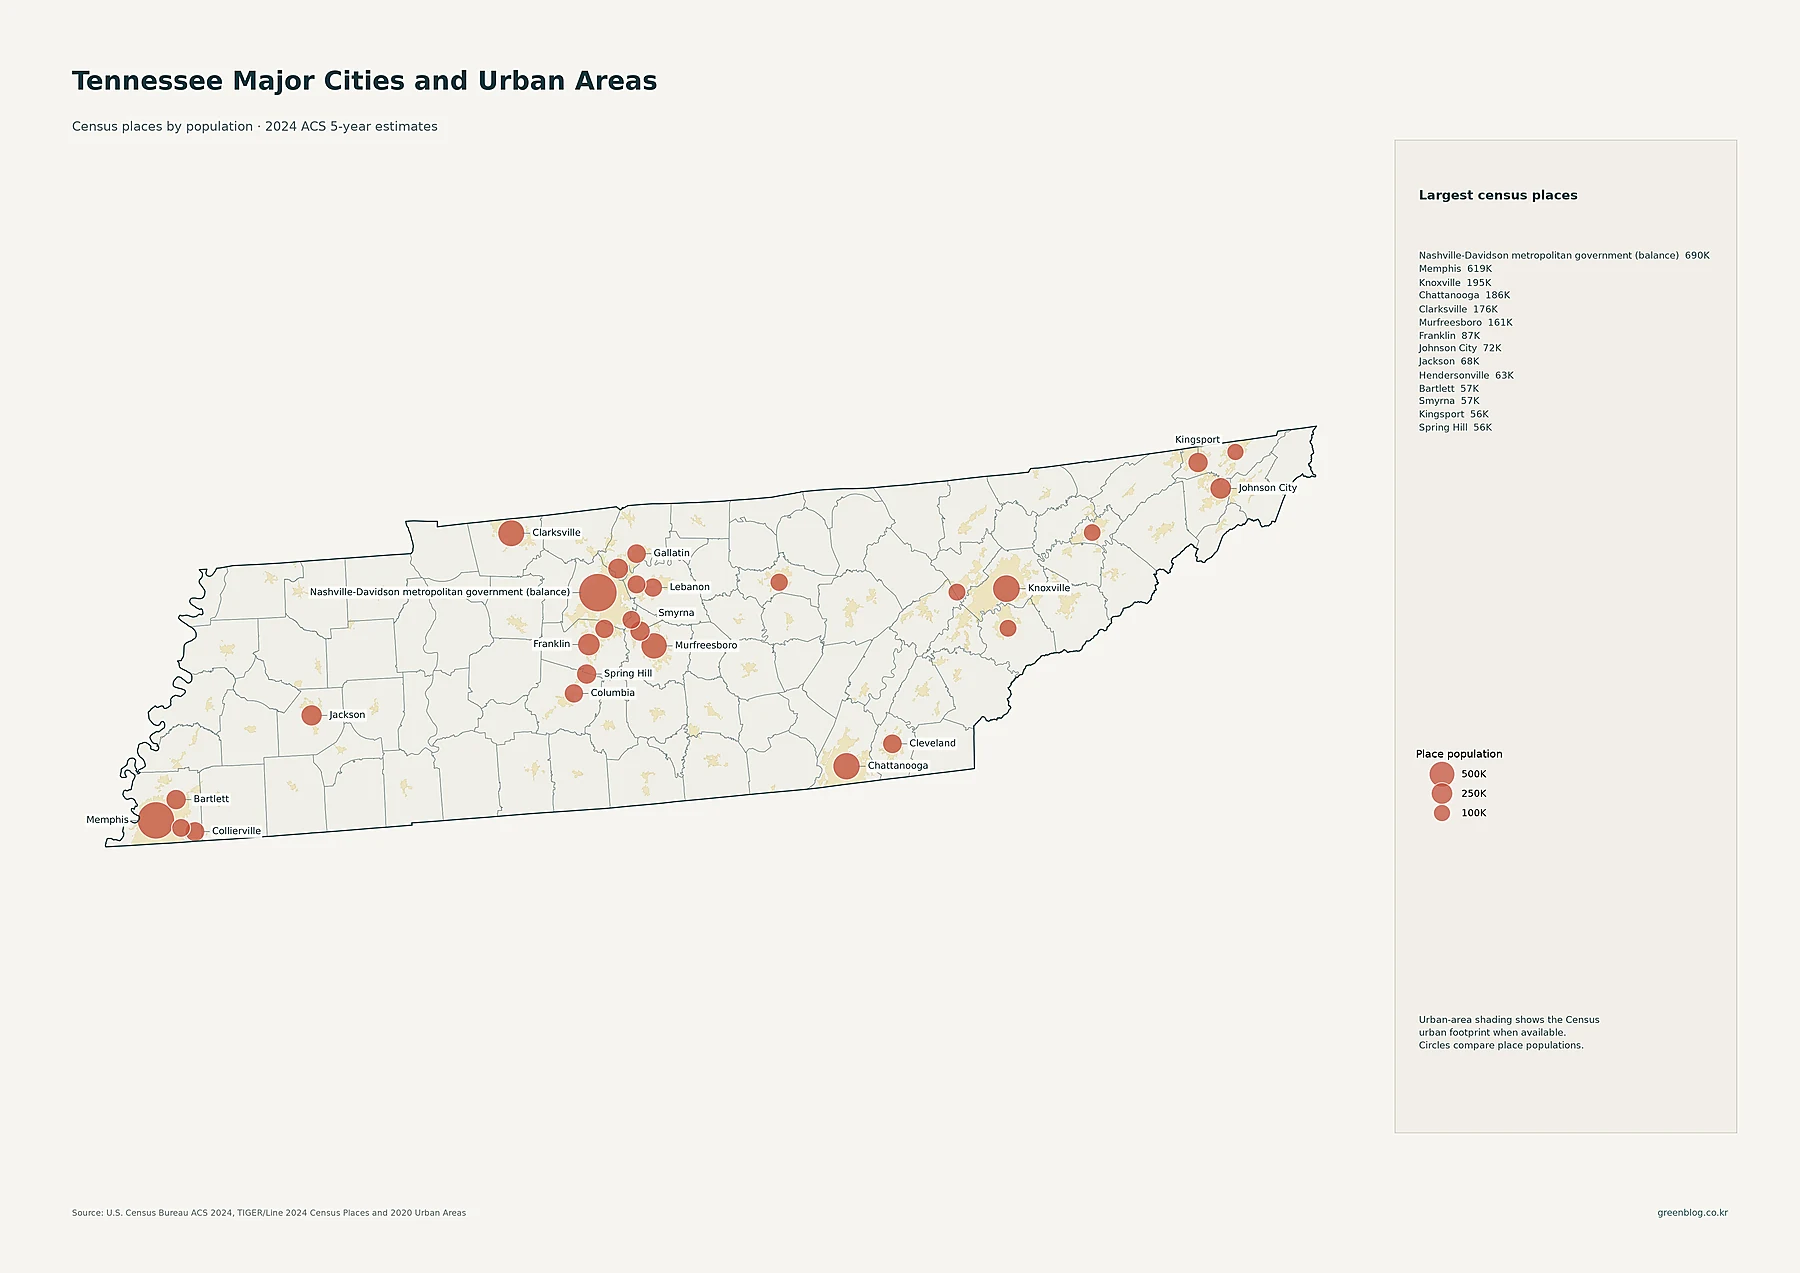
Nashville-Davidson metropolitan government (balance) has 690,130 residents in the supplied census-place data. Memphis is close behind at 618,980. Knoxville has 195,185 residents, Chattanooga 185,783, Clarksville 176,456, and Murfreesboro 161,445. Those six places form the largest circle tier on the map.
The next group shows how important Middle Tennessee’s surrounding cities have become in the current settlement pattern. Franklin has 87,133 residents, Hendersonville 63,091, Smyrna 56,692, Spring Hill 55,765, Gallatin 48,532, Brentwood 45,556, Columbia 45,441, and Lebanon 44,788. Elsewhere, Johnson City has 72,222, Jackson 68,435, Kingsport 56,262, Bartlett 56,876, Collierville 51,515, and Cleveland 48,829.
Circle size represents total place population. It does not show density. A large place can cover a broad area, while a smaller place can occupy a compact footprint. The tract map is the better layer for identifying where residents are packed most tightly, while this map is useful for comparing the population scale and spacing of Tennessee’s named urban centers.
Shelby County has the largest current population, but Davidson is denser
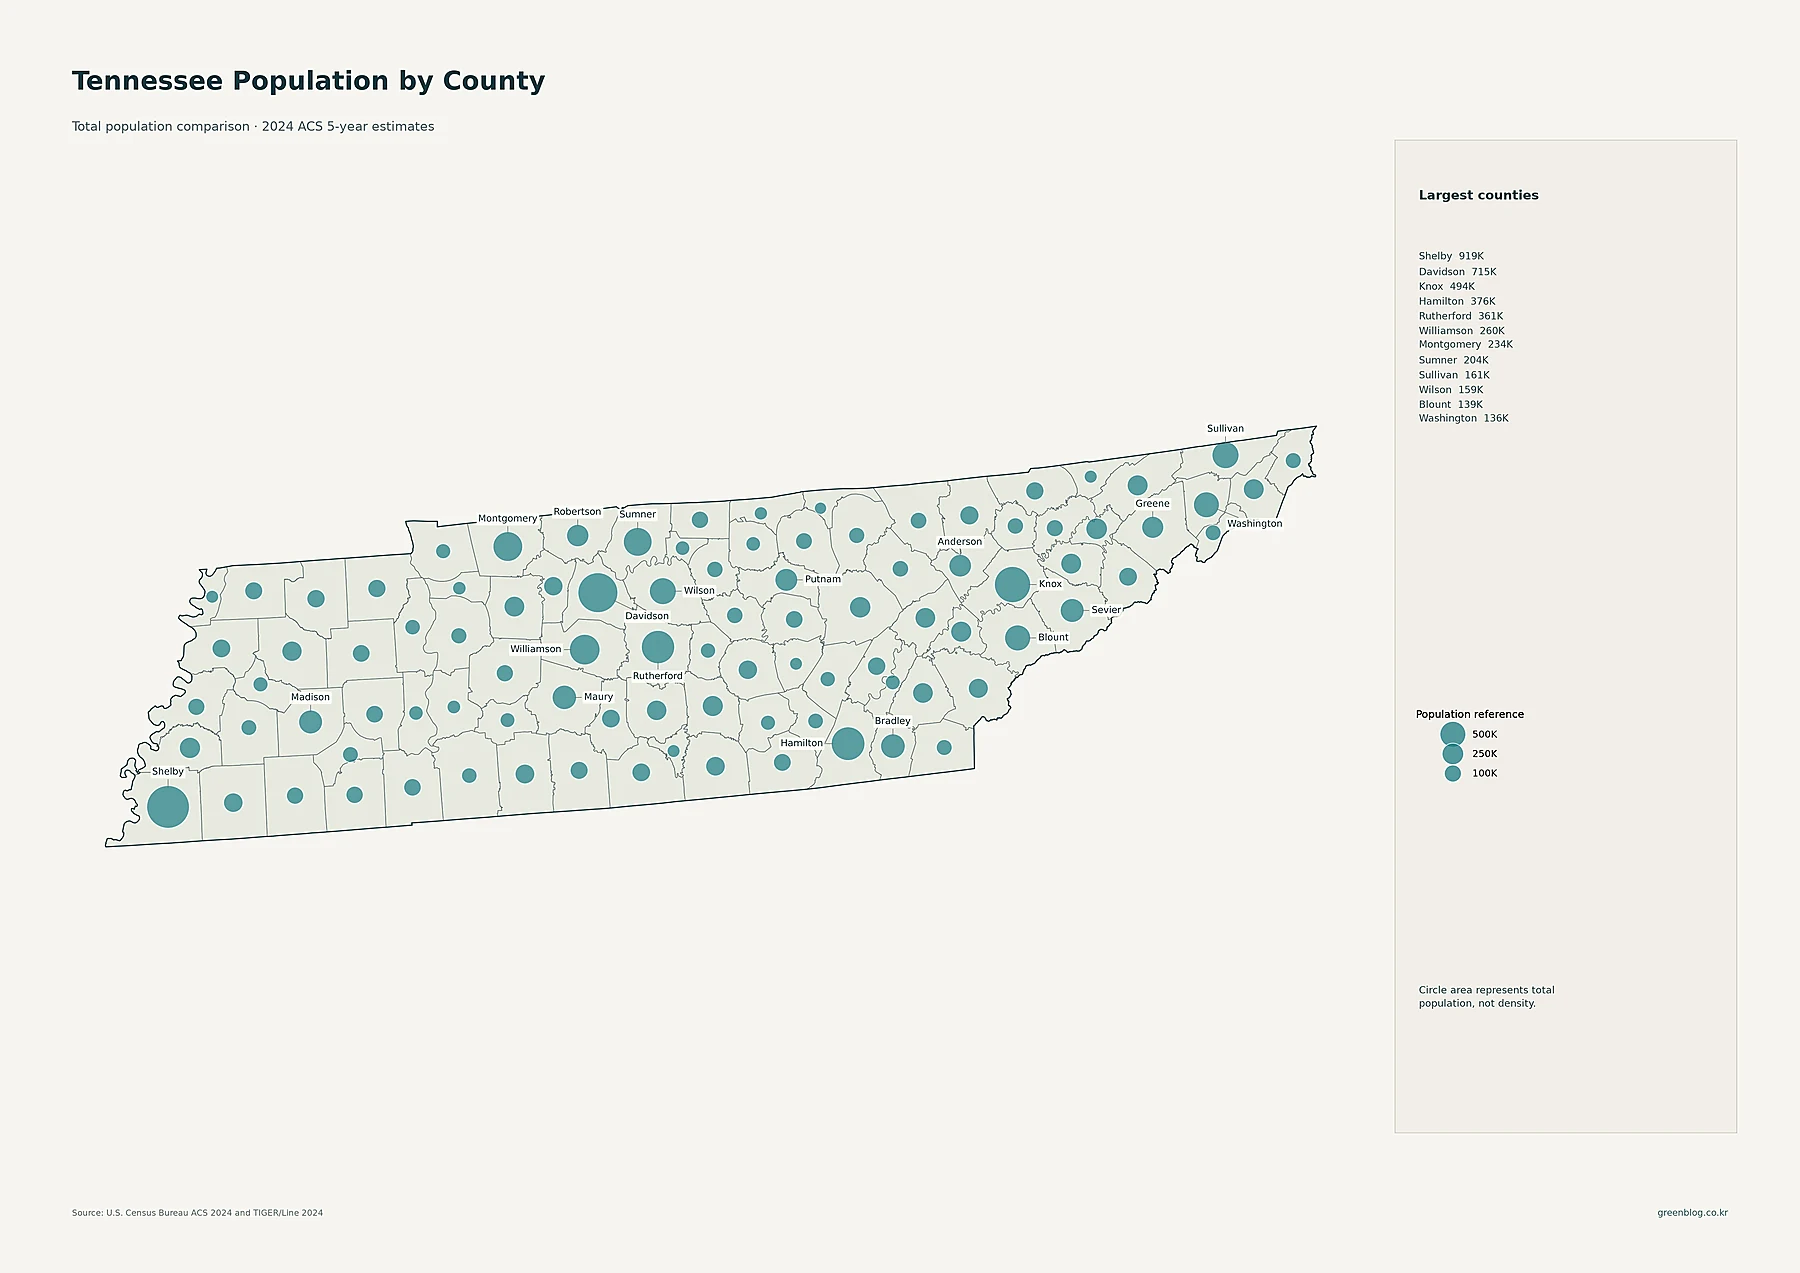
Shelby County has 919,173 residents, the largest county population in the supplied data. Davidson County follows with 715,388. Knox County has 494,148 residents, Hamilton 376,192, and Rutherford 360,646. Williamson has 260,351, Montgomery 234,153, and Sumner 204,424.
Eastern Tennessee contributes several sizable counties as well. Sullivan has 160,624 residents, Blount 139,333, Washington 136,261, and Bradley 111,065. In Middle Tennessee, Wilson has 158,805 and Maury 107,791. The proportional circles therefore show both the dominant metropolitan counties and the substantial suburban counties surrounding Nashville.
The ranking also demonstrates the difference between population and density. Shelby contains more residents than Davidson, but Davidson’s smaller land area and concentrated Nashville settlement give it a higher county-average density. The population map answers “how many,” while the density map answers “how tightly packed.”
Davidson County leads density, followed by Shelby, Knox, and Hamilton
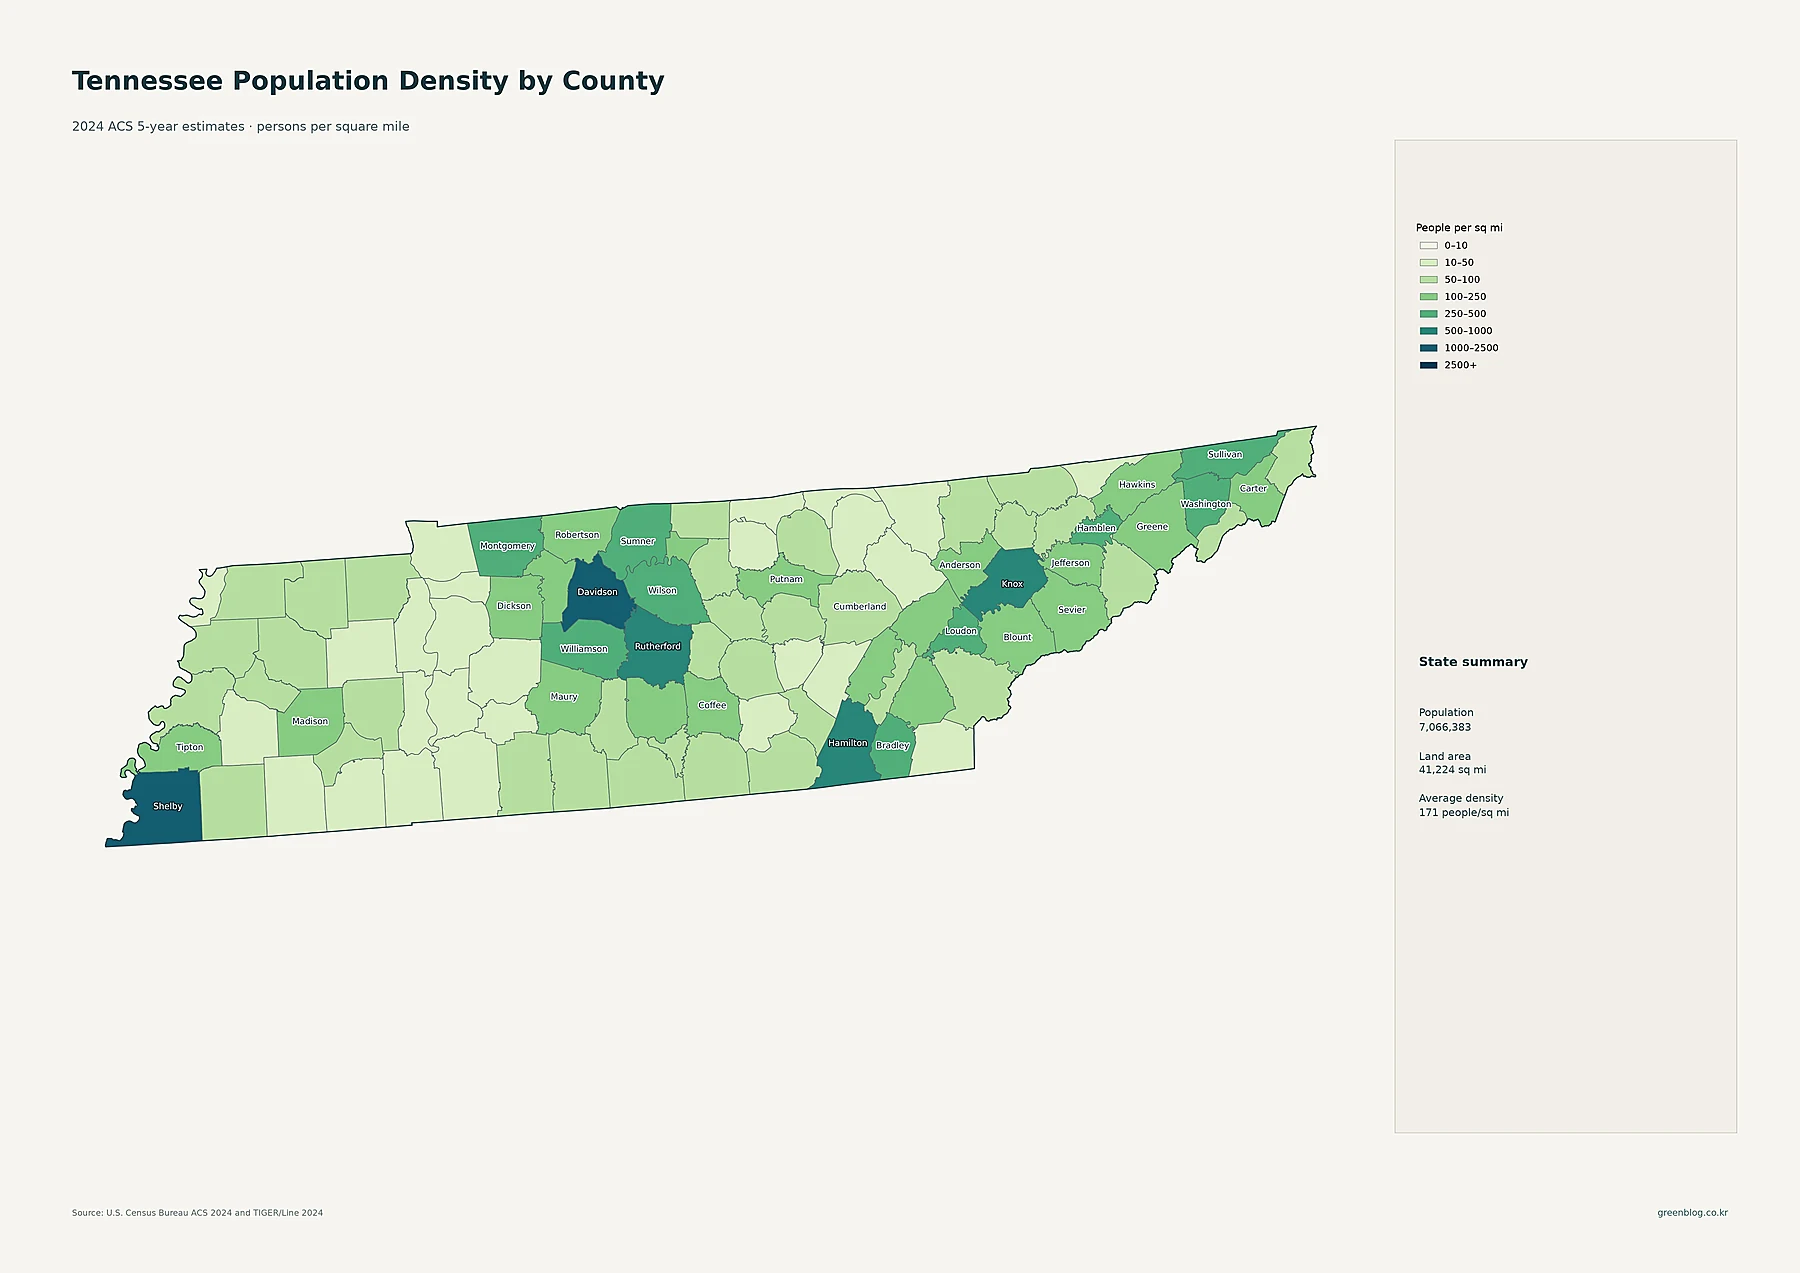
Davidson County has the highest average density at about 1,420.9 people per square mile. Shelby County averages about 1,221.1, Knox 972.1, and Hamilton 693.9. Rutherford is about 582.4. These are the counties containing Nashville, Memphis, Knoxville, Chattanooga, and Murfreesboro, so the highest density classes align closely with the state’s largest urban centers.
Williamson County averages about 446.6 people per square mile, Montgomery 434.3, Washington 417.3, Hamblen 407.4, Sullivan 388.4, and Sumner 386.1. Many rural counties, by contrast, remain in much lower density classes. The statewide average of 171 therefore compresses a broad range from dense metro counties to sparsely settled rural ones.
| Measure | Leading area | Value in supplied data |
|---|---|---|
| State population | Tennessee | 7,066,383 |
| Largest county population | Shelby County | 919,173 |
| Highest county density | Davidson County | about 1,420.9/sq mi |
| Fastest 2010–2020 growth | Trousdale County | +47.6% |
| Largest 2010–2020 decline | Lake County | -10.6% |
The strongest 2010–2020 growth formed a Middle Tennessee belt around Nashville
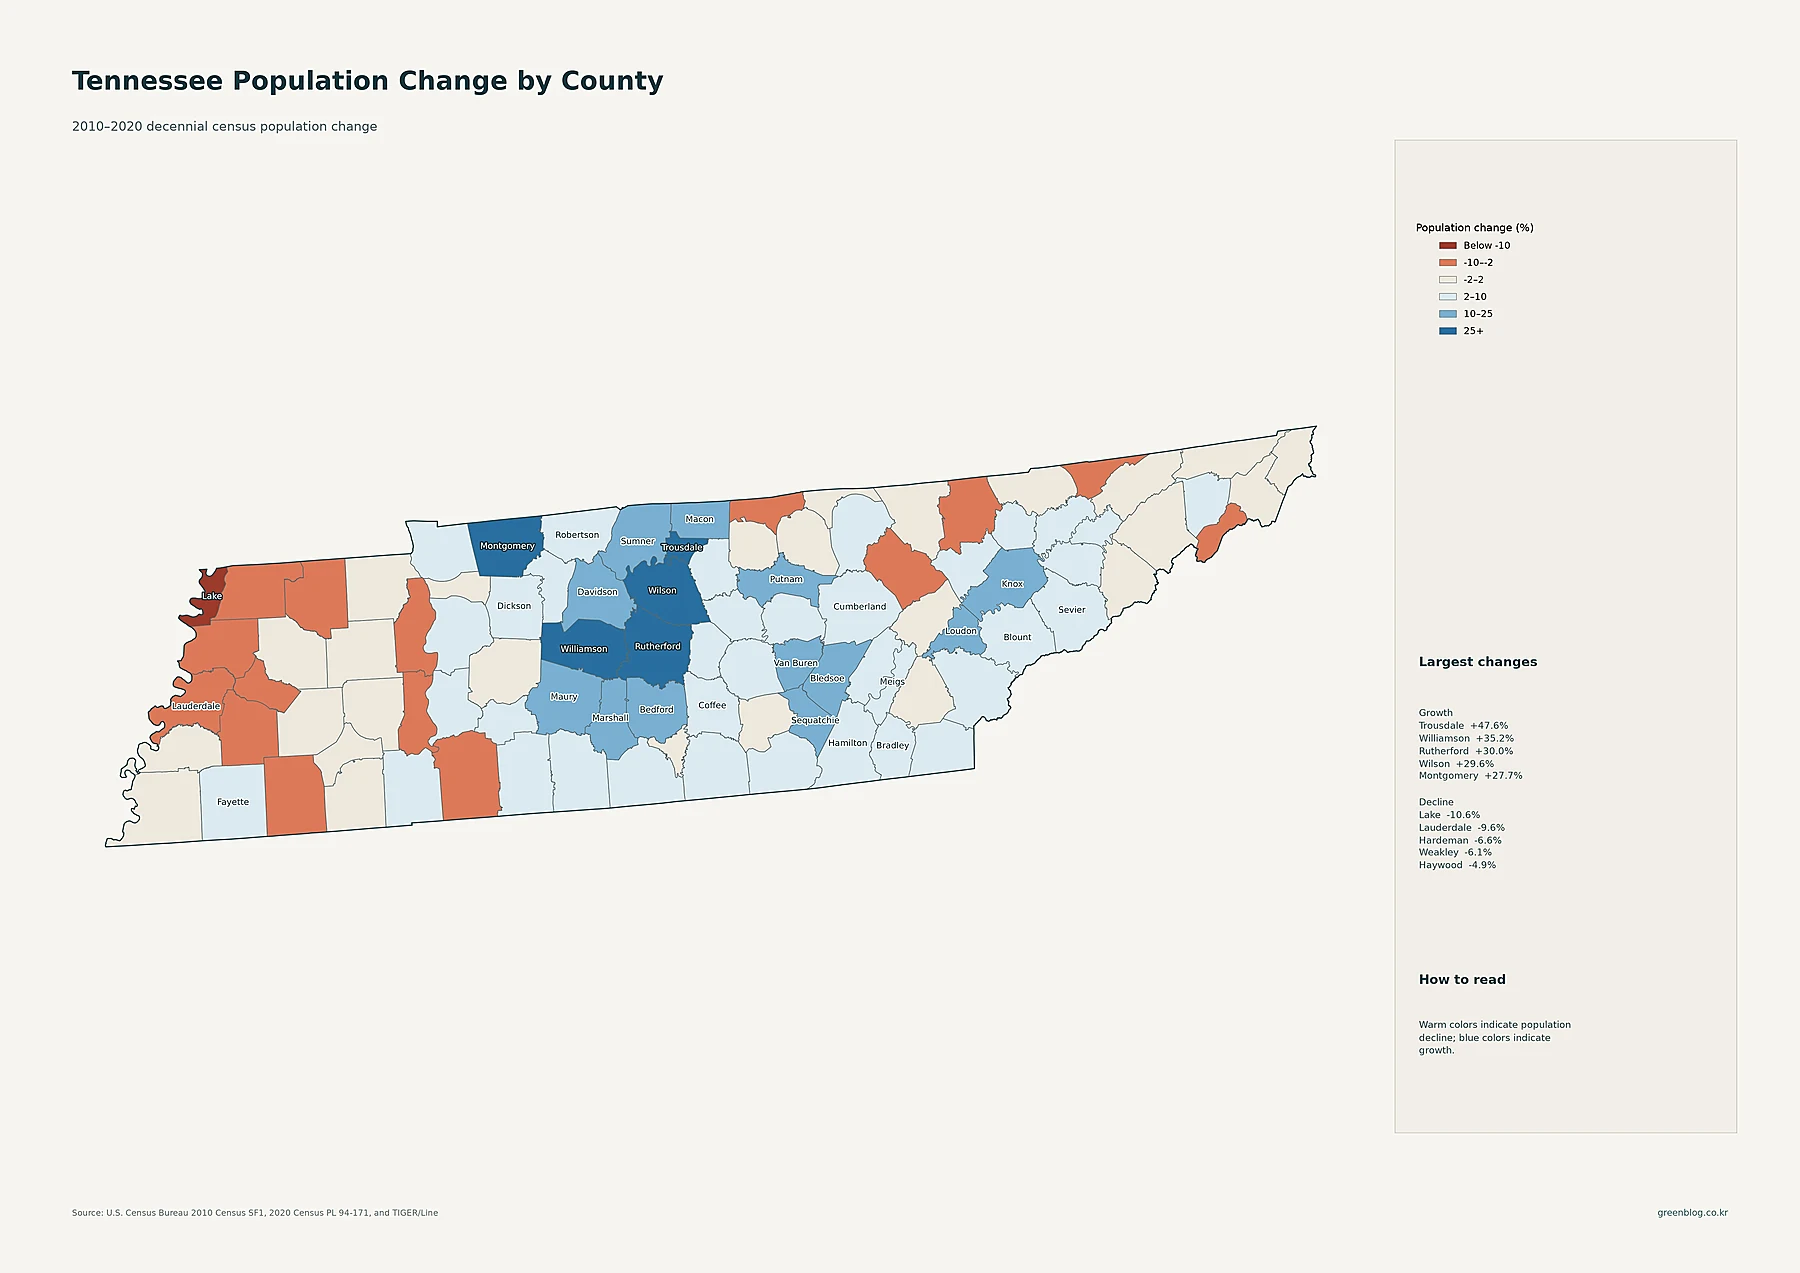
Trousdale County recorded the fastest percentage increase in the supplied decade data. Its population rose from 7,870 in 2010 to 11,615 in 2020, an increase of about 47.6%. Williamson County grew 35.2%, Rutherford 30.0%, Wilson 29.6%, and Montgomery 27.7%. Maury increased 24.7% and Sumner 22.2%.
The geography is striking because many of the strongest growth counties sit in or around Middle Tennessee. Davidson itself grew about 14.2%, but several counties surrounding the Nashville core grew much faster in percentage terms. Williamson, Rutherford, Wilson, Sumner, and Maury form a broad growth ring, while Montgomery adds another strong gain to the northwest. The current population core and the fastest-growing counties are therefore connected but not identical.
Several western counties declined during the same decade. Lake County fell from 7,832 residents in 2010 to 7,005 in 2020, a decrease of about 10.6%. Lauderdale declined 9.6%, Hardeman 6.6%, Weakley 6.1%, and Haywood 4.9%. The warm colors are especially noticeable in the western and northwestern parts of the state. These are 2010–2020 decennial-census changes and should not be presented as changes in the 2024 ACS estimate.
Tennessee combines a large western city, a rapidly expanding middle, and multiple eastern hubs
Tennessee’s five maps reveal three related but distinct population stories. Memphis and Shelby County remain the strongest western population anchor. Middle Tennessee combines high current density in Davidson County with a broad band of fast-growing suburban and exurban counties. Eastern Tennessee contains several separate urban centers, including Knoxville, Chattanooga, Johnson City, and Kingsport, rather than one continuous high-density region.
The rankings change depending on the question. Shelby has the largest county population. Davidson has the highest county-average density. Trousdale had the fastest 2010–2020 percentage growth, with Williamson, Rutherford, Wilson, Montgomery, Maury, and Sumner also expanding rapidly. Keeping place totals, county totals, county density, tract density, and historical change separate gives the clearest view of where Tennesseans live and how the state’s settlement pattern shifted during the decade.
Download the Tennessee population map collection
The ZIP includes detailed census-tract density, major cities and urban areas, county population totals, 2010–2020 county population change, and county population density.
FAQ
Which Tennessee county has the largest population?
Shelby County is the largest in the supplied 2024 ACS 5-year estimates, with 919,173 residents. Davidson County has 715,388 and Knox County 494,148.
Which Tennessee county has the highest population density?
Davidson County has the highest county-average density at about 1,420.9 people per square mile. Shelby is about 1,221.1 and Knox about 972.1 people per square mile.
Which Tennessee county grew fastest from 2010 to 2020?
Trousdale County grew about 47.6%, followed by Williamson at 35.2%, Rutherford at 30.0%, and Wilson at 29.6%. These percentages compare the 2010 and 2020 decennial censuses.
Related Maps
Sources
- U.S. Census Bureau — American Community Survey (ACS): 2024 5-year population and density estimates
- U.S. Census Bureau — TIGER/Line Shapefiles: 2024 state, county, census tract, and census place boundaries
- U.S. Census Bureau — Decennial Census: 2010 and 2020 county population comparison
Green Map creates custom-edited map images using open geographic data sources such as geoBoundaries, Natural Earth, OpenStreetMap, and government open data.
These maps are edited visual materials, not raw data files, and are provided for education, documents, presentations, and graphic reference.