South Carolina’s population is organized around several distinct centers rather than one dominant metro. The Upstate contains a broad Greenville–Spartanburg concentration. Columbia and Lexington form a central cluster, while Charleston, North Charleston, Mount Pleasant, Summerville, and Goose Creek anchor a large southeastern concentration. Horry County and the Myrtle Beach–Conway area stand out along the northeastern coast, and Rock Hill–Fort Mill creates another important cluster near the northern boundary.
The supplied 2024 ACS 5-year estimates put South Carolina’s population at 5,296,225. The county-density map reports about 30,064 square miles of land and a statewide average near 176 people per square mile. That average hides a wide internal range. Greenville County averages almost 700 people per square mile, while Allendale is below 20. The largest county population, the largest city, and the fastest 2010–2020 growth also belong to different places, which makes it important to keep each map’s measure separate.
Table of Contents
The tract map reveals three major clusters in the Upstate, central Midlands, and Charleston region
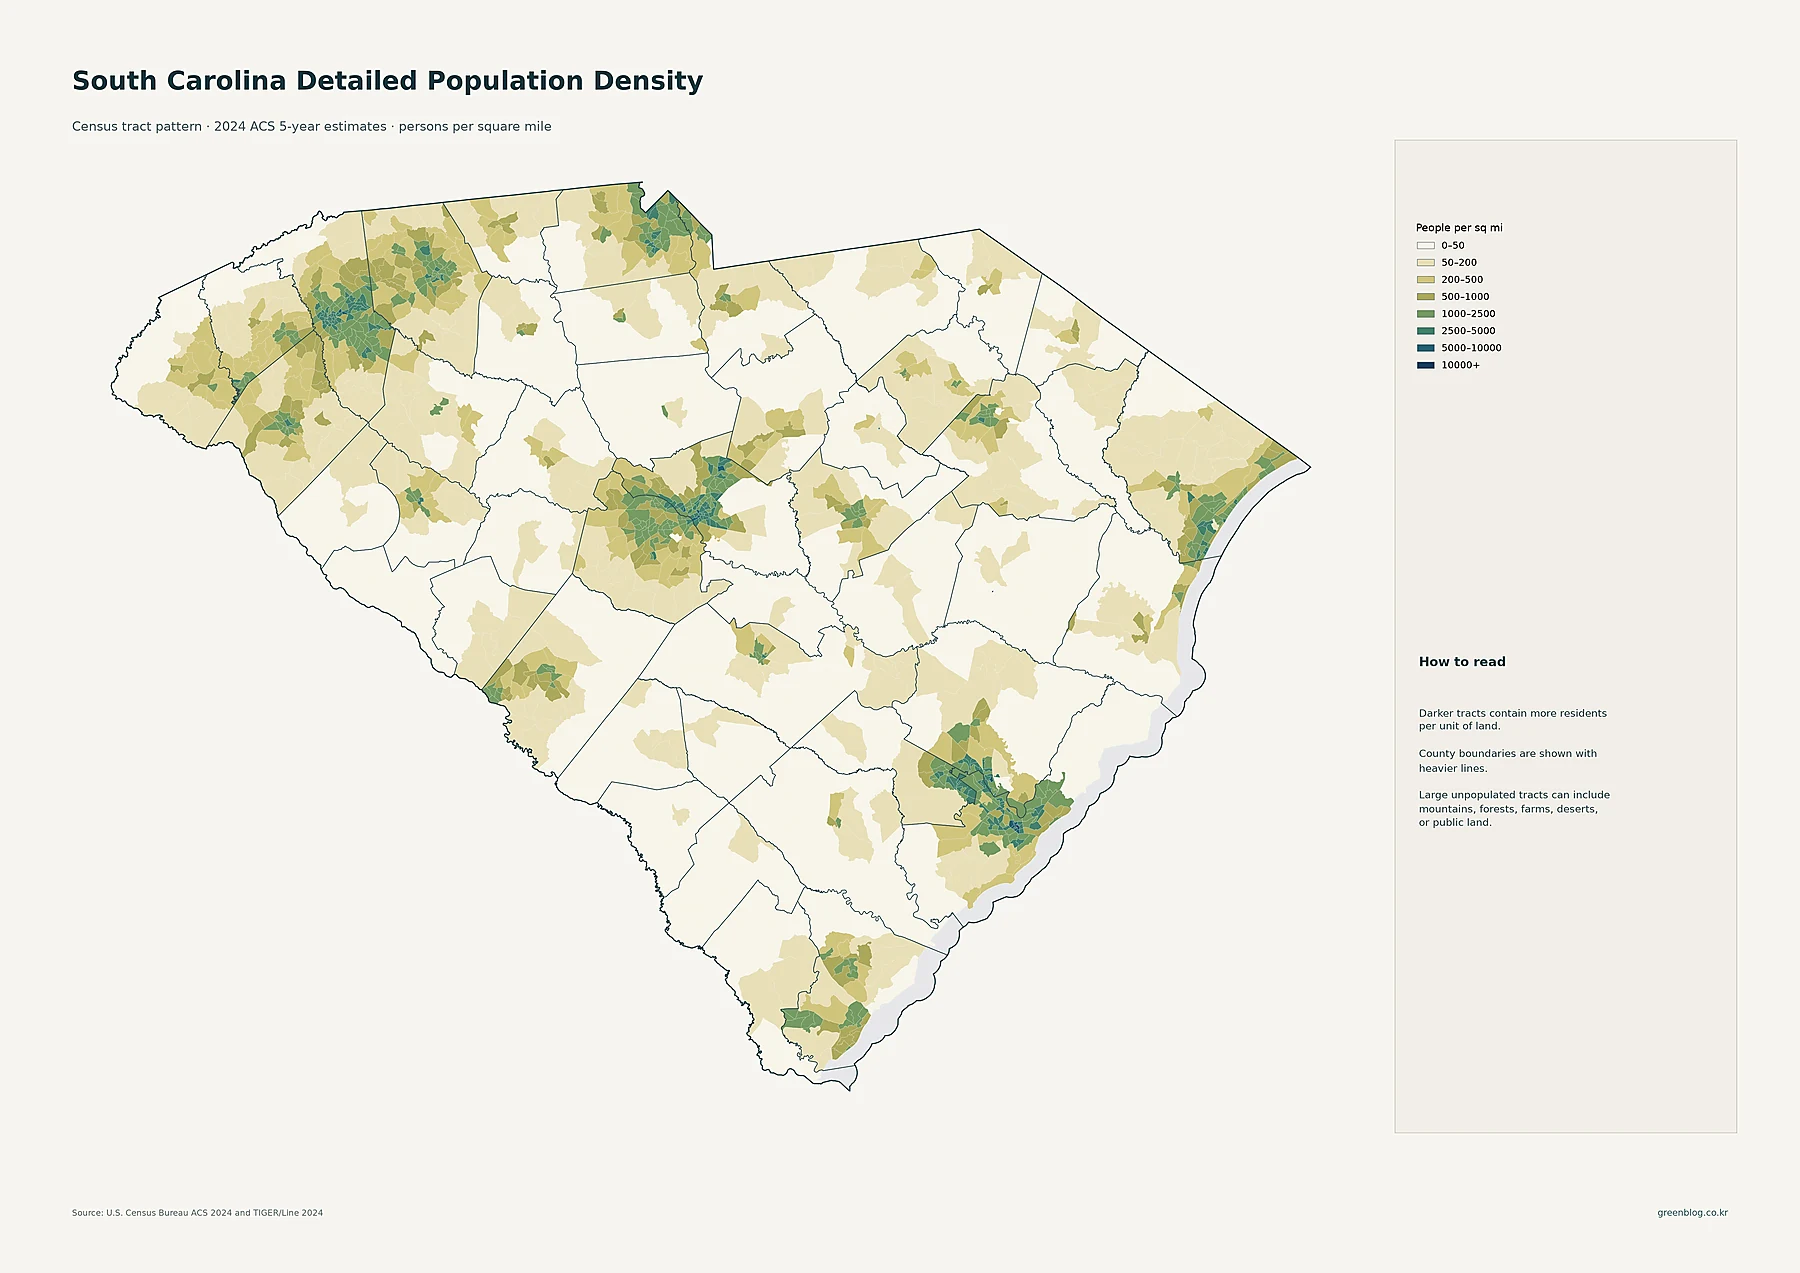
The Upstate contains one of the broadest collections of medium- and high-density tracts. Greenville is surrounded by darker settlement extending toward Greer, Mauldin, and Spartanburg, while Anderson forms a separate concentration farther southwest. The pattern is larger than any one municipal boundary and shows how several nearby places combine into a substantial northwestern population region.
Central South Carolina has another major concentration around Columbia. Darker tracts cover portions of Richland County and continue west into Lexington County. Rock Hill and Fort Mill create a separate northern cluster. On the southeast coast, Charleston, North Charleston, Mount Pleasant, Summerville, and Goose Creek form a broad pattern of higher-density tracts extending across Charleston, Berkeley, and Dorchester counties.
Other clusters appear around Myrtle Beach and Conway in Horry County, Florence in the northeast interior, Sumter farther inland, Aiken near the western border, and Hilton Head Island and Bluffton in the Lowcountry. Much of the central-southern interior remains in the 0–50 or 50–200 people-per-square-mile classes. The tract map is therefore useful for distinguishing compact settlement from the larger county areas surrounding it.
Charleston has the largest census-place population, followed by Columbia and North Charleston
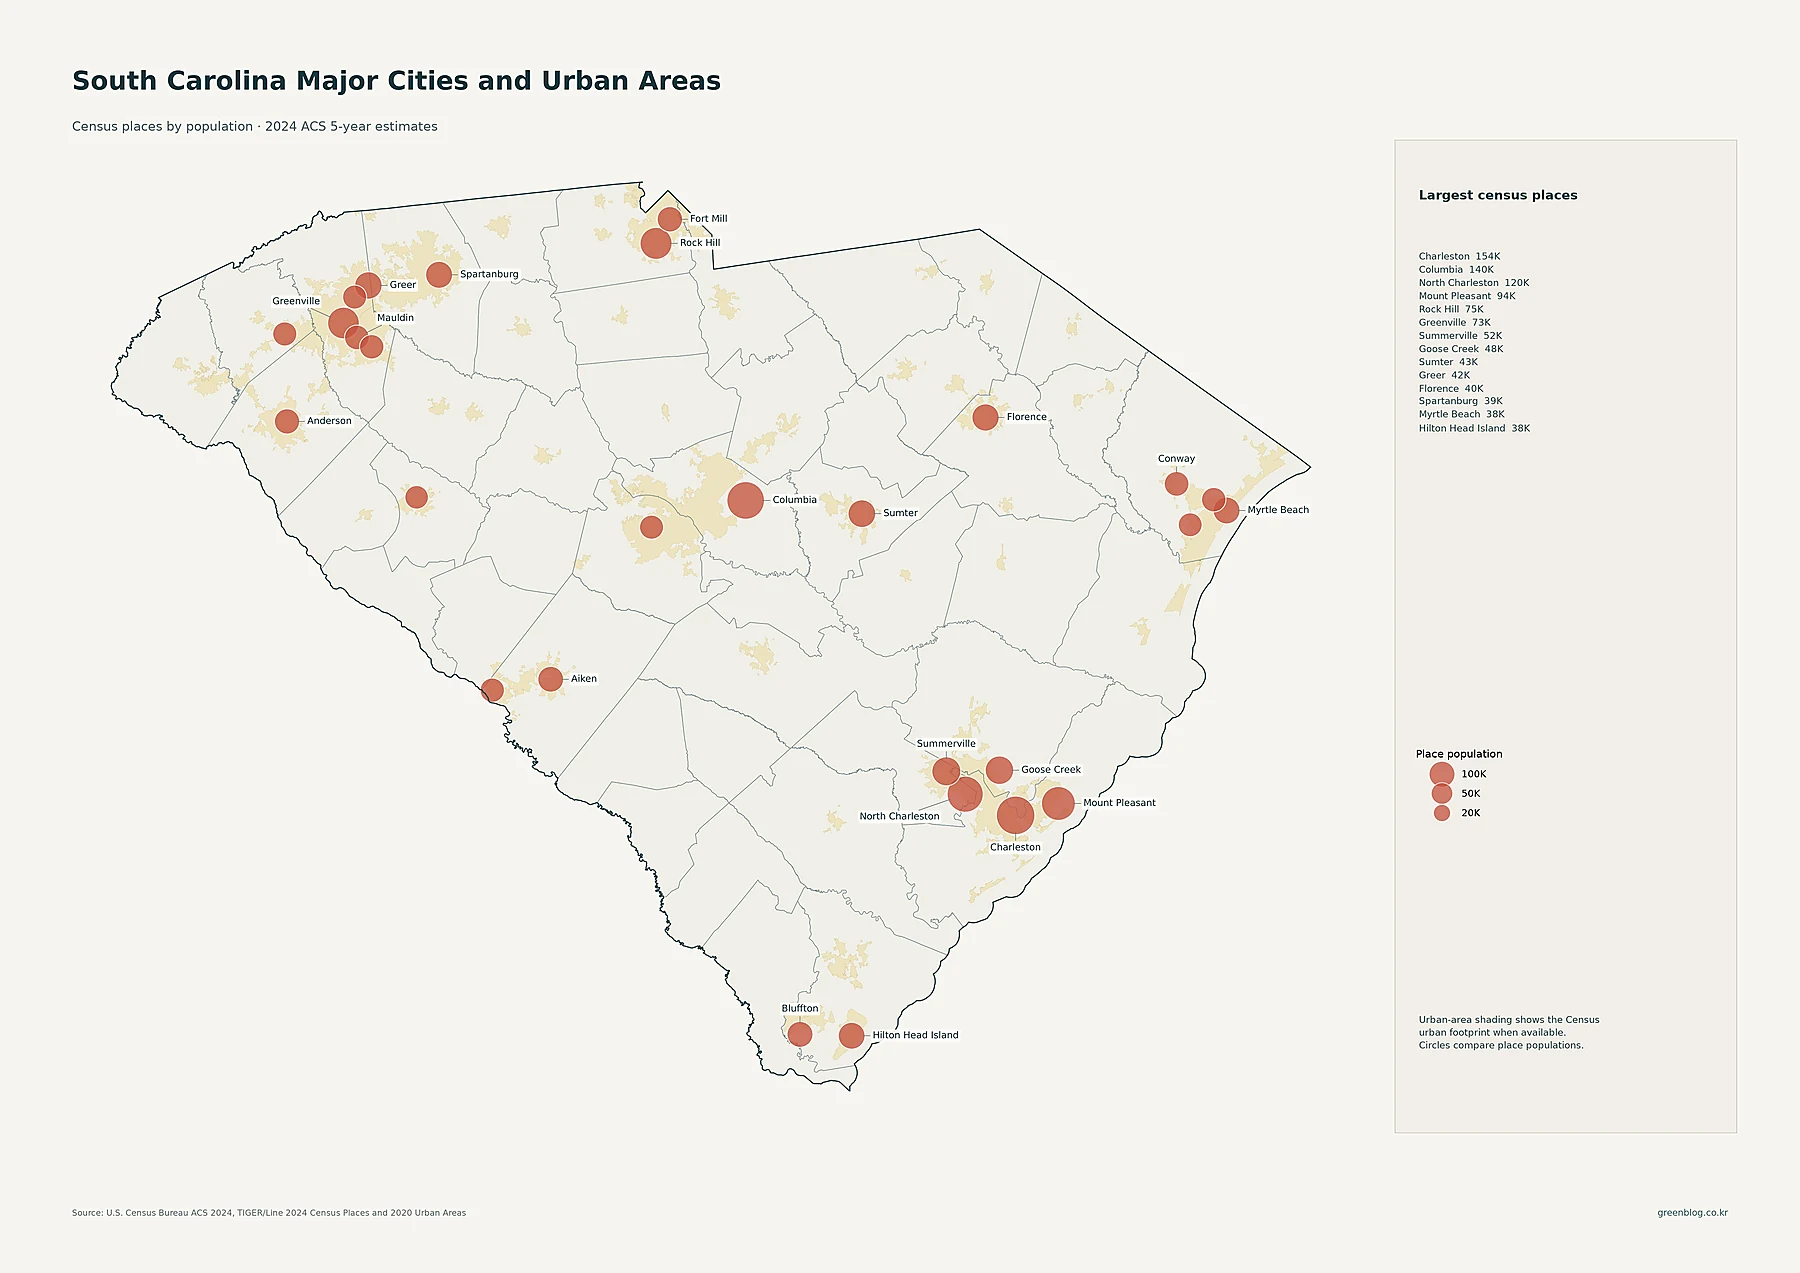
Charleston has 154,338 residents in the supplied census-place data, making it the largest place shown. Columbia follows with 139,643 and North Charleston with 119,913. Mount Pleasant has 93,993 residents, Rock Hill 75,259, and Greenville 72,935. Summerville has 51,654, Goose Creek 48,078, Sumter 43,053, Greer 41,536, Florence 40,408, Spartanburg 38,910, Myrtle Beach 38,371, and Hilton Head Island 37,911.
The proportional circles represent total place population, not density. Charleston’s circle is the largest because the city has the largest census-place population in the data. That does not mean Charleston County leads every county measure. Greenville County has a larger total county population and a higher county-average density. City boundaries and county boundaries answer different geographic questions.
Greenville County has the largest county population, with Richland and Charleston nearly tied behind it
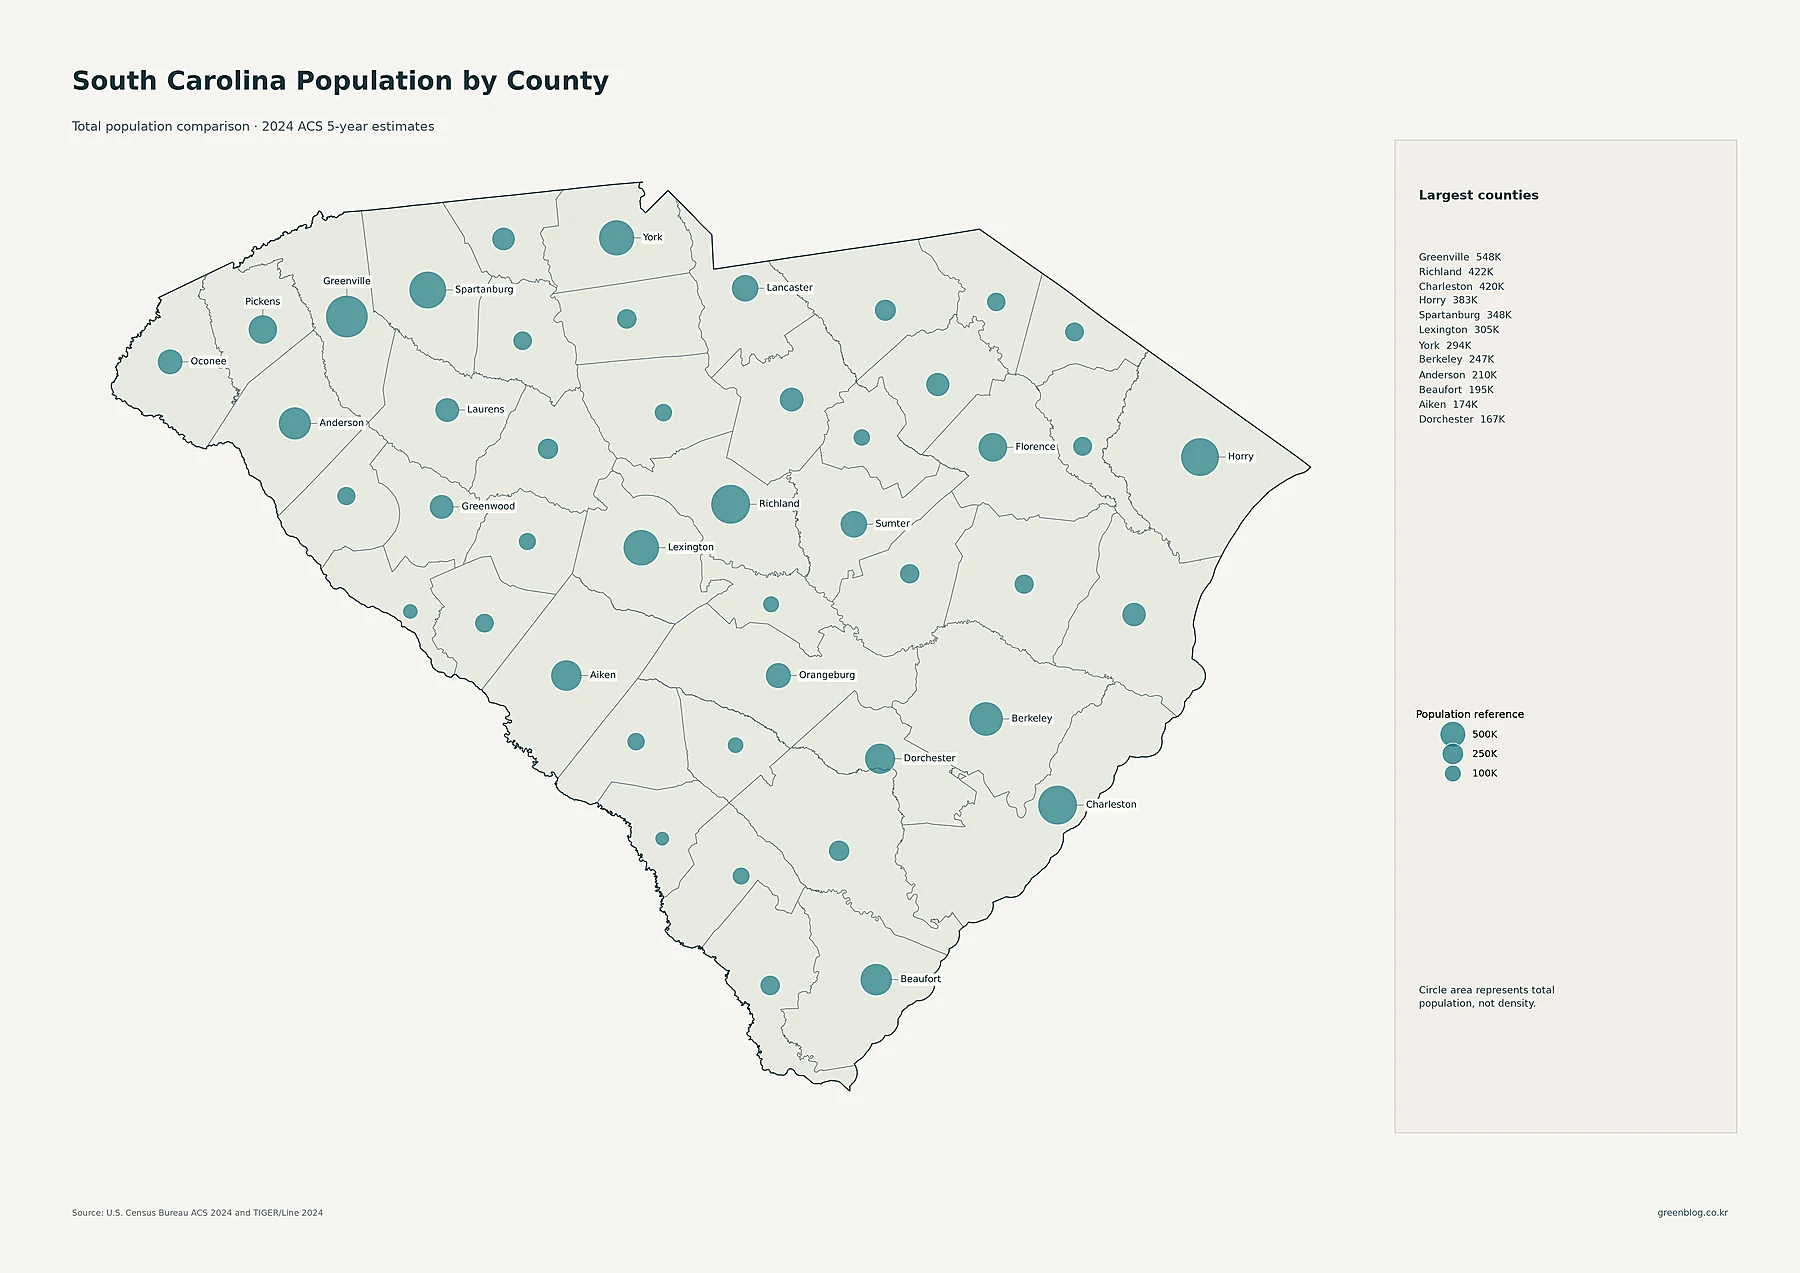
Greenville County has 548,166 residents, the largest county total in the supplied data. Richland County has 422,117 and Charleston County 420,264, making those two nearly equal in current population. Horry County has 383,016 residents, Spartanburg 347,852, Lexington 304,887, York 293,673, and Berkeley 246,802. Anderson has 210,478 and Beaufort 195,289.
The largest circles are distributed across several parts of the state. Greenville and Spartanburg dominate the Upstate; Richland and Lexington stand out around Columbia; York is prominent in the north; and Charleston, Berkeley, Horry, and Beaufort create a strong coastal and Lowcountry presence. At the other end, Allendale has only 7,661 residents, while Bamberg has 13,042 and Lee 16,166.
County total population does not measure density. A county can have many residents because it covers a large area or because it is densely settled, and those situations are not equivalent. The next map accounts for land area and changes the emphasis from total people to how tightly those people occupy each county.
Greenville also leads county density, while several central-southern counties remain very sparse
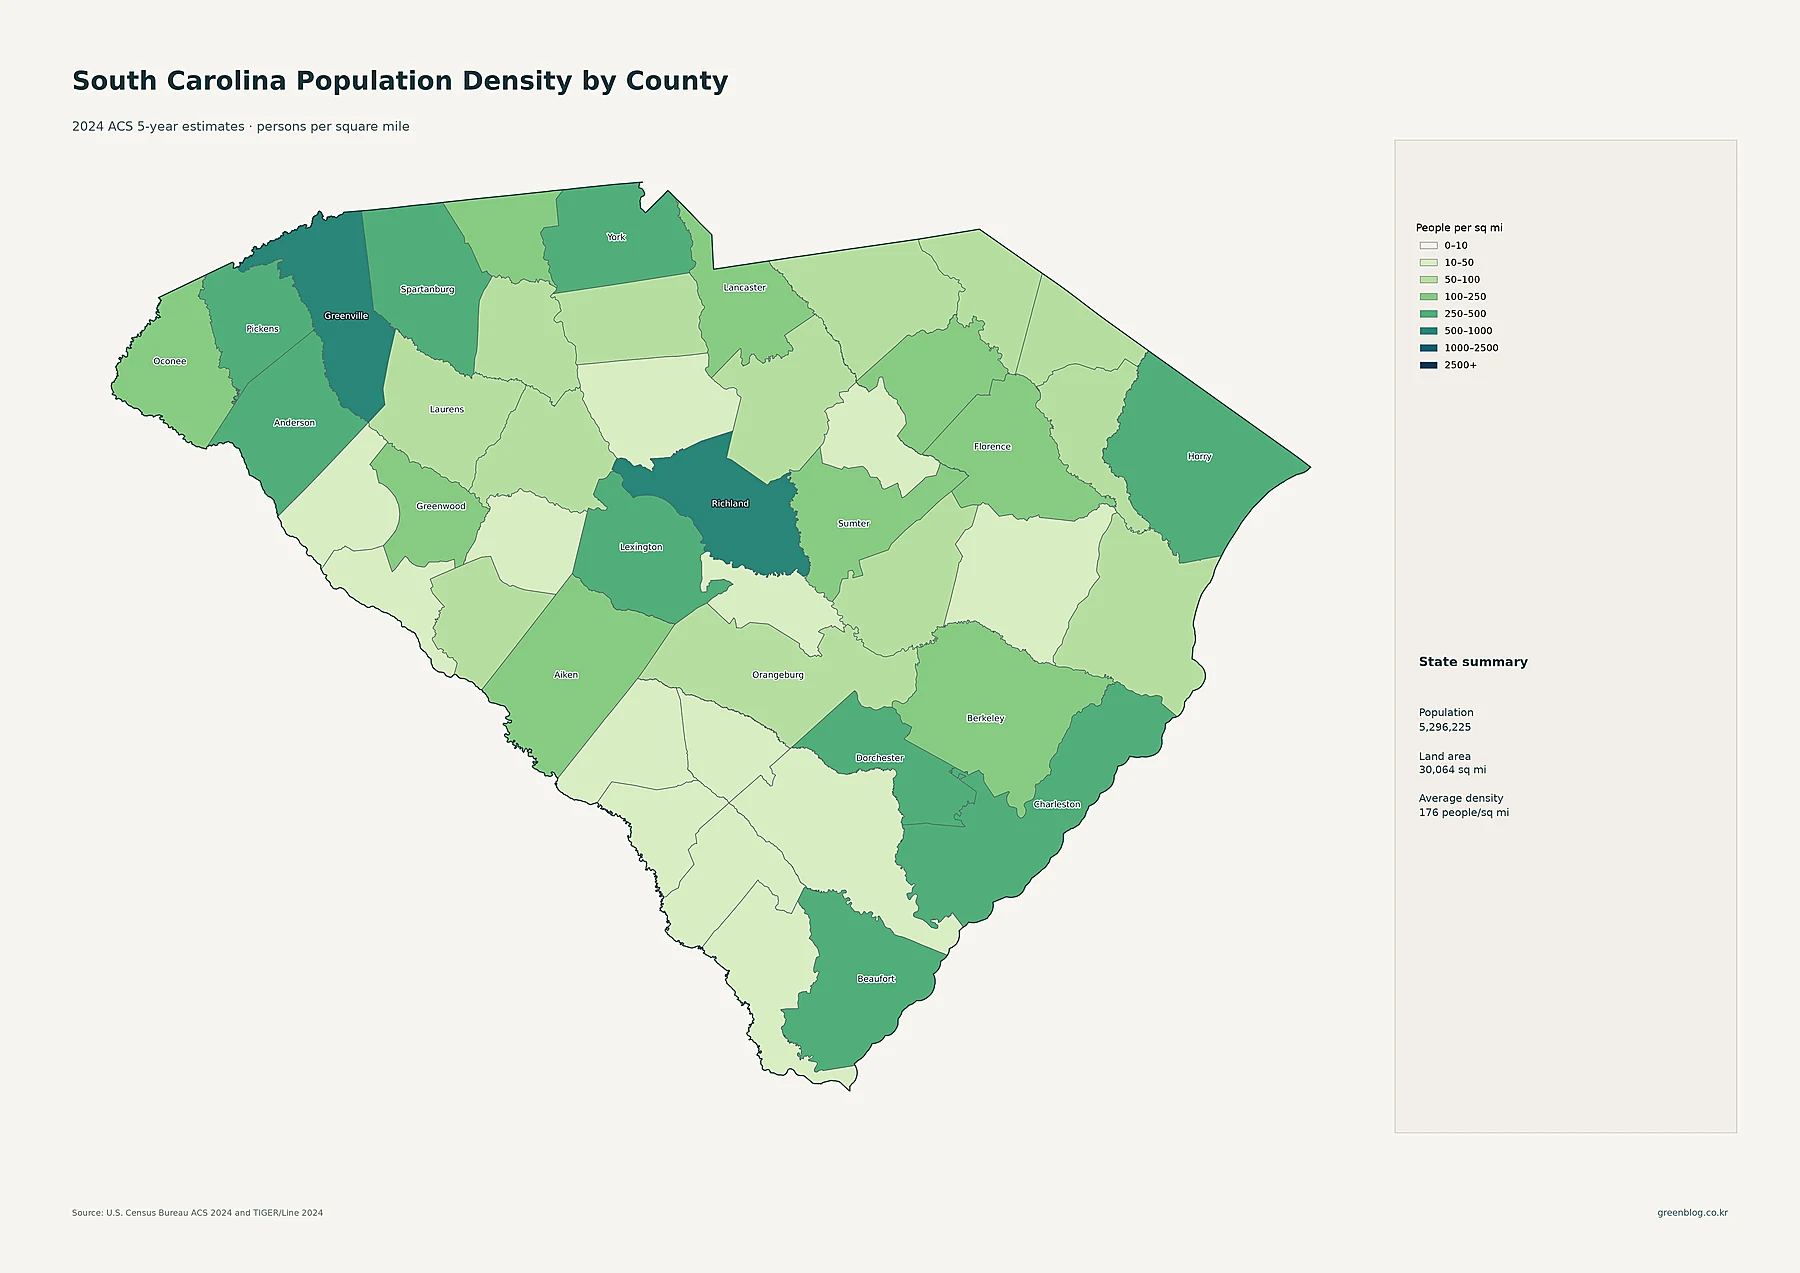
Greenville County has the highest average density at about 697.5 people per square mile. Richland is second at about 557.4, followed by Charleston at 457.7. Lexington averages about 436.4, York 431.5, and Spartanburg 430.3. Beaufort is about 339.0, Horry 338.0, Anderson 294.8, and Dorchester 294.2 people per square mile.
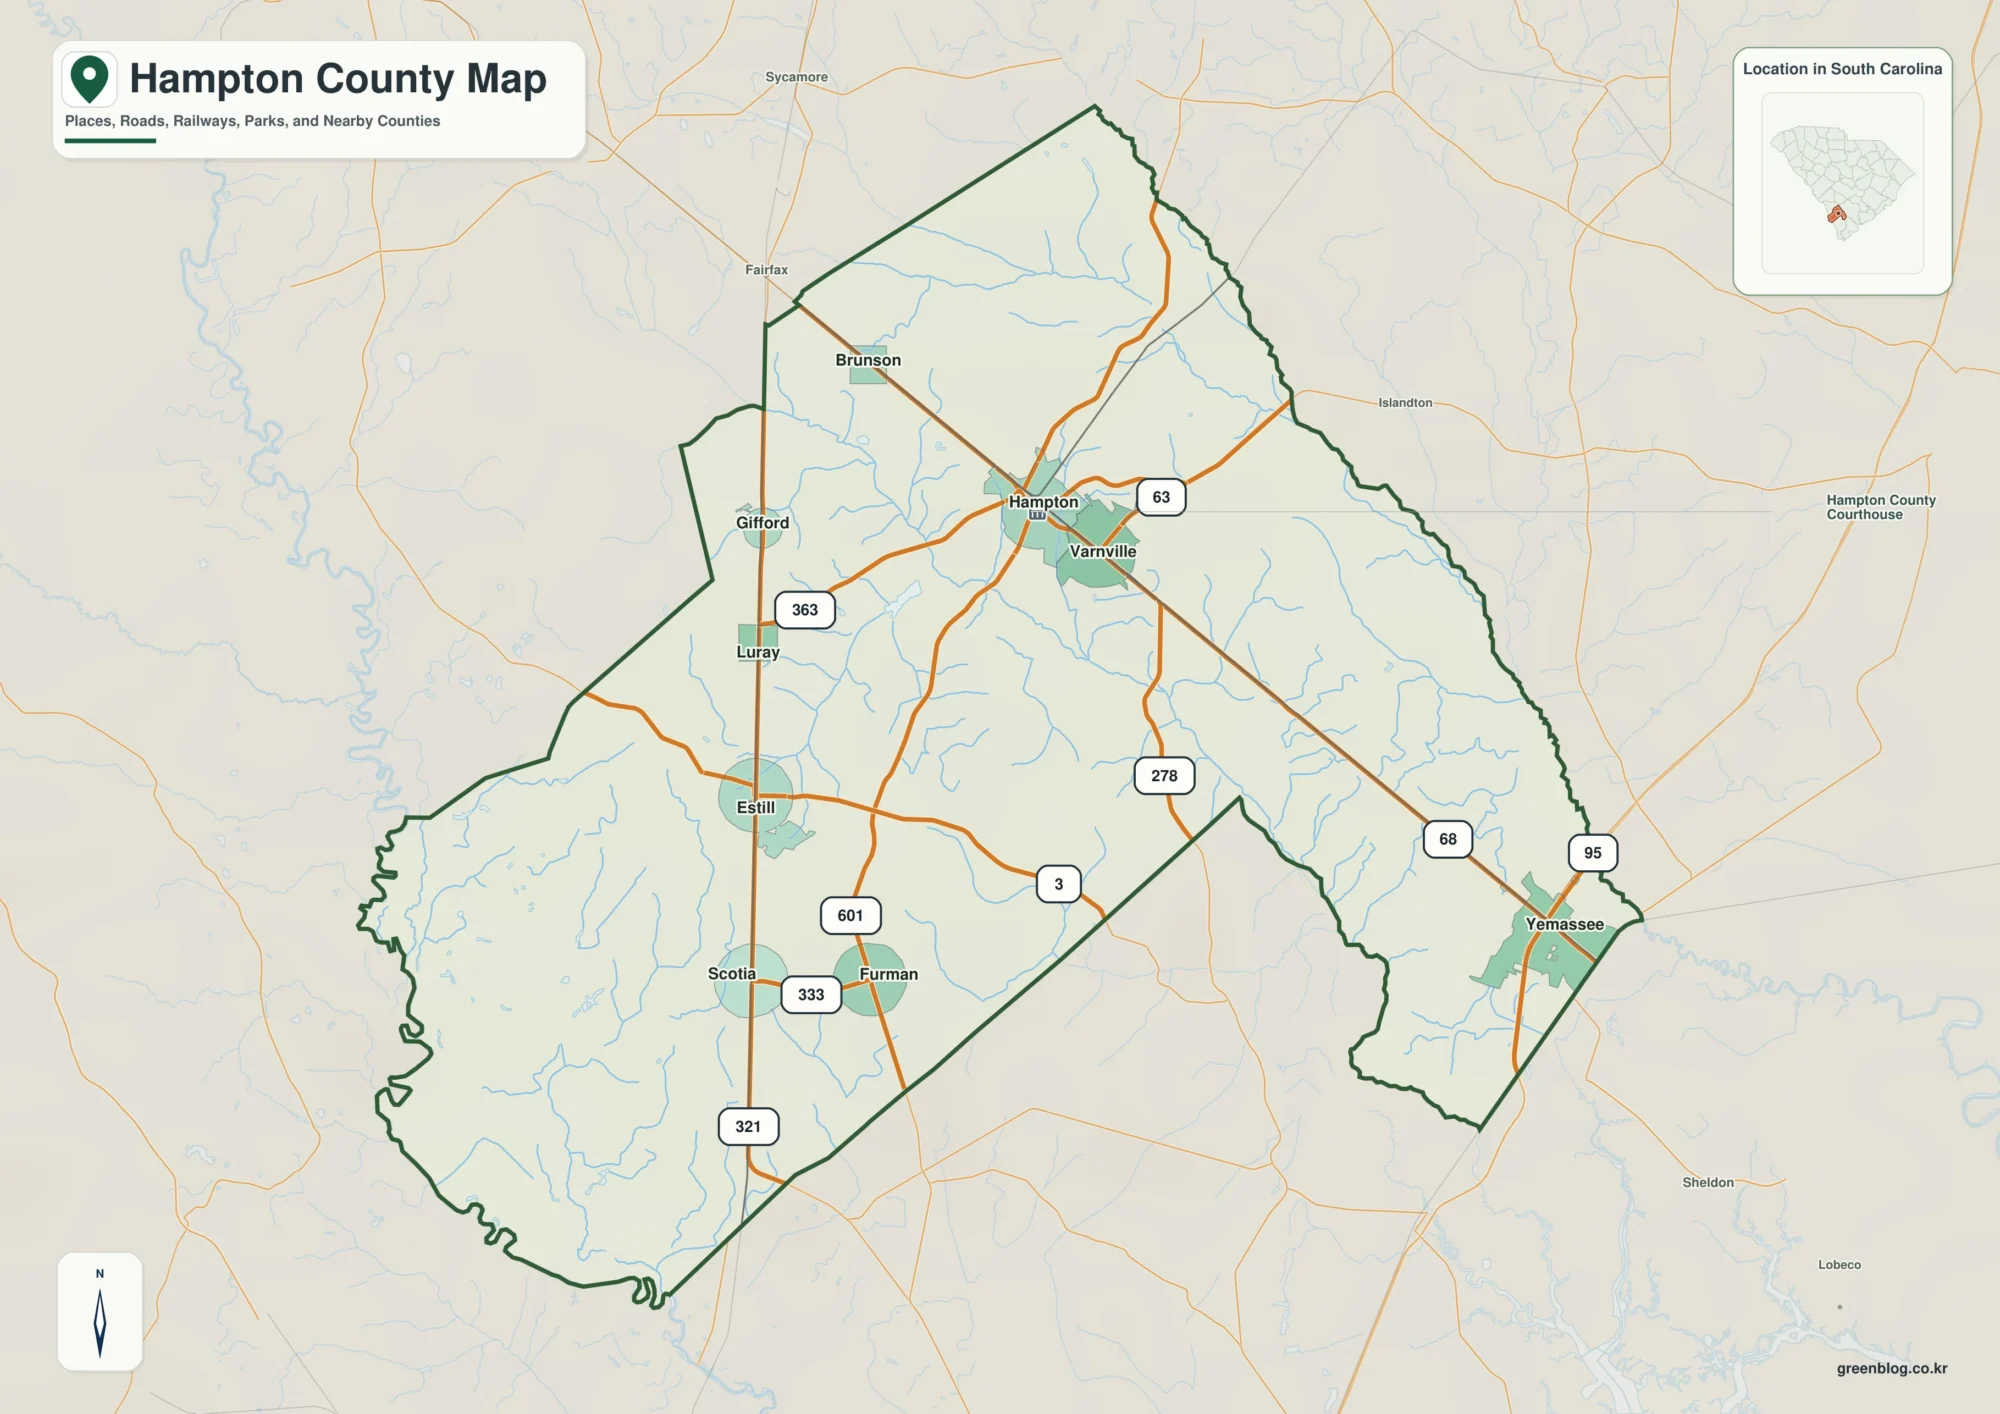
The sparsest county averages are much lower. Allendale is about 18.8 people per square mile, Fairfield 29.9, Williamsburg 32.4, Hampton 32.6, and Bamberg 33.2. Greenville’s average is therefore more than thirty times Allendale’s. The statewide figure of roughly 176 people per square mile combines dense metropolitan and suburban counties with broad rural areas where settlement is much thinner.
| Measure | Leading area | Value in supplied data |
|---|---|---|
| State population | South Carolina | 5,296,225 |
| Largest county population | Greenville County | 548,166 |
| Highest county density | Greenville County | about 697.5/sq mi |
| Fastest 2010–2020 growth | Horry County | +30.4% |
| Largest 2010–2020 decline | Allendale County | -22.8% |
Horry and Berkeley led 2010–2020 growth, while several central-southern counties declined sharply
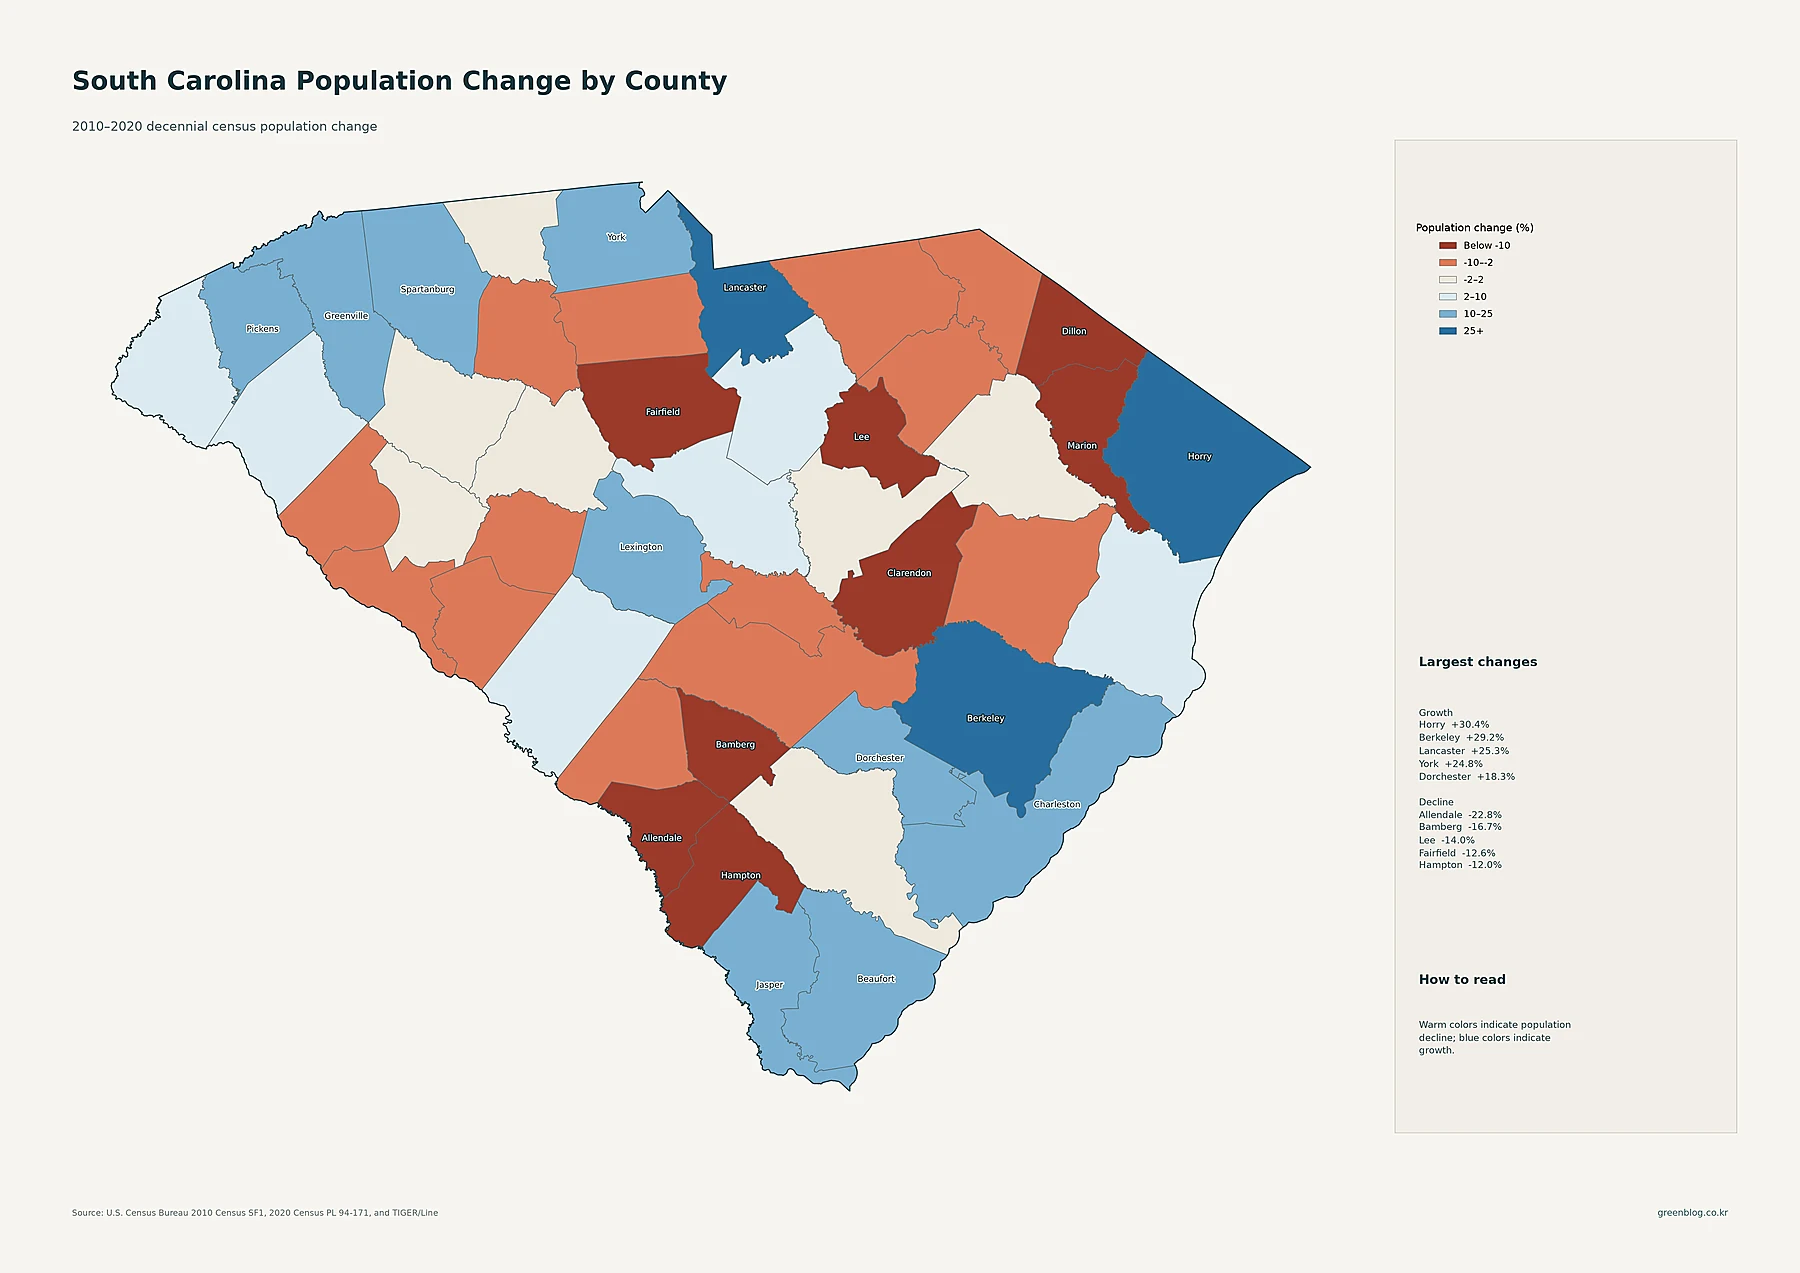
Horry County recorded the fastest percentage increase in the supplied decade data. Its population rose from 269,291 in 2010 to 351,029 in 2020, an increase of about 30.4%. Berkeley County grew 29.2%, Lancaster 25.3%, and York 24.8%. Dorchester increased 18.3%, Charleston 16.6%, Greenville 16.5%, Jasper 16.2%, and Spartanburg and Beaufort each grew about 15.4%.
The growth pattern spans multiple regions. Horry leads on the northeastern coast. Berkeley, Dorchester, and Charleston create a southeastern growth cluster. York and Lancaster stand out in the north, while Greenville and Spartanburg grew strongly in the Upstate. Greenville has the largest current county population, but Horry and Berkeley grew much faster in percentage terms during the 2010s.
Several counties declined substantially. Allendale fell from 10,419 residents in 2010 to 8,039 in 2020, a decrease of about 22.8%. Bamberg declined 16.7%, Lee 14.0%, Fairfield 12.6%, Hampton 12.0%, and Dillon and Marion each lost about 11.8%. The warm colors on the change map are concentrated across several central-southern and eastern-interior counties. These figures belong to the 2010–2020 decennial-census period and should not be described as 2024 ACS changes.
South Carolina’s current population leaders and fastest-growing counties are not the same places
The full map set shows a genuinely multi-centered state. Greenville County leads current county population and county-average density, while Charleston is the largest census place. Richland and Lexington anchor the central Midlands, and the Charleston–Berkeley–Dorchester region forms a major coastal concentration. Horry adds another strong coastal center around Myrtle Beach and Conway, while York and Lancaster stand out near the northern border.
The 2010–2020 change map adds a different ranking. Horry and Berkeley grew fastest, York and Lancaster also expanded rapidly, and Greenville and Spartanburg posted substantial gains. At the same time, Allendale, Bamberg, Lee, Fairfield, and several other counties lost population. Place totals, county totals, county density, tract density, and historical change therefore answer different questions. Keeping those measures separate gives the clearest picture of where South Carolinians live and which parts of the state changed most during the decade.
Download the South Carolina population map collection
The ZIP includes detailed census-tract density, major cities and urban areas, county population totals, 2010–2020 county population change, and county population density.
FAQ
Which South Carolina county has the largest population?
Greenville County is the largest in the supplied 2024 ACS 5-year estimates, with 548,166 residents. Richland County has 422,117 and Charleston County 420,264.
Which South Carolina county has the highest population density?
Greenville County has the highest county-average density at about 697.5 people per square mile. Richland is about 557.4 and Charleston about 457.7 people per square mile.
Which South Carolina county grew fastest from 2010 to 2020?
Horry County grew about 30.4%, followed by Berkeley at 29.2%, Lancaster at 25.3%, and York at 24.8%. These percentages compare the 2010 and 2020 decennial censuses.
Related Maps
Sources
- U.S. Census Bureau — American Community Survey (ACS): 2024 5-year population and density estimates
- U.S. Census Bureau — TIGER/Line Shapefiles: 2024 state, county, census tract, and census place boundaries
- U.S. Census Bureau — Decennial Census: 2010 and 2020 county population comparison
Green Map creates custom-edited map images using open geographic data sources such as geoBoundaries, Natural Earth, OpenStreetMap, and government open data.
These maps are edited visual materials, not raw data files, and are provided for education, documents, presentations, and graphic reference.