Rhode Island is the smallest U.S. state by land area, but its population is far from evenly distributed. The supplied 2024 ACS 5-year maps show a dense northern settlement pattern centered on Providence and extending through Pawtucket, Central Falls, Cranston, East Providence, and nearby communities. Newport forms a separate coastal cluster, while southern and western portions of the state contain much broader low-density areas. That contrast is visible even though Rhode Island as a whole has a very high average density.
The 2024 ACS estimate in the project data is 1,101,801 residents. The county-density map reports about 1,034 square miles of land and a statewide average near 1,066 people per square mile. Those statewide figures are only a starting point. Providence County contains by far the largest number of residents, but Bristol County has the highest county-average density. The 2010–2020 census comparison adds another distinction: all five counties grew, with Providence County posting the largest percentage increase.
Table of Contents
Providence and Pawtucket form Rhode Island’s strongest tract-level density corridor
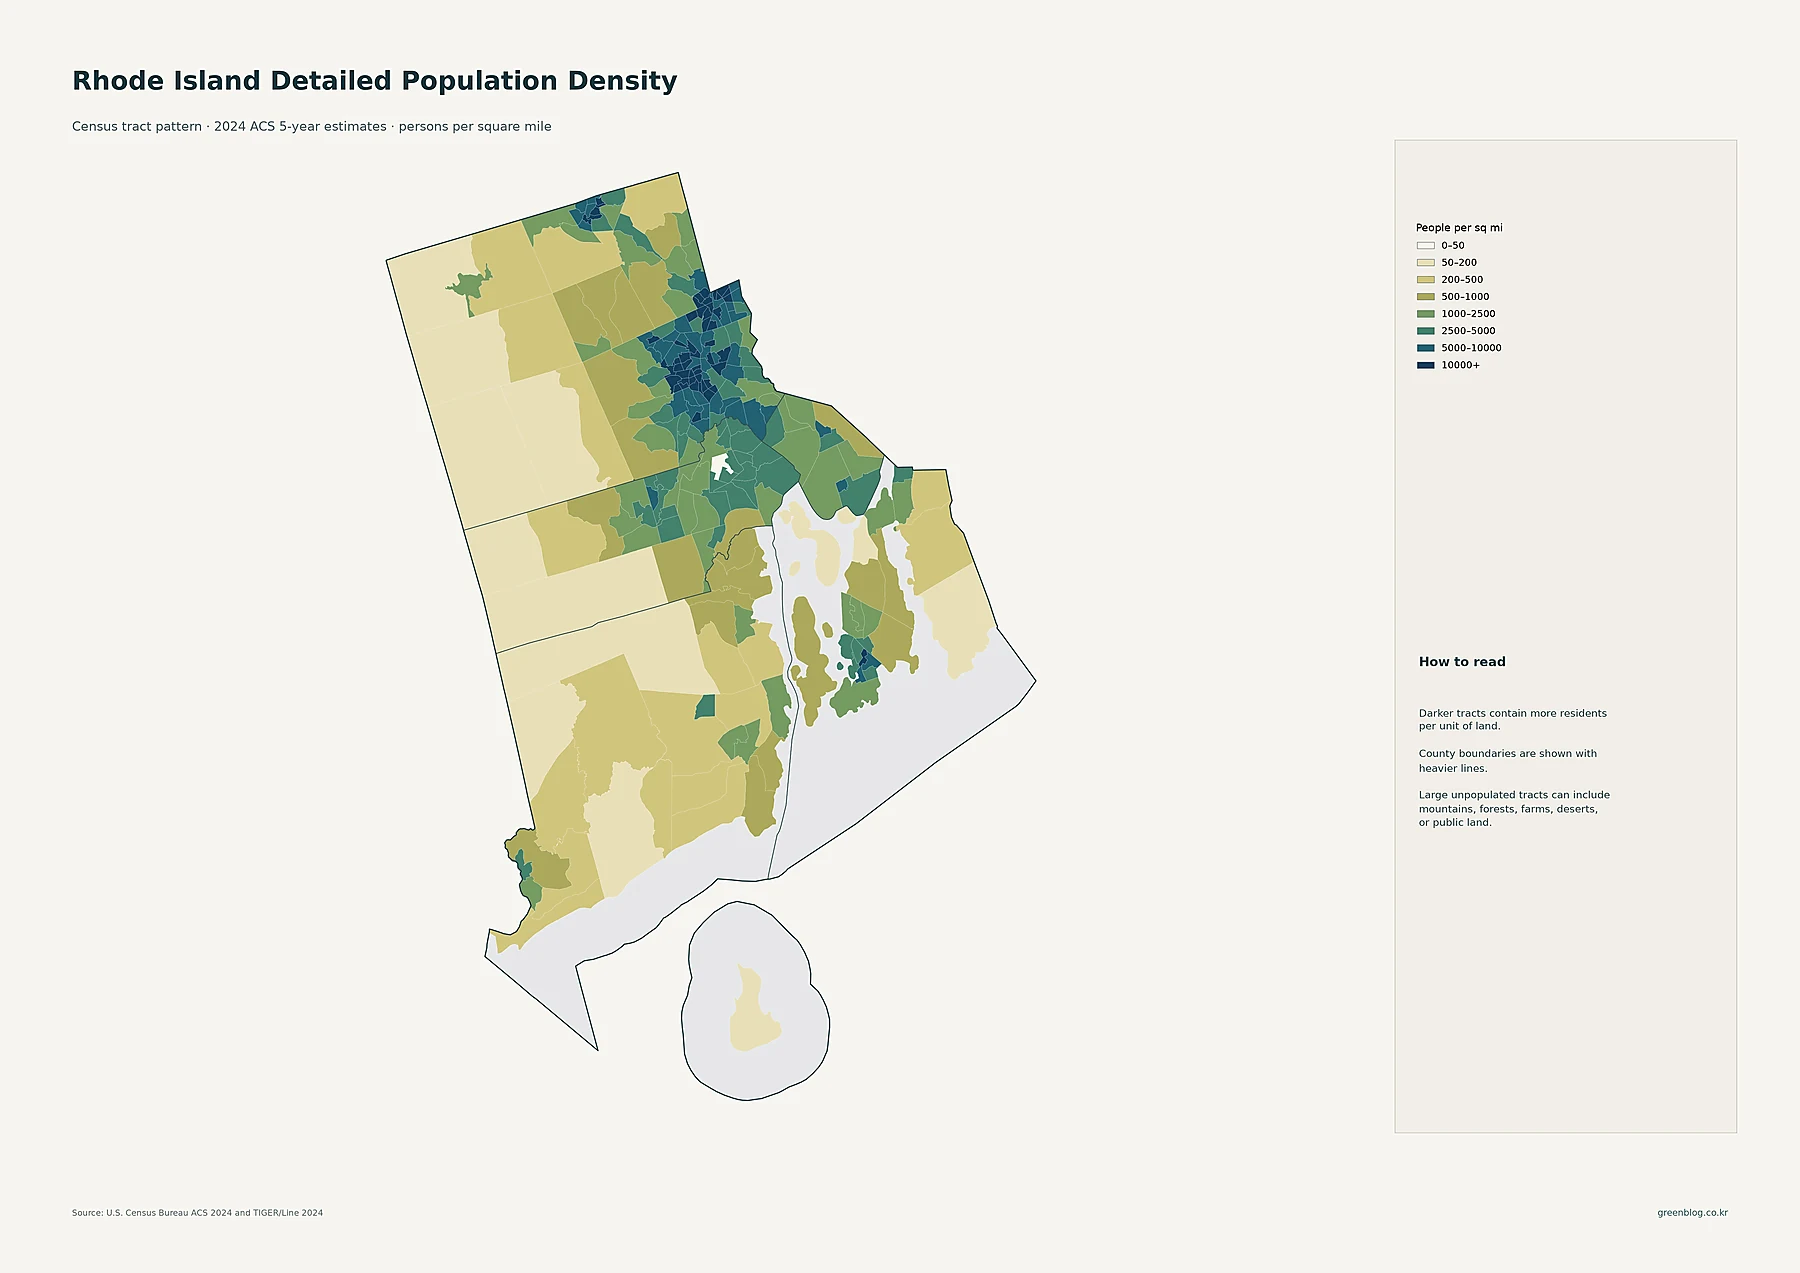
The darkest tracts concentrate around Providence and continue north and northeast toward Pawtucket, Central Falls, and Valley Falls. Many tracts fall into the 2,500–5,000, 5,000–10,000, or 10,000+ people-per-square-mile classes. Cranston and East Providence add more high-density tracts immediately around the core. On the map, northern Rhode Island therefore looks like a connected urban settlement area rather than a single dense city surrounded by empty space.
Within Providence County, the pattern changes quickly toward the west. The western side contains many lighter tracts, showing that a county with a high average density can still include substantial lower-density territory. Kent County has the same kind of internal contrast at a smaller scale: Warwick and the northeastern part of the county are relatively dense, while farther southwest the tract colors become lighter.
Narragansett Bay creates several additional pockets of settlement. Newport and Newport East stand out on the eastern side of the bay. Farther south, Wakefield–Peace Dale and Narragansett Pier form a small cluster in Washington County, while Westerly creates another concentration near the southwestern state line. Much of the rest of Washington County is in the 50–200 or 200–500 people-per-square-mile classes, making the north-south contrast particularly clear.
Providence leads place population, with most of the largest circles concentrated in the north
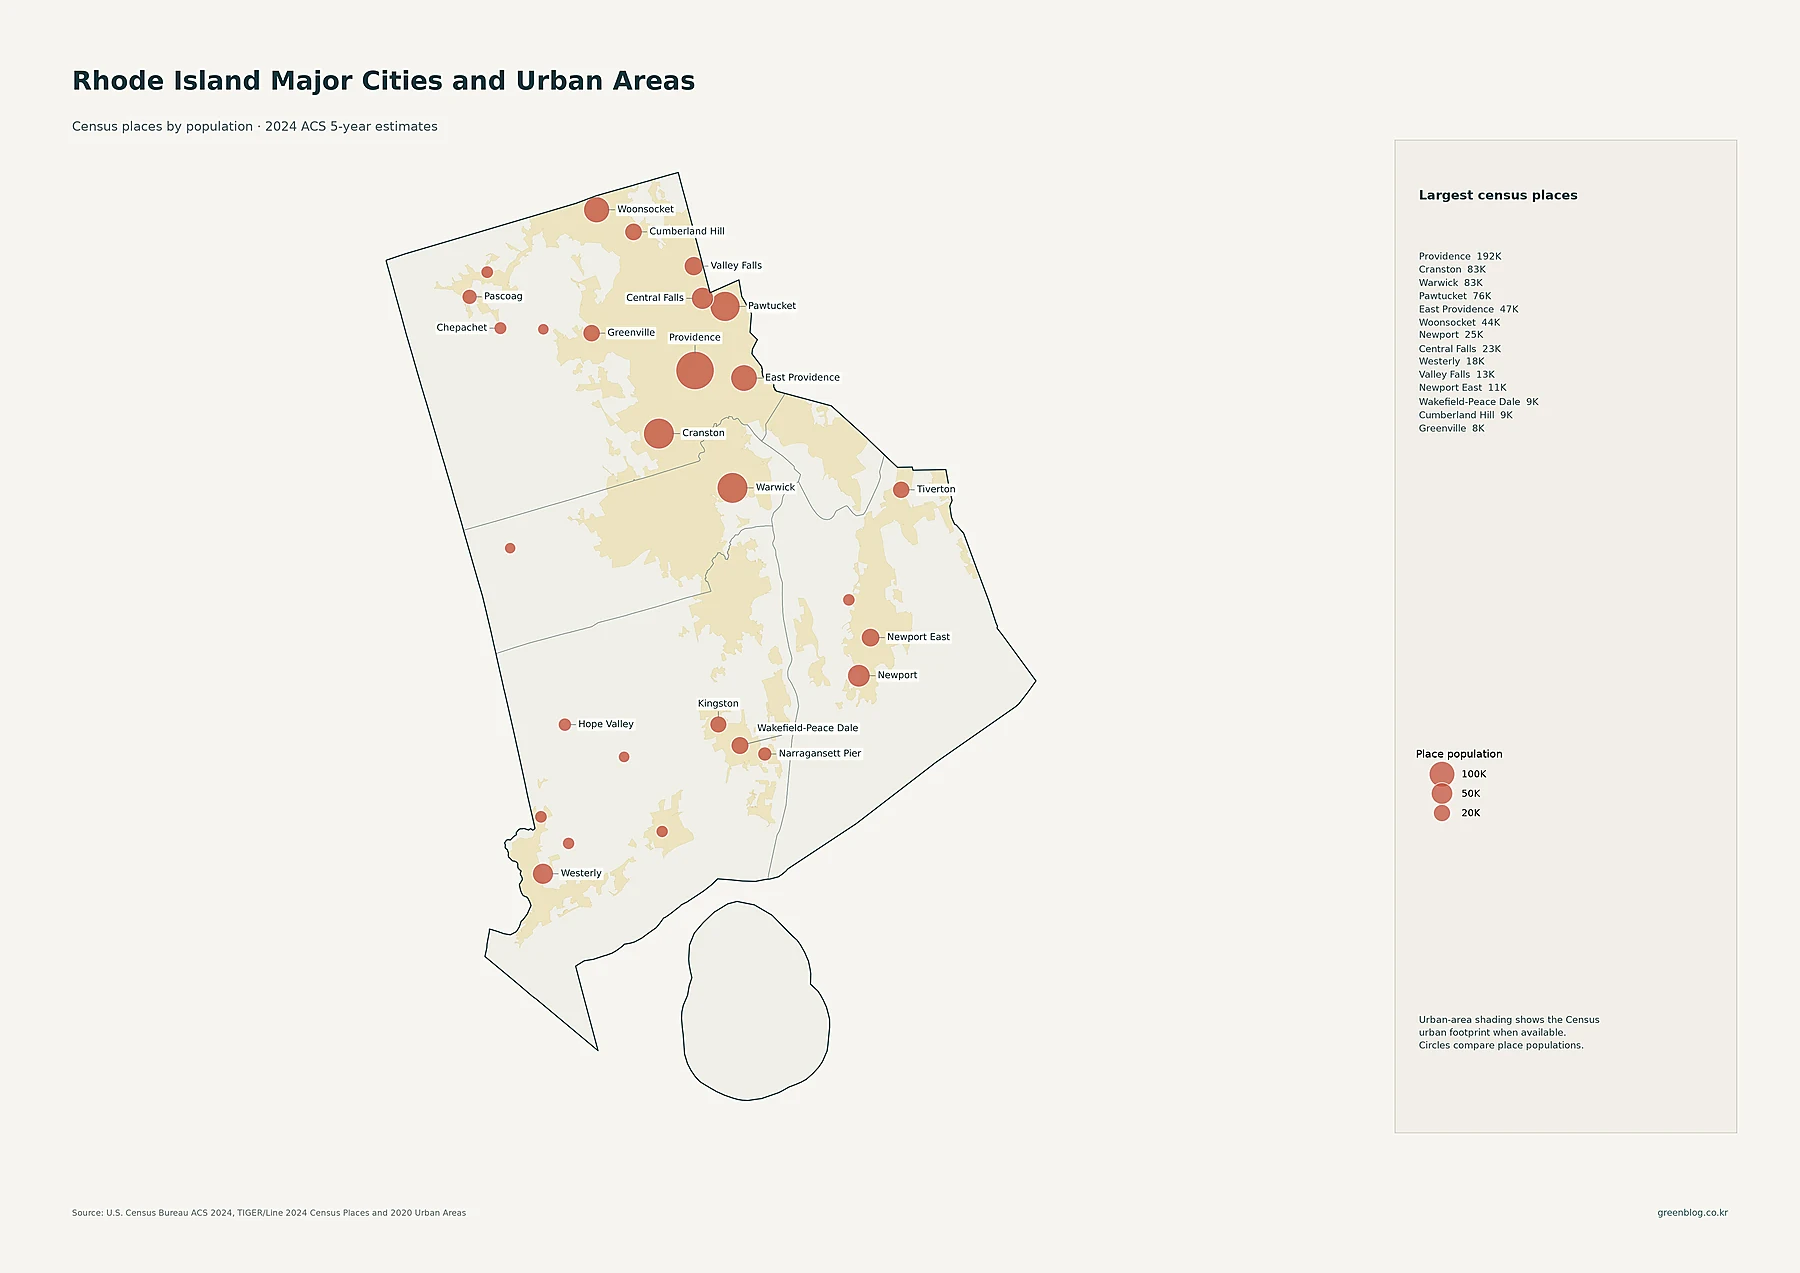
Providence has 191,767 residents in the supplied census-place data, making it the largest place by a wide margin. Cranston has 83,250 residents and Warwick 83,175, almost identical totals. Pawtucket follows with 75,893. East Providence has 47,281 residents, Woonsocket 43,521, Newport 24,874, and Central Falls 22,701. Westerly has 18,411, Valley Falls 12,657, Newport East 11,069, and Wakefield–Peace Dale 9,302.
Most of the largest proportional circles are packed into northern Rhode Island. Providence, Cranston, Pawtucket, East Providence, Central Falls, and Woonsocket all sit within a relatively compact part of the state, while Warwick lies just to the south. Newport and Westerly are more isolated population centers in the southern half. The spatial arrangement helps explain why the tract-density map is so dark in the north even before county averages are considered.
The circles show total place population, not people per square mile. Providence’s large symbol means it has the largest census-place population in the supplied data. It should not be used as a substitute for a density ranking. The tract map is the better layer for seeing how tightly residents occupy land within and around each city.
Providence County contains more than half of Rhode Island’s residents
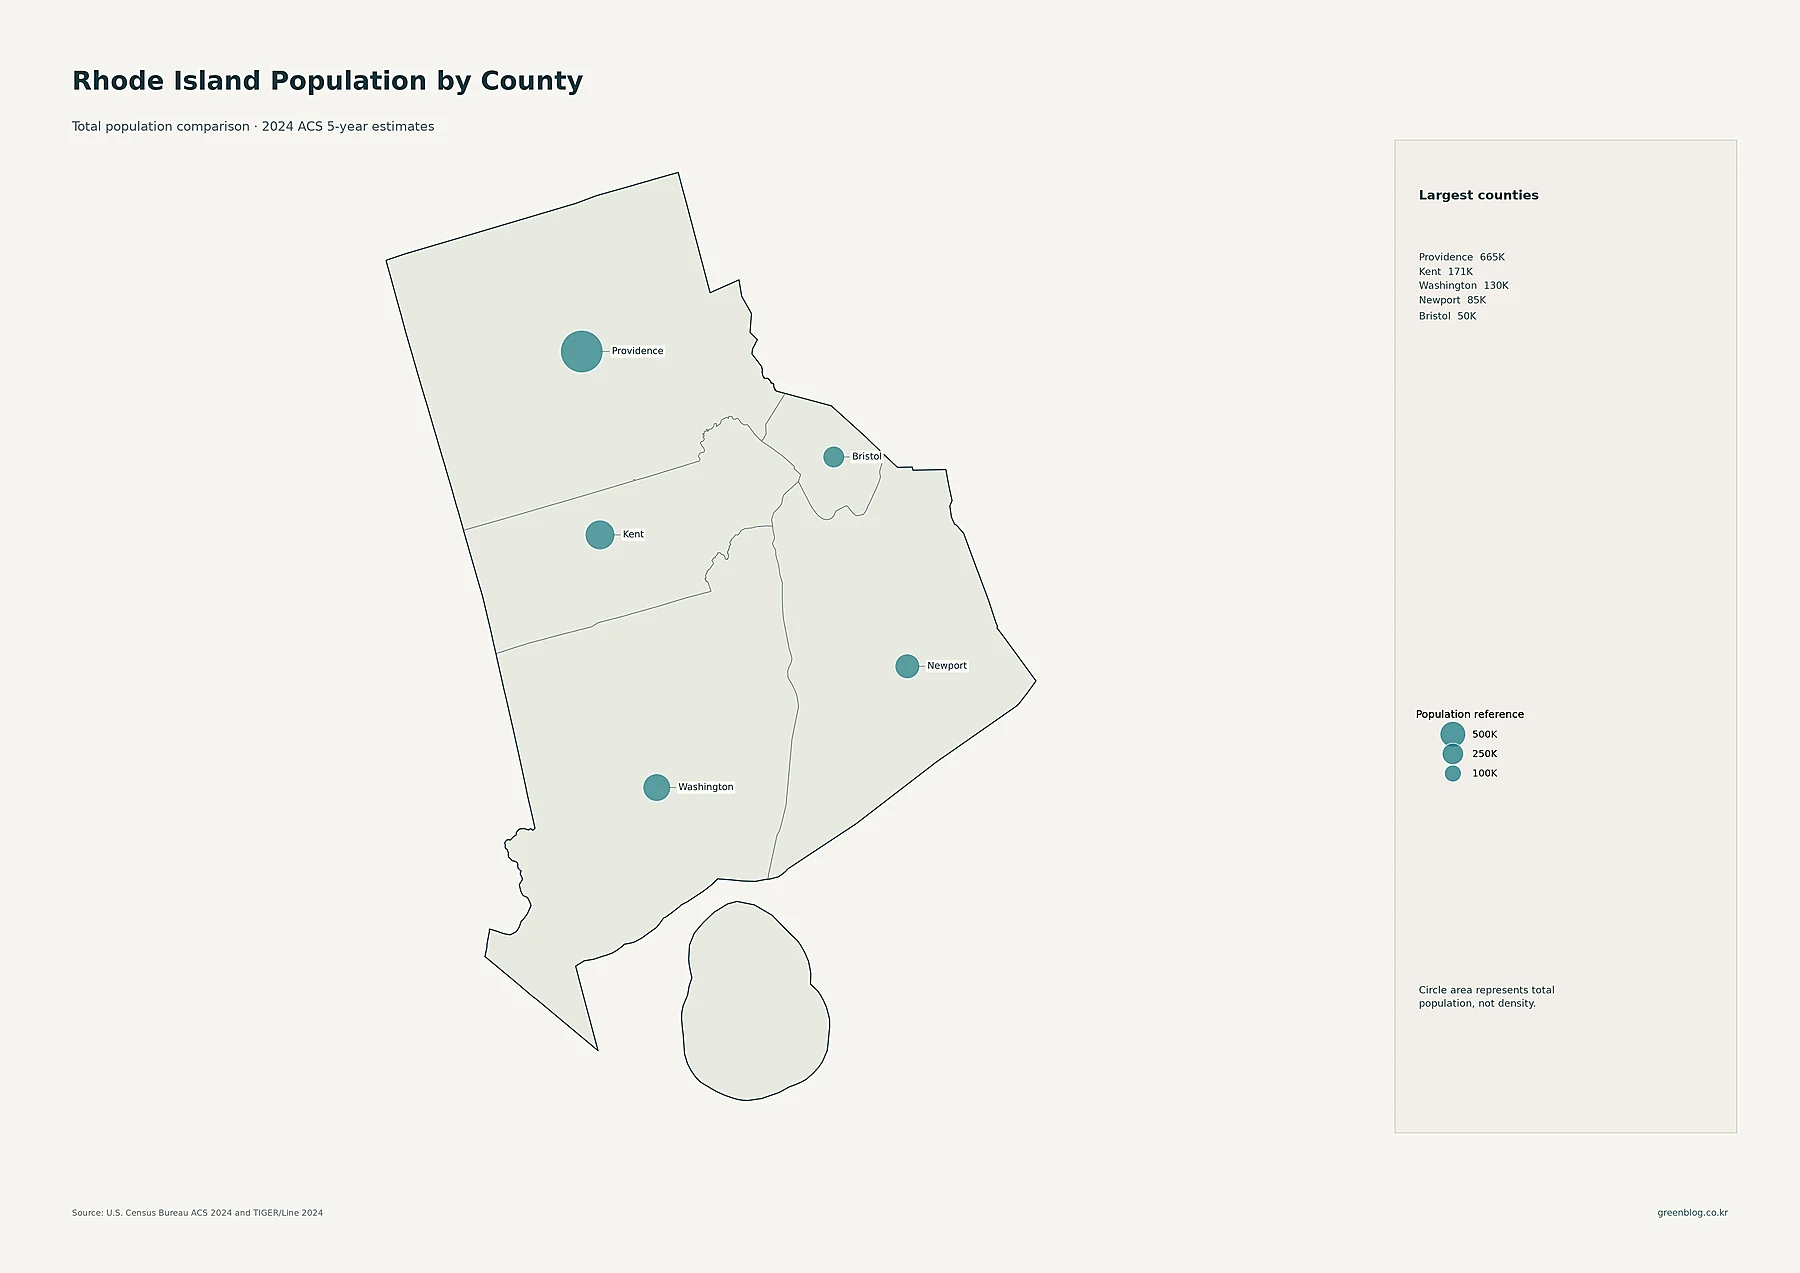
Providence County has 664,854 residents, by far the largest total among Rhode Island’s five counties. Kent County is second with 171,456, followed by Washington County at 130,344. Newport County has 84,657 residents, and Bristol County has 50,490. Because there are only five counties, the difference in circle size is unusually easy to read.
The Providence County total reflects the concentration of several large census places within one county. Kent County includes Warwick and other suburban communities. Washington County has more residents than Newport or Bristol, but those residents are spread across a much larger land area. That distinction is crucial: Washington ranks third in total county population but last in county-average density.
Bristol County is the densest even though it has the smallest total population
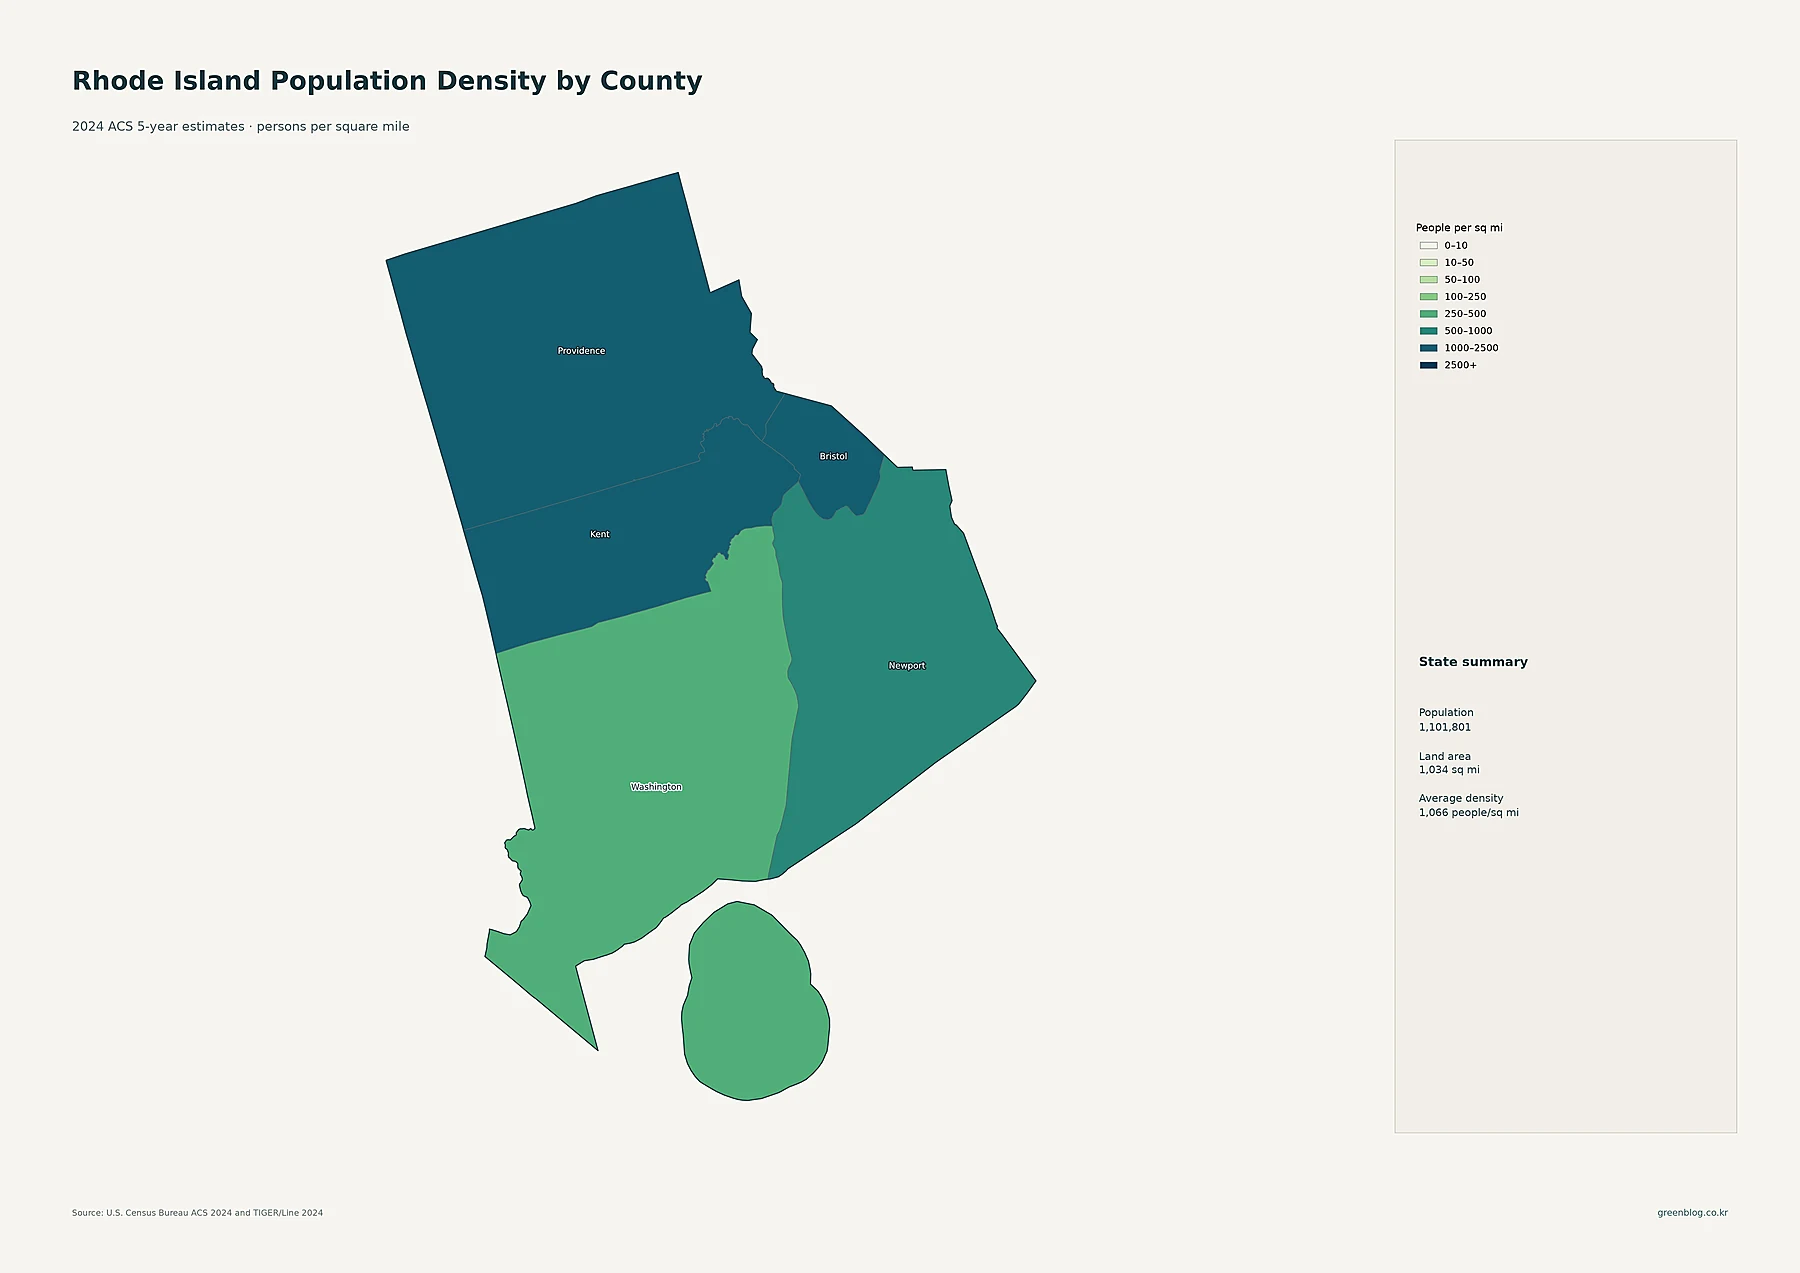
Bristol County has the highest average density at about 2,092.3 people per square mile. Providence County is second at about 1,623.6. Kent County averages about 1,017.1, Newport County 826.5, and Washington County 395.8. The ranking demonstrates why total population and density cannot be treated as interchangeable. Bristol has the smallest county population but the highest average density because its land area is also very small.
Providence County combines a very large population with a high average density, yet its western rural tracts lower the countywide average below Bristol’s. Washington County tells the opposite story. Its 130,344 residents make it the third-largest county by total population, but the county covers enough land that its average density is the lowest of the five. The tract map adds useful detail by showing denser pockets around Westerly and the Wakefield–Narragansett area inside that lower county average.
| Measure | Leading area | Value in supplied data |
|---|---|---|
| State population | Rhode Island | 1,101,801 |
| Largest county population | Providence County | 664,854 |
| Highest county density | Bristol County | about 2,092.3/sq mi |
| Fastest 2010–2020 growth | Providence County | +5.4% |
| Slowest 2010–2020 growth | Bristol County | +1.8% |
Every Rhode Island county gained population from 2010 to 2020
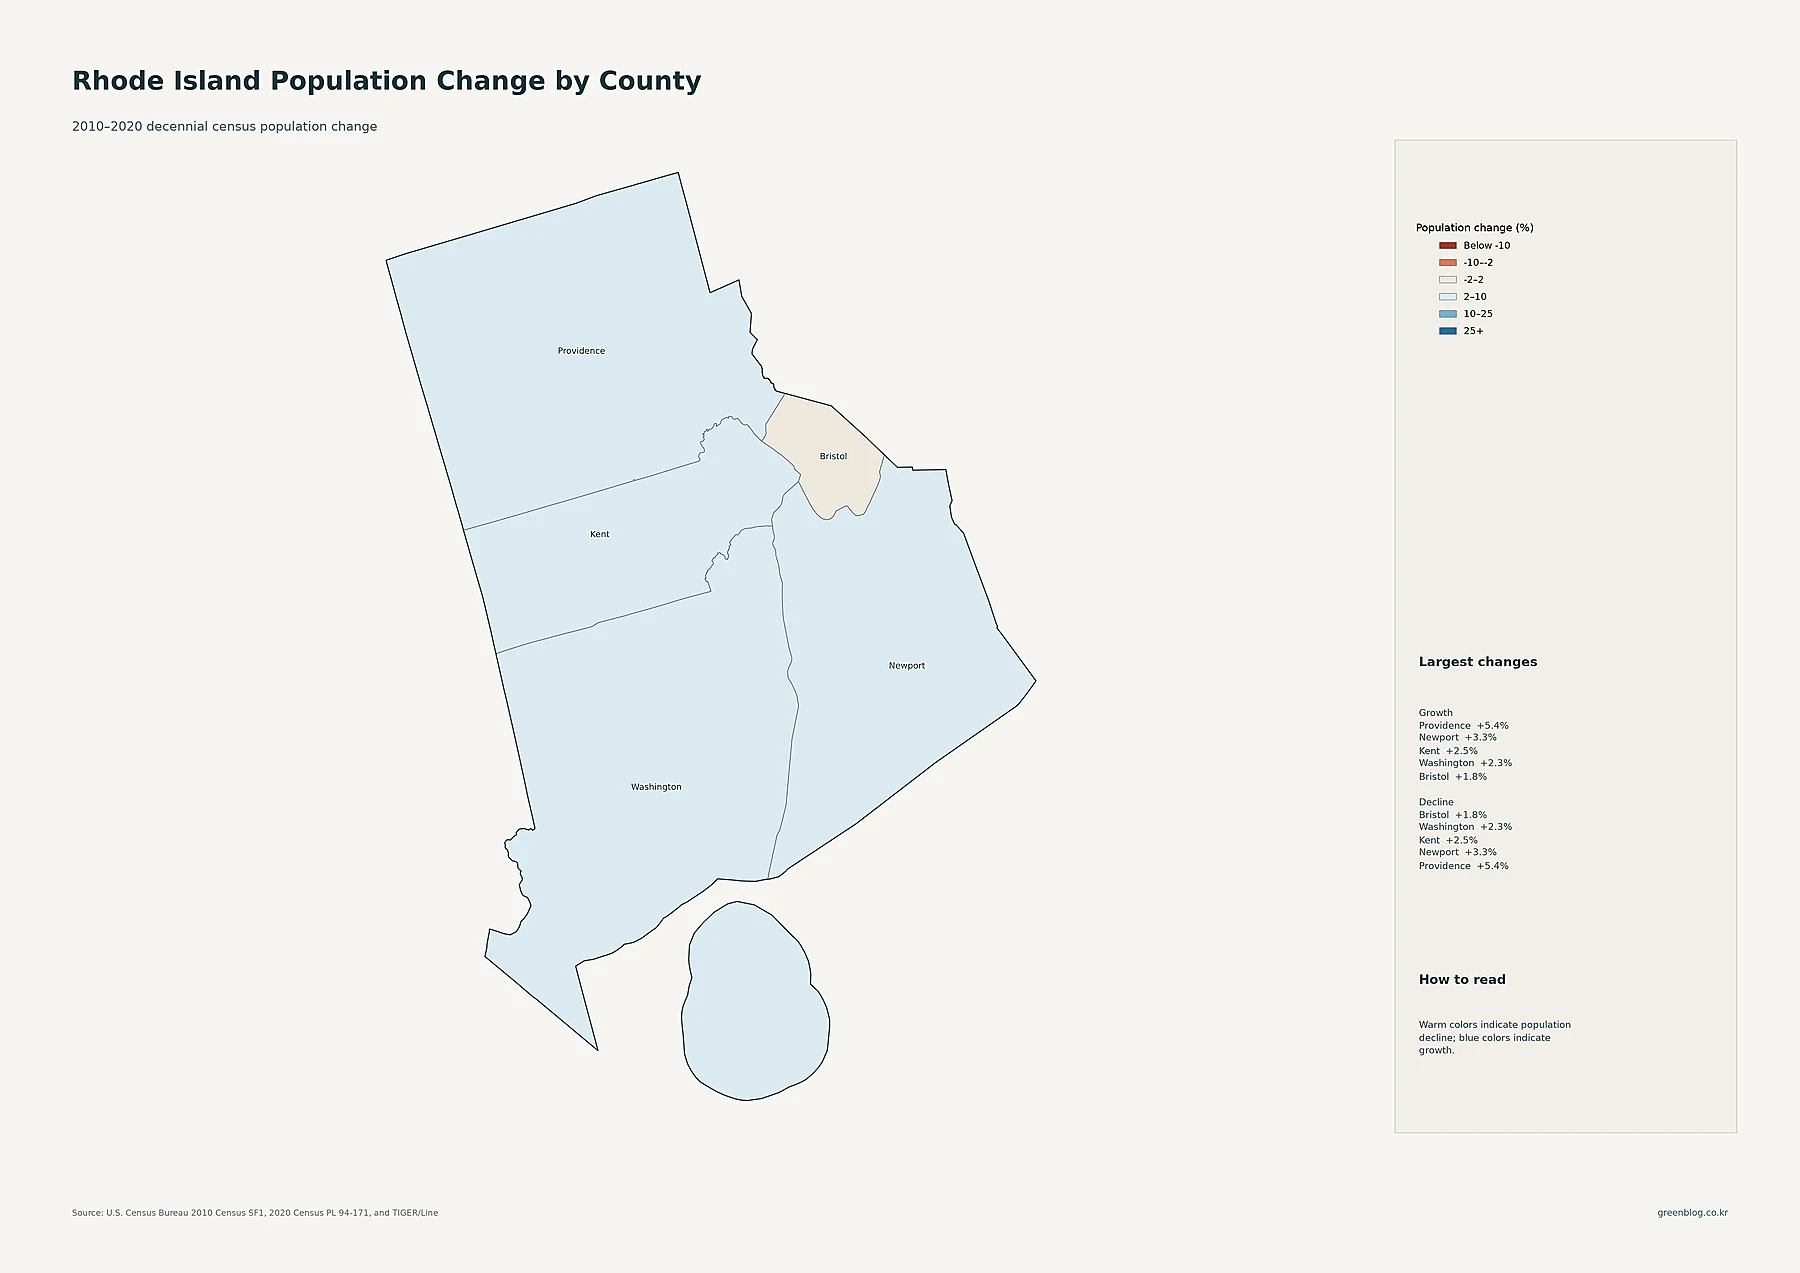
Providence County recorded the largest percentage increase, rising from 626,667 residents in 2010 to 660,741 in 2020, or about 5.4%. Newport County grew from 82,888 to 85,643, a gain of about 3.3%. Kent County increased 2.5%, Washington County 2.3%, and Bristol County 1.8%.
No county declined in the supplied 2010–2020 comparison. That makes Rhode Island different from many larger states where strong growth regions and shrinking rural counties appear on the same map. Here, the useful comparison is the pace of positive change. Providence grew fastest, while Bristol had the smallest percentage gain. The ranking also shows that the densest county was not the fastest-growing county.
These percentages belong specifically to the 2010 and 2020 decennial censuses. They should not be described as 2024 growth rates. The 2024 ACS layers describe current estimated population and density, while the change map describes how county populations moved during the previous census decade.
Rhode Island’s small size contains a clear north-to-south population contrast
Across all five maps, northern Rhode Island is the strongest current population core. Providence County contains the largest county population, and the Providence–Pawtucket–Central Falls area has the broadest concentration of high-density census tracts. Bristol County adds an important counterexample: it has the smallest county population but the highest county-average density. Kent is centered on Warwick and nearby communities, while Newport County combines coastal population centers with less-dense territory.
Washington County is the clearest contrast. It has more than 130,000 residents but the lowest county-average density because its population is spread across a larger area. Westerly and the Wakefield–Narragansett area still create local density peaks inside that broader pattern. The 2010–2020 map adds one final point: all five counties grew. Keeping place totals, county totals, tract density, county density, and historical change separate produces a more accurate picture of how Rhode Island’s population is organized.
Download the Rhode Island population map collection
The ZIP includes detailed census-tract density, major cities and urban areas, county population totals, 2010–2020 county population change, and county population density.
FAQ
Which Rhode Island county has the largest population?
Providence County is the largest in the supplied 2024 ACS 5-year estimates, with 664,854 residents. Kent County has 171,456 and Washington County 130,344.
Which Rhode Island county has the highest population density?
Bristol County has the highest county-average density at about 2,092.3 people per square mile. Providence County is about 1,623.6 and Kent County about 1,017.1 people per square mile.
Did any Rhode Island county lose population from 2010 to 2020?
No. In the supplied decennial-census comparison, all five counties grew. Providence County had the largest increase at about 5.4%, while Bristol County had the smallest gain at about 1.8%.
Related Maps
Sources
- U.S. Census Bureau — American Community Survey (ACS): 2024 5-year population and density estimates
- U.S. Census Bureau — TIGER/Line Shapefiles: 2024 county, census tract, and census place boundaries
- U.S. Census Bureau — Decennial Census: 2010 and 2020 county population comparison
Green Map creates custom-edited map images using open geographic data sources such as geoBoundaries, Natural Earth, OpenStreetMap, and government open data.
These maps are edited visual materials, not raw data files, and are provided for education, documents, presentations, and graphic reference.