New Jersey is compact, heavily populated, and far from uniform. The supplied 2024 ACS 5-year estimates place the state population at 9,343,809. The county-density map lists about 7,355 square miles of land and a statewide average near 1,270 people per square mile. That average is useful as a reference, but it hides the strongest geographic contrast in the map set: the northeastern counties opposite New York City form an exceptionally dense urban belt, while much of the northwest, interior south, and far south is noticeably less dense.
The five maps separate several ideas that are easy to confuse. Census-tract density shows how tightly residents are packed within small areas. The major-cities map uses proportional circles to compare the total populations of census places. The county population map also uses circle area to represent totals, not density. County density divides population by land area, and the change map compares the 2010 and 2020 decennial censuses rather than showing a 2024 trend. Reading those layers together gives a much clearer picture than relying on one statewide average.
Table of Contents
Census tracts reveal an intense northeastern belt that county averages cannot fully capture
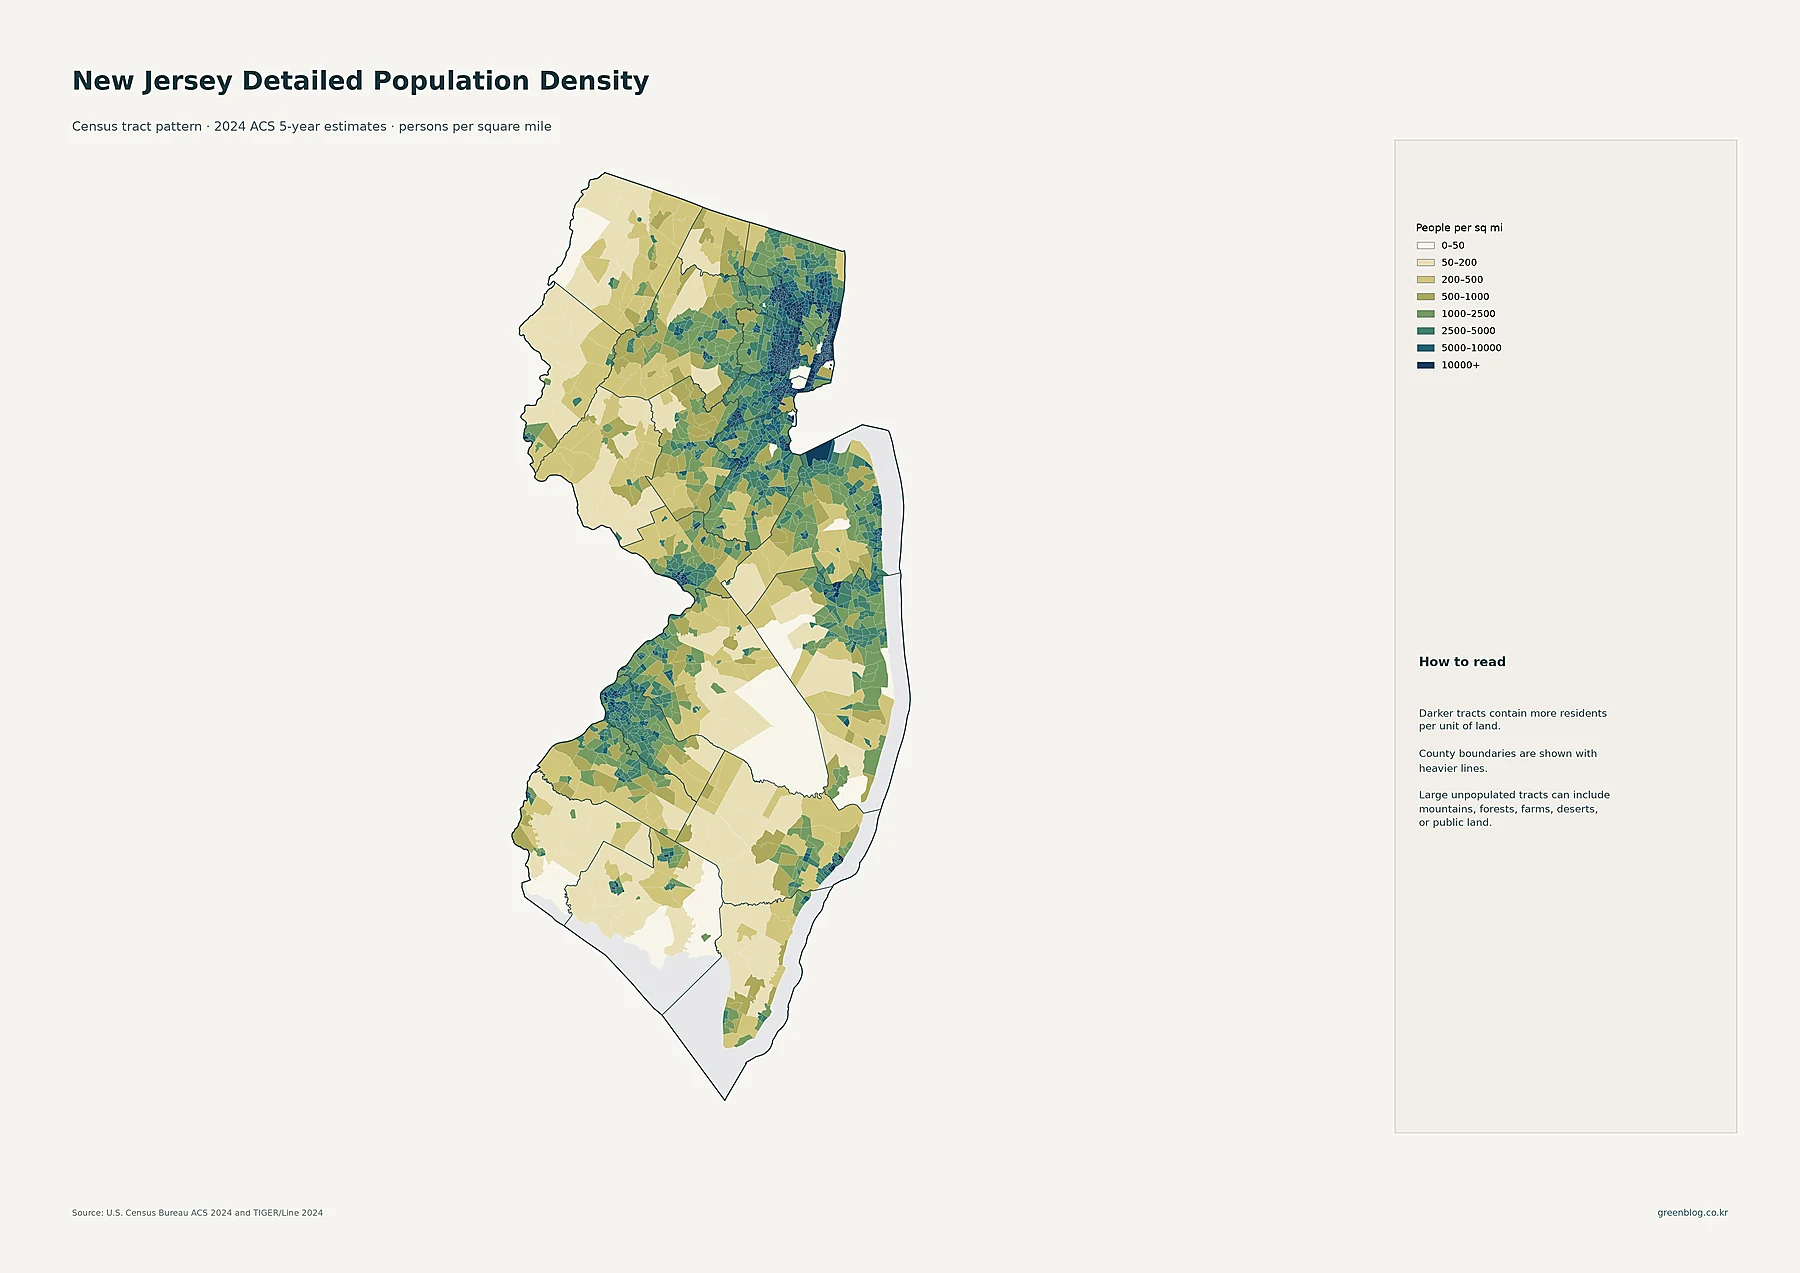
The darkest tracts cluster across Hudson, Essex, Bergen, and Union counties. Hudson County, directly across the Hudson River from New York City, contains many compact tracts in the highest density classes. Jersey City, Hoboken, Union City, and West New York sit within this tightly packed pattern. High-density tracts continue through Newark and Elizabeth and extend northward toward Paterson, Passaic, Hackensack, and other communities. The map makes northeastern New Jersey look less like a collection of isolated cities and more like a connected band of dense settlement.
Central New Jersey has additional clusters rather than one continuous block. New Brunswick and Perth Amboy stand out within the Middlesex area, while Trenton forms a separate concentration in Mercer County. Along the Jersey Shore, higher-density tracts are visible around Toms River and Lakewood. Camden creates another compact cluster opposite Philadelphia in the southwest. Farther south, Vineland and several smaller places appear as localized concentrations surrounded by much lighter tracts.
The lightest tract colors should not be interpreted as empty counties. Census tracts are much smaller than counties, so a single county can contain dense municipalities, lower-density suburbs, and large lightly populated tracts at the same time. Sussex, Warren, and Hunterdon in the northwest show broader low-density areas, as do parts of the southern interior, but the tract map still reveals smaller settlement centers inside them. That local variation is exactly what disappears when population is averaged across an entire county.
Newark and Jersey City lead the place totals, with large population circles packed into the northeast
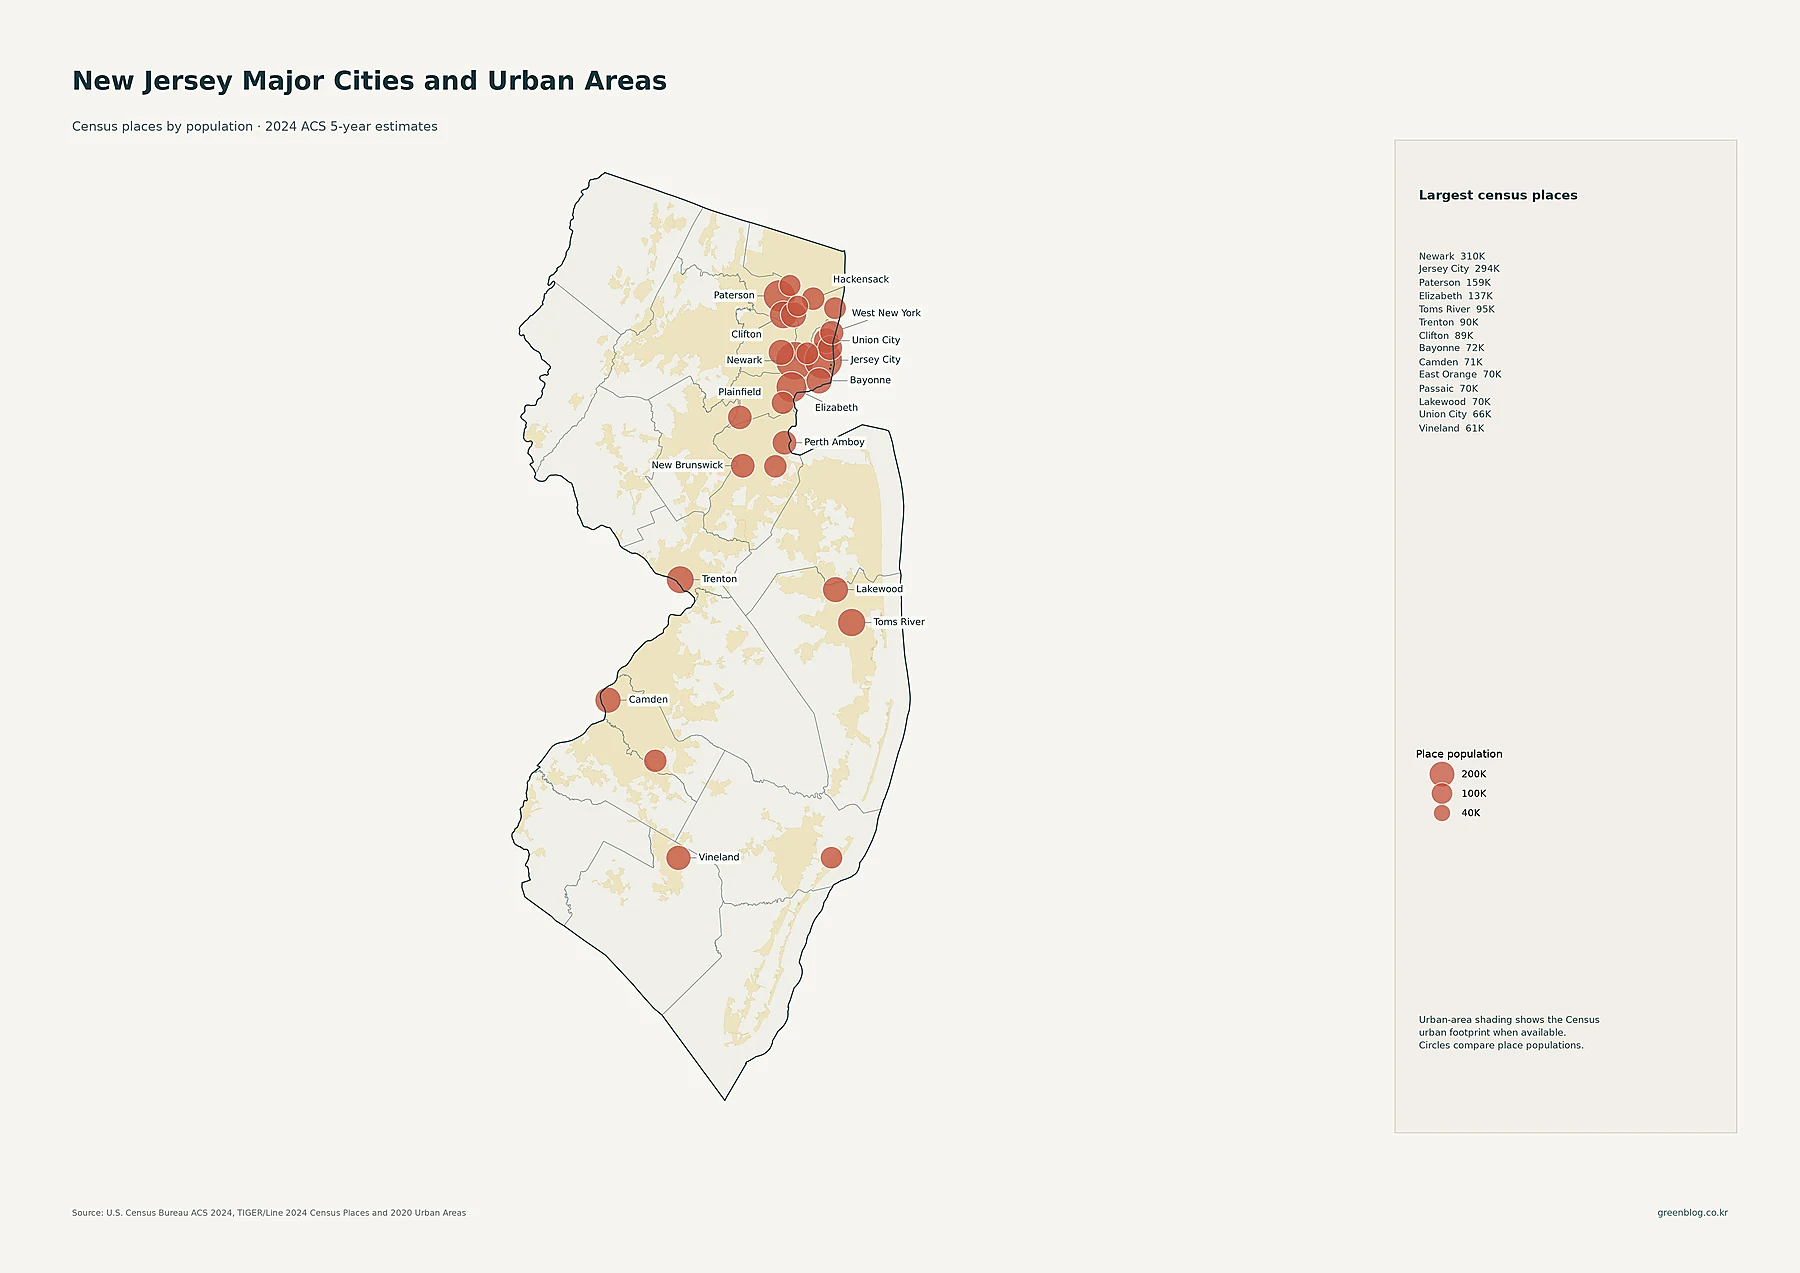
Newark is the largest census place in the supplied data with 310,178 residents, followed closely by Jersey City at 294,078. Paterson has 158,735 residents and Elizabeth 137,302. Those four large circles all sit in the northeastern part of the state. The next tier spreads farther south and inland: Toms River has 94,956 residents, Trenton 90,338, Clifton 89,379, Bayonne 71,553, Camden 71,496, East Orange 70,090, Passaic 70,002, Lakewood 69,585, Union City 66,463, and Vineland 61,006.
These circles represent total place population, not people per square mile. That distinction matters in New Jersey because municipal boundaries differ greatly in size. A larger circle means more residents within that census place, while the tract-density map answers the separate question of how tightly those residents occupy land. Used together, the two maps show both the size of major population centers and the fine-grained urban fabric surrounding them.
Bergen has the largest county population, but major totals also extend down the central coast
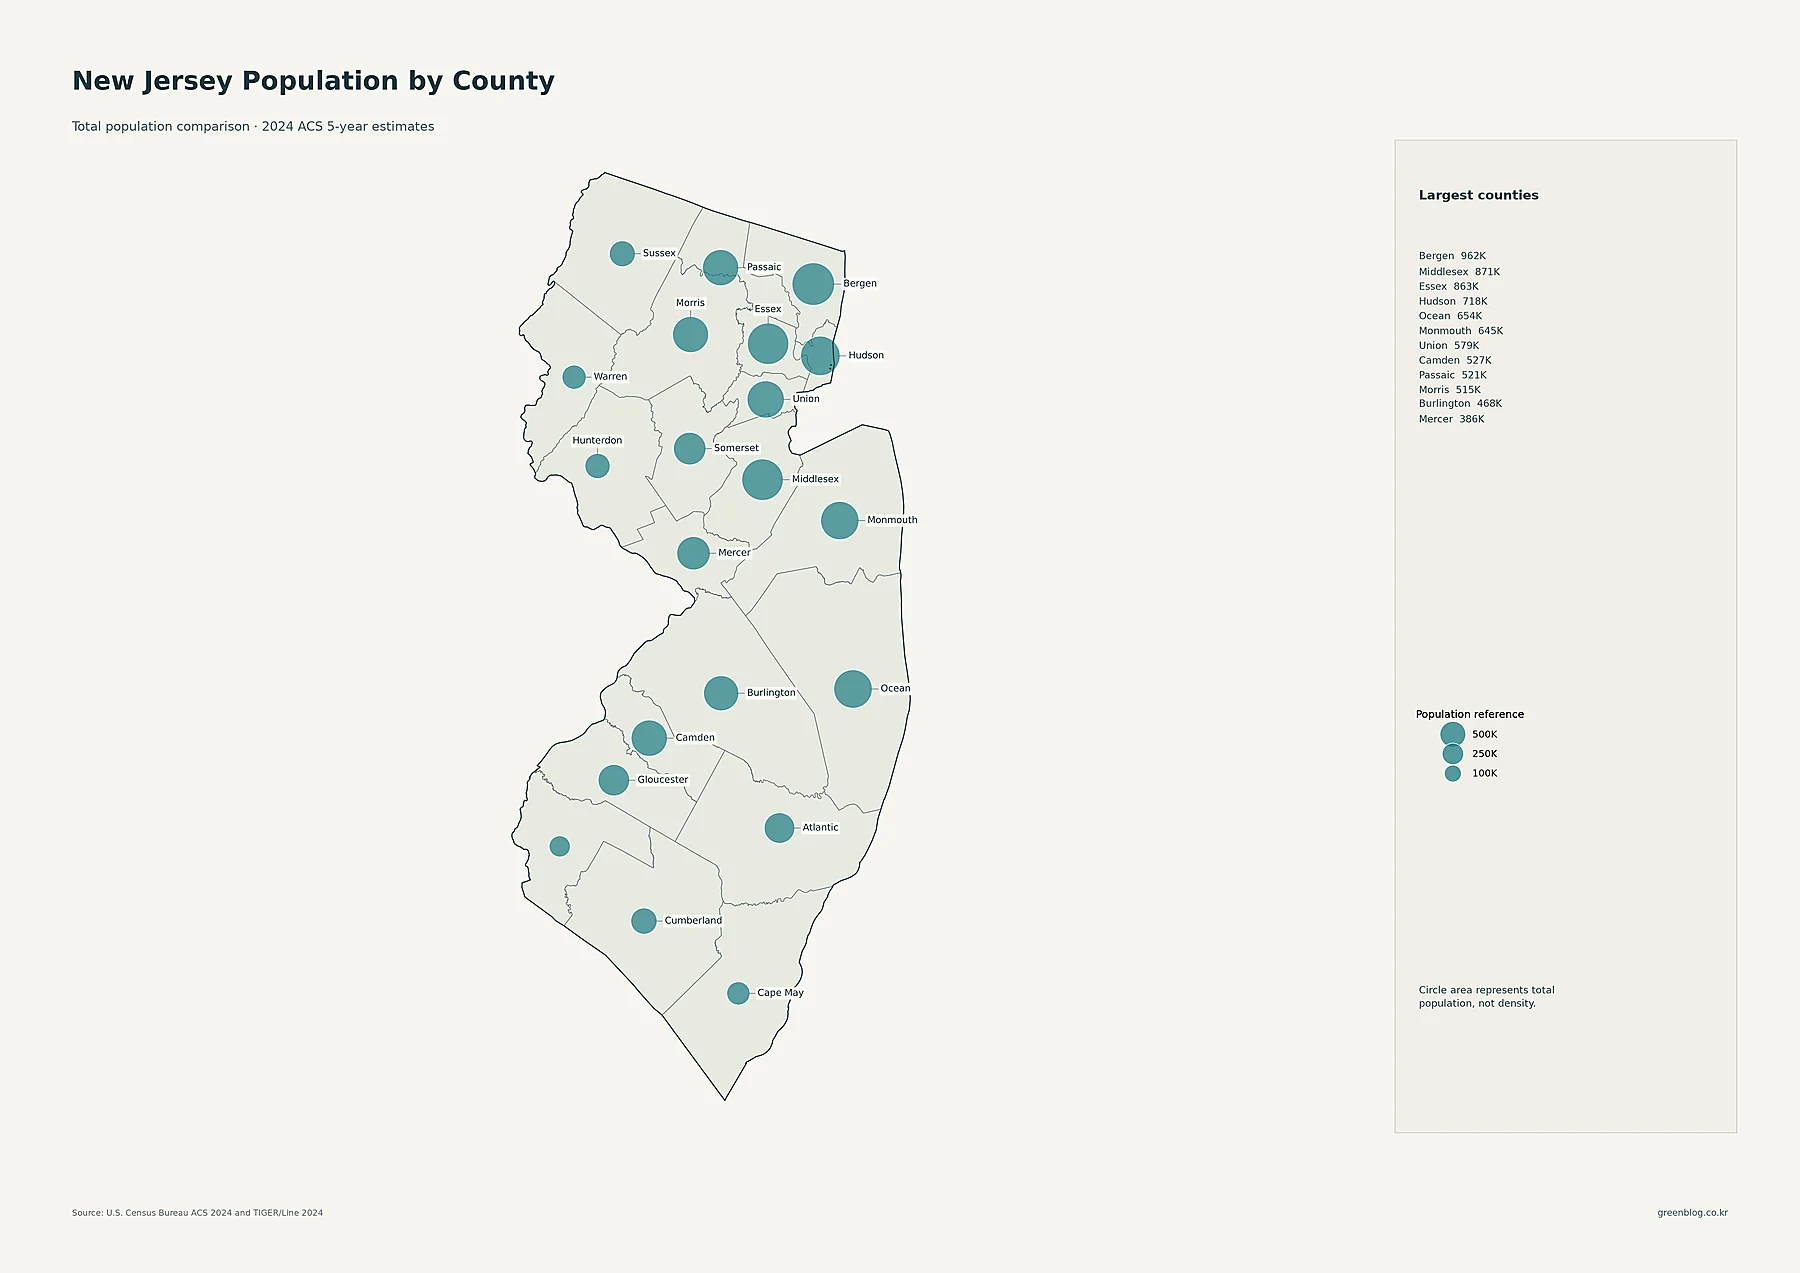
Bergen County has the largest current population at 962,316. Middlesex County follows with 871,290 and Essex County with 863,002. Hudson County has 718,323 residents. Ocean County, at 654,362, and Monmouth County, at 645,353, show that large county totals are not confined to the New York-facing northeast. Union has 579,290 residents, Camden 527,257, Passaic 521,012, and Morris 514,528, giving the map several large circles across both the northeast and central portions of the state.
At the smaller end, Salem County has 65,275 residents, Cape May 94,941, Warren 110,849, and Hunterdon 130,160. A small circle does not automatically mean the lowest density, because density also depends on land area. County totals are best used to compare the number of residents living within each county boundary. The next map changes the denominator and therefore changes the ranking.
Hudson averages more than 15,000 people per square mile, far above every other county
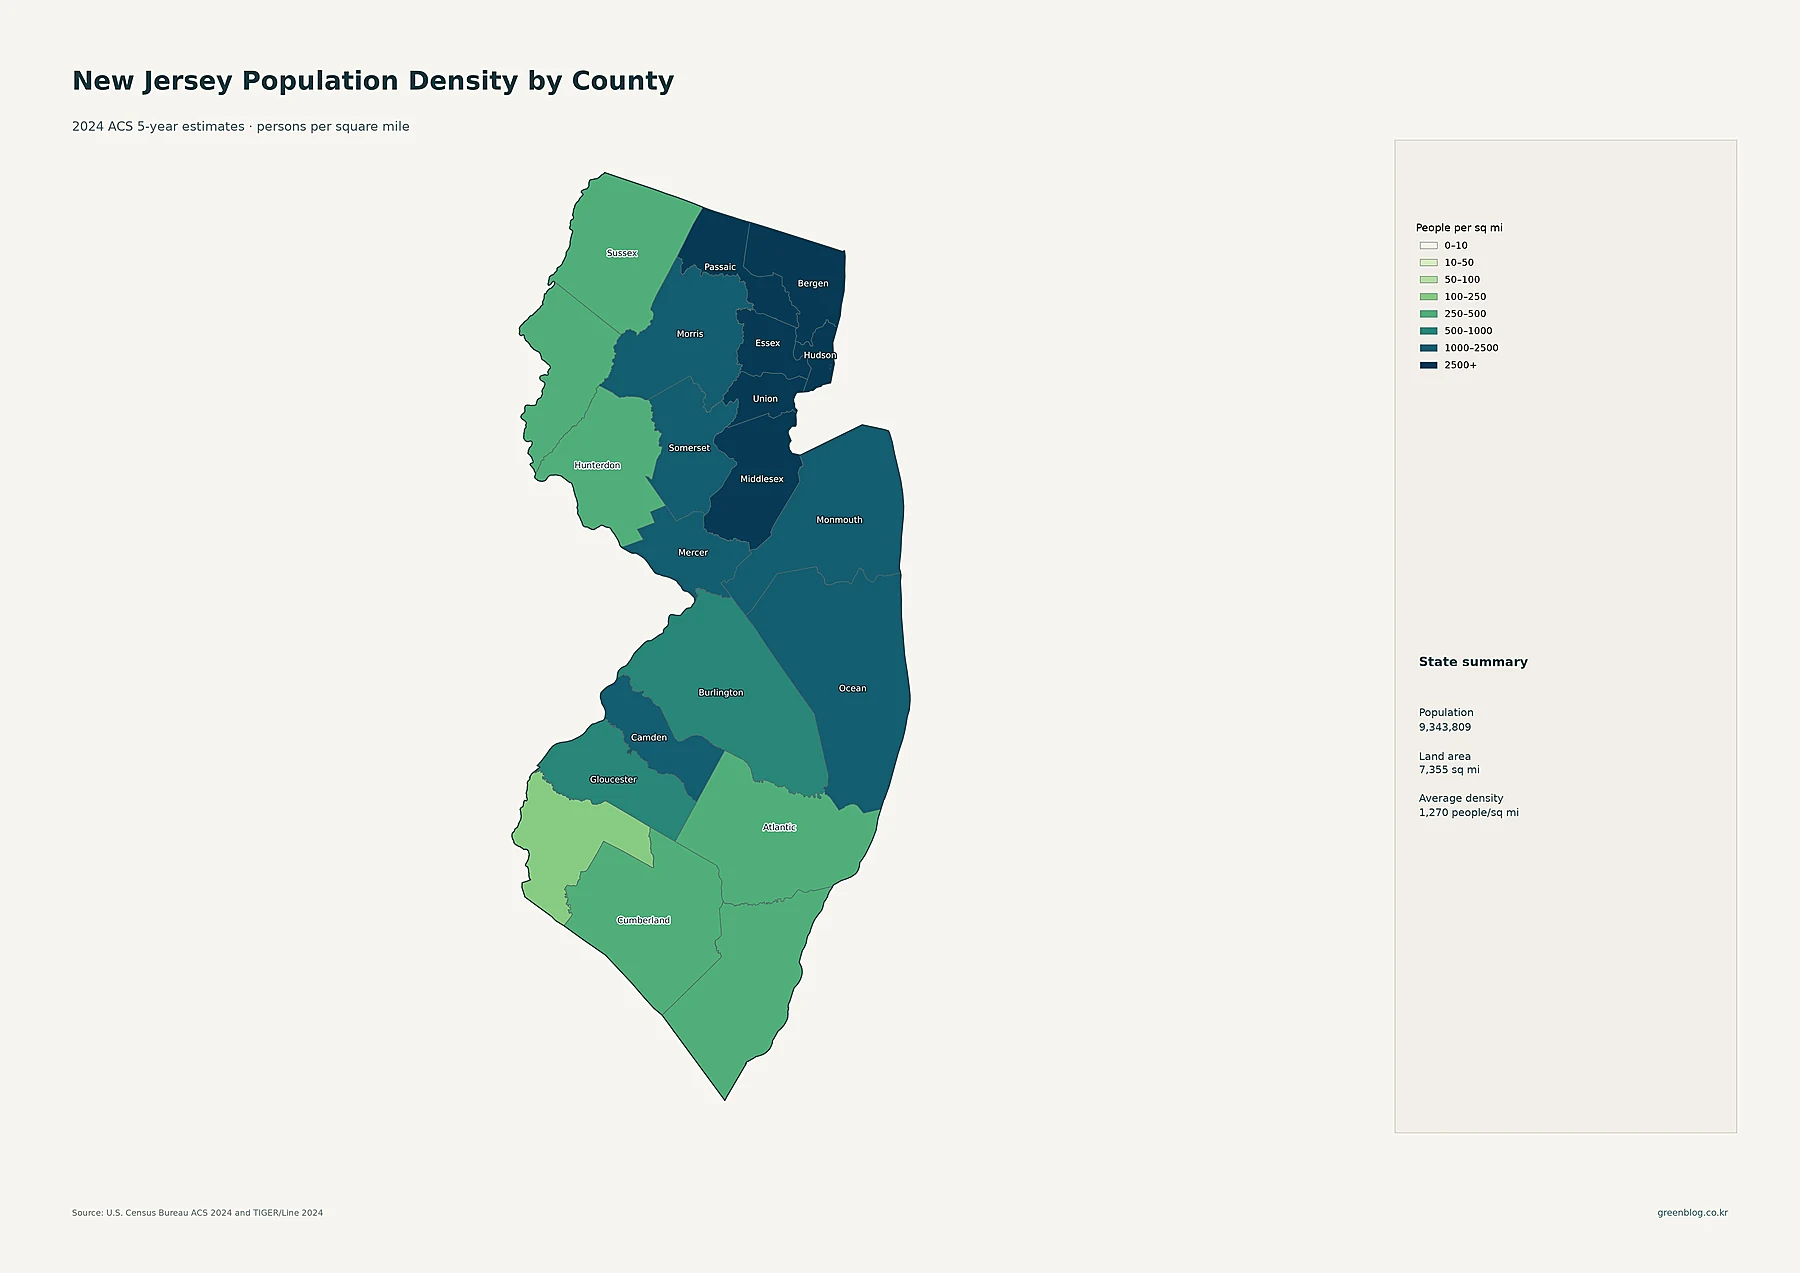
Hudson County has the highest average density in the supplied county data at about 15,550.6 people per square mile. Essex follows at about 6,844.7, Union at 5,636.9, and Bergen at 4,133.8. Middlesex averages about 2,817.4 and Passaic about 2,799.2, while Camden is about 2,381.9. The darkest county classes therefore occupy much of the northeastern urban belt, with Camden forming another high-density area in the southwest.
Mercer County averages about 1,718.9 people per square mile, Monmouth 1,378.4, Somerset 1,158.9, Morris 1,116.1, and Ocean 1,041.5. The lowest county averages are much smaller: Salem is about 196.7, Sussex 281.2, Hunterdon 304.2, and Warren 310.9 people per square mile. New Jersey’s statewide average is high, but the internal spread is enormous. Hudson’s county average is dozens of times higher than Salem’s, and tract-level differences within counties are sharper still.
| Measure | Leading area | Value in supplied data |
|---|---|---|
| State population | New Jersey | 9,343,809 |
| Largest county population | Bergen County | 962,316 |
| Highest county density | Hudson County | about 15,550.6/sq mi |
| Fastest 2010–2020 growth | Hudson County | +14.3% |
| Largest 2010–2020 decline | Sussex County | -3.4% |
Hudson, Ocean, and Essex posted double-digit growth during the 2010s
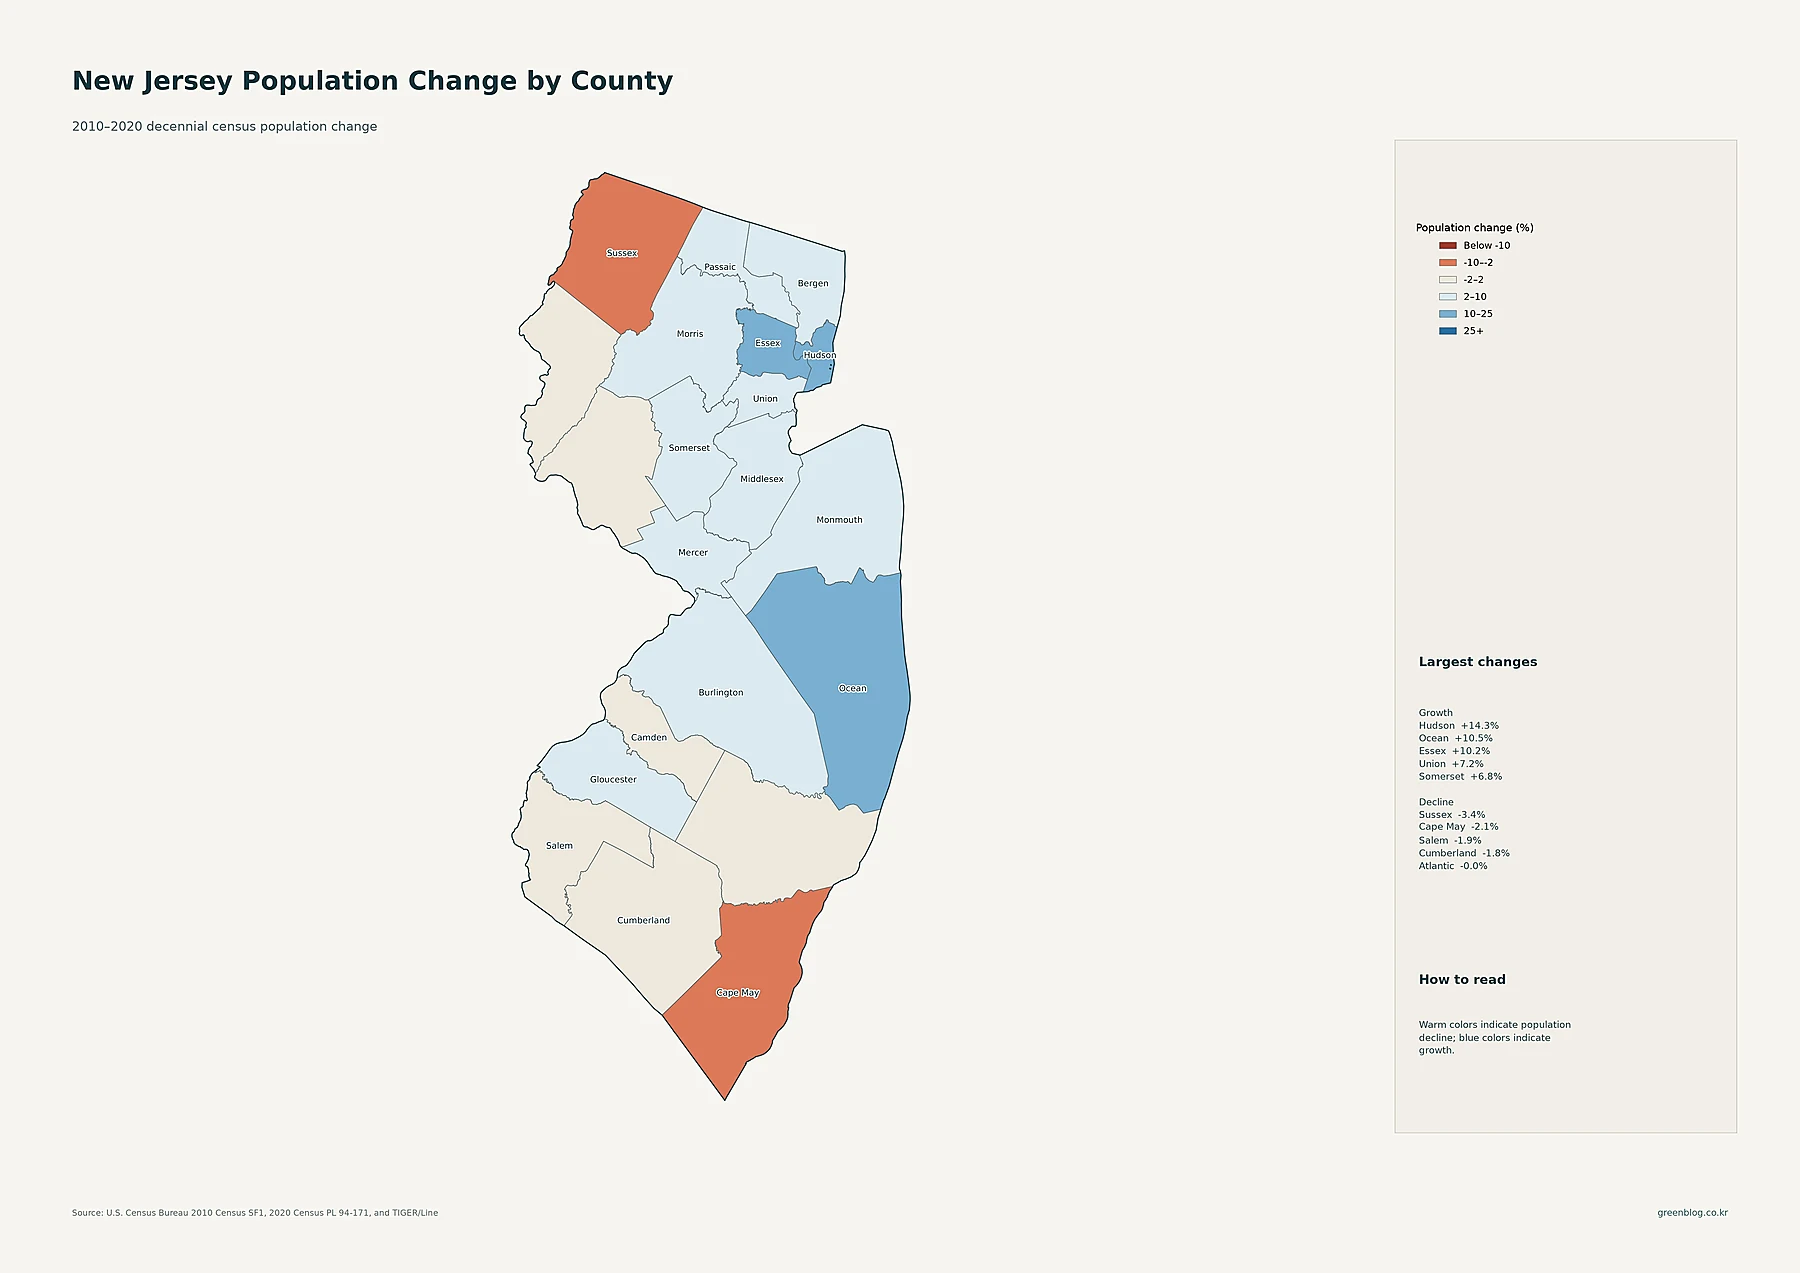
Hudson County recorded the fastest percentage growth in the supplied decade data, rising from 634,266 residents in 2010 to 724,854 in 2020, or about 14.3%. Ocean County increased from 576,567 to 637,229, a gain of about 10.5%, while Essex County rose from 783,969 to 863,728, or about 10.2%. Union grew 7.2%, Somerset 6.8%, Middlesex 6.6%, Mercer 5.7%, and Bergen 5.6%. The county with the largest current population is therefore not the county with the fastest growth rate.
Several counties declined over the same period. Sussex fell from 149,265 residents in 2010 to 144,221 in 2020, a decrease of about 3.4%, the largest percentage decline in the supplied data. Cape May declined about 2.1%, Salem 1.9%, and Cumberland 1.8%. Atlantic was essentially flat at roughly -0.01%. The warm colors on the change map are concentrated in the northwest and parts of the far south, while Hudson, Ocean, and Essex stand out in stronger growth shades. These are 2010–2020 decennial-census comparisons and should not be described as 2024 changes.
New Jersey’s defining pattern is extreme northeast density layered over a broader network of population centers
Taken together, the maps show why one number cannot summarize New Jersey’s population geography. Bergen contains the most residents among counties, but Hudson has the highest county-average density and the fastest 2010–2020 percentage growth. Newark is the largest census place in the supplied 2024 ACS data, yet Jersey City is nearly as large, and the tract map shows that both are part of a larger northeastern concentration extending across multiple county and municipal boundaries.
Other parts of the state remain important to the overall pattern. Ocean and Monmouth carry large county totals along the central coast. Trenton, Camden, Toms River, Lakewood, and Vineland form recognizable population centers outside the northeastern core. The northwest and parts of the southern interior are much less dense at both county and tract scales. The most accurate way to read New Jersey is therefore to keep four measures separate: place totals, county totals, density, and historical population change. Each map contributes a different piece of the same settlement pattern.
Download the New Jersey population map collection
The ZIP includes detailed census-tract density, major cities and urban areas, county population totals, 2010–2020 county population change, and county population density.
FAQ
Which New Jersey county has the largest population?
Bergen County is the largest in the supplied 2024 ACS 5-year estimates, with 962,316 residents. Middlesex County has 871,290 and Essex County 863,002.
Which New Jersey county has the highest population density?
Hudson County has the highest county-average density at about 15,550.6 people per square mile. Essex is about 6,844.7 and Union about 5,636.9. The census-tract map reveals even finer differences within those county averages.
Which New Jersey county grew fastest from 2010 to 2020?
Hudson County grew about 14.3%, from 634,266 residents in 2010 to 724,854 in 2020. Ocean grew about 10.5% and Essex about 10.2%. These percentages compare the 2010 and 2020 decennial censuses, not the 2024 ACS estimate.
Related Maps
Sources
- U.S. Census Bureau — American Community Survey (ACS): 2024 5-year population and density estimates
- U.S. Census Bureau — TIGER/Line Shapefiles: 2024 state, county, census tract, place geography and mapped boundaries
- U.S. Census Bureau — Decennial Census: 2010 and 2020 county population comparison
Green Map creates custom-edited map images using open geographic data sources such as geoBoundaries, Natural Earth, OpenStreetMap, and government open data.
These maps are edited visual materials, not raw data files, and are provided for education, documents, presentations, and graphic reference.