New Hampshire’s population is not spread evenly from the Massachusetts border to the Canadian border. The supplied 2024 ACS 5-year data report 1,394,868 residents statewide and the county-density map lists about 8,954 square miles of land, producing an average near 156 people per square mile. That average hides the strongest pattern in the maps: population is much more concentrated across the southern and southeastern counties, while the far north remains broadly sparse. Manchester and Nashua anchor the largest cluster, with additional concentrations around Concord, the Seacoast, Dover, Rochester, and several smaller centers.
The five maps answer different questions and should not be treated as interchangeable. Census-tract density shows where people are packed into relatively small areas. The place map compares the total populations of named census places. The county-circle map compares county totals, while the county choropleth averages population over each county’s land area. The 2010–2020 map is historical change, not a 2024 estimate. Hillsborough County leads both current county population and average density, but Rockingham County posted the fastest percentage growth during the 2010s.
Table of Contents
The tract map reveals a continuous southern concentration that county averages only partly show
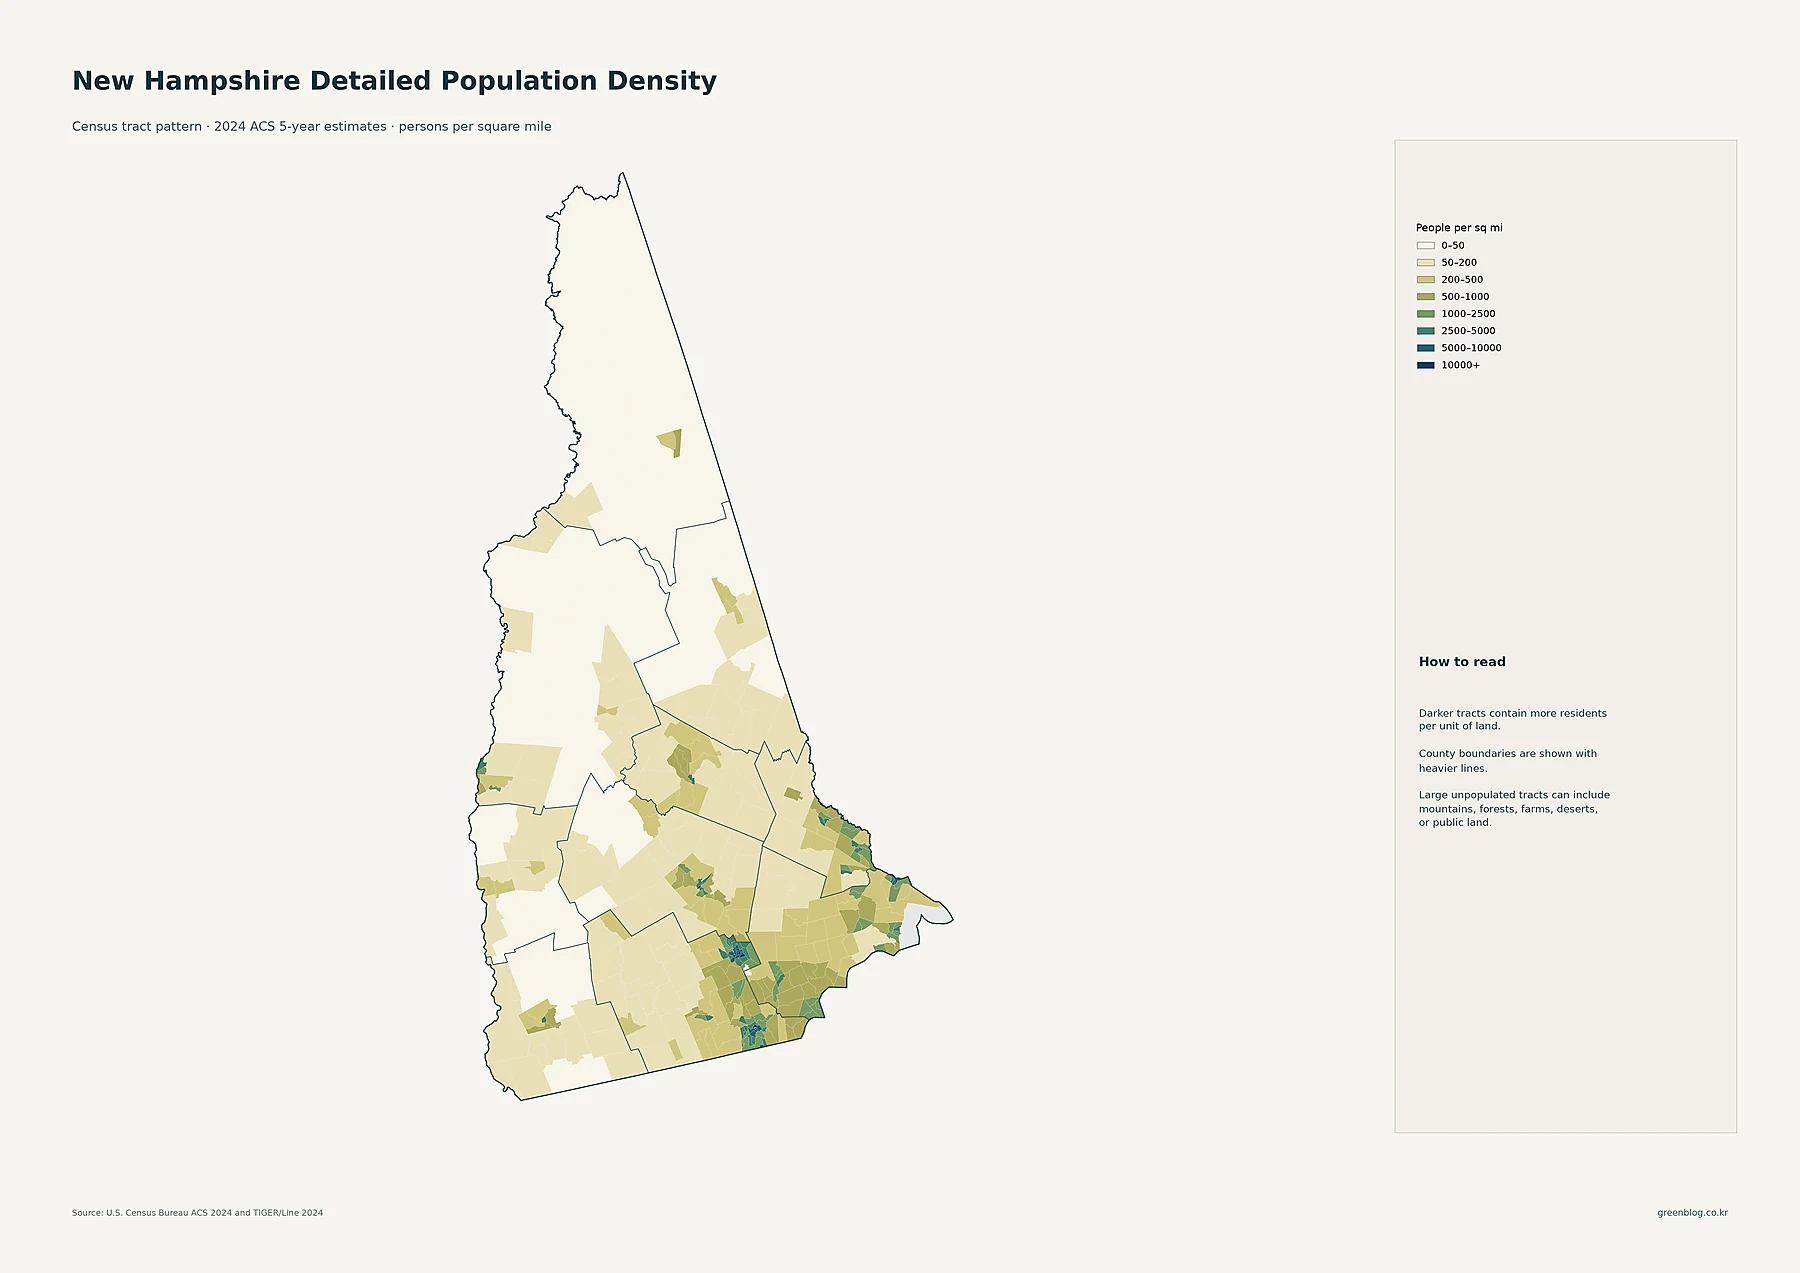
The darkest and most continuous tract-level pattern appears in southern New Hampshire. Hillsborough County contains dense tracts around Manchester and Nashua, and the concentration extends eastward through communities in Rockingham County. Derry, Londonderry, Exeter, Hampton, and Portsmouth sit within a broader southeastern belt where many tracts fall into higher density classes than most of the state. Strafford County adds another cluster around Dover, Rochester, Somersworth, and nearby places. These areas appear as a chain of settlement rather than isolated dots.
Other centers are visible but more separated. Concord creates a distinct concentration in Merrimack County. Laconia stands out farther north, while Lebanon and Hanover form a small western cluster and Keene anchors the southwest. In Coos County, Berlin appears as a localized settlement, but most of the far north remains in the lightest 0–50 people-per-square-mile class. The tract map is therefore the best layer for seeing the sharp difference between compact town and city neighborhoods and the much larger low-density landscapes surrounding them.
Manchester and Nashua dominate the place totals, while southeastern cities form a close urban network
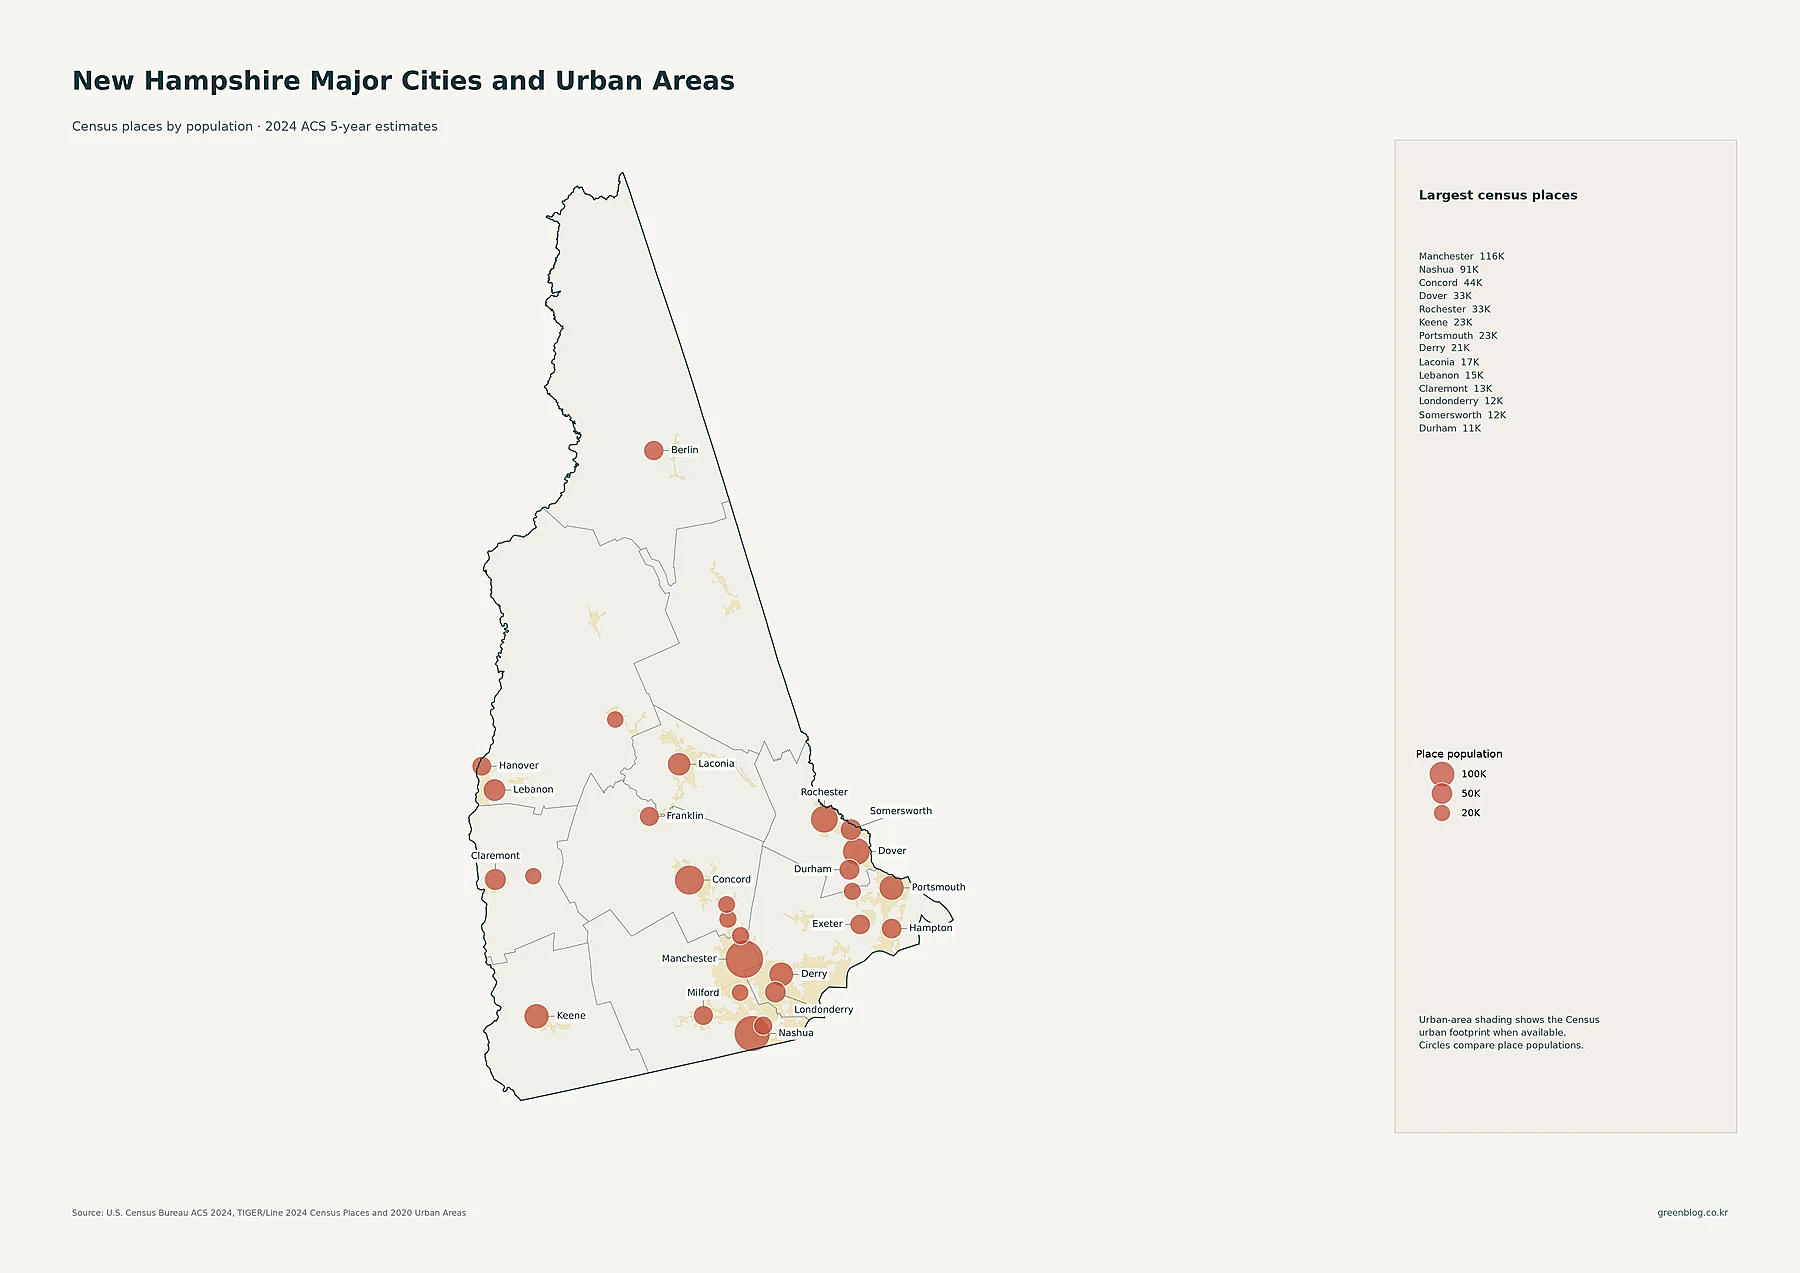
Manchester is the largest census place in the supplied data with 115,643 residents. Nashua follows with 91,294. The next tier is noticeably smaller: Concord has 44,375 residents, Dover 33,364, and Rochester 33,144. Keene has 22,939, Portsmouth 22,545, and Derry 21,339. On the map, the two largest circles sit in the south, while a series of medium and smaller circles runs through the southeast toward the Seacoast.
The rest of the state has smaller, more widely spaced centers. Laconia has 17,085 residents, Lebanon 14,999, Claremont 13,078, Somersworth 12,111, Durham 10,681, and Hampton 10,101. Berlin, the main labeled place in the far north, has 9,383. These circles represent total place population, not density. A place can have a larger population simply because it covers more developed land, so the circle sizes should be read alongside the tract-density layer rather than used as a substitute for it.
Hillsborough and Rockingham account for the two largest county populations by a wide margin
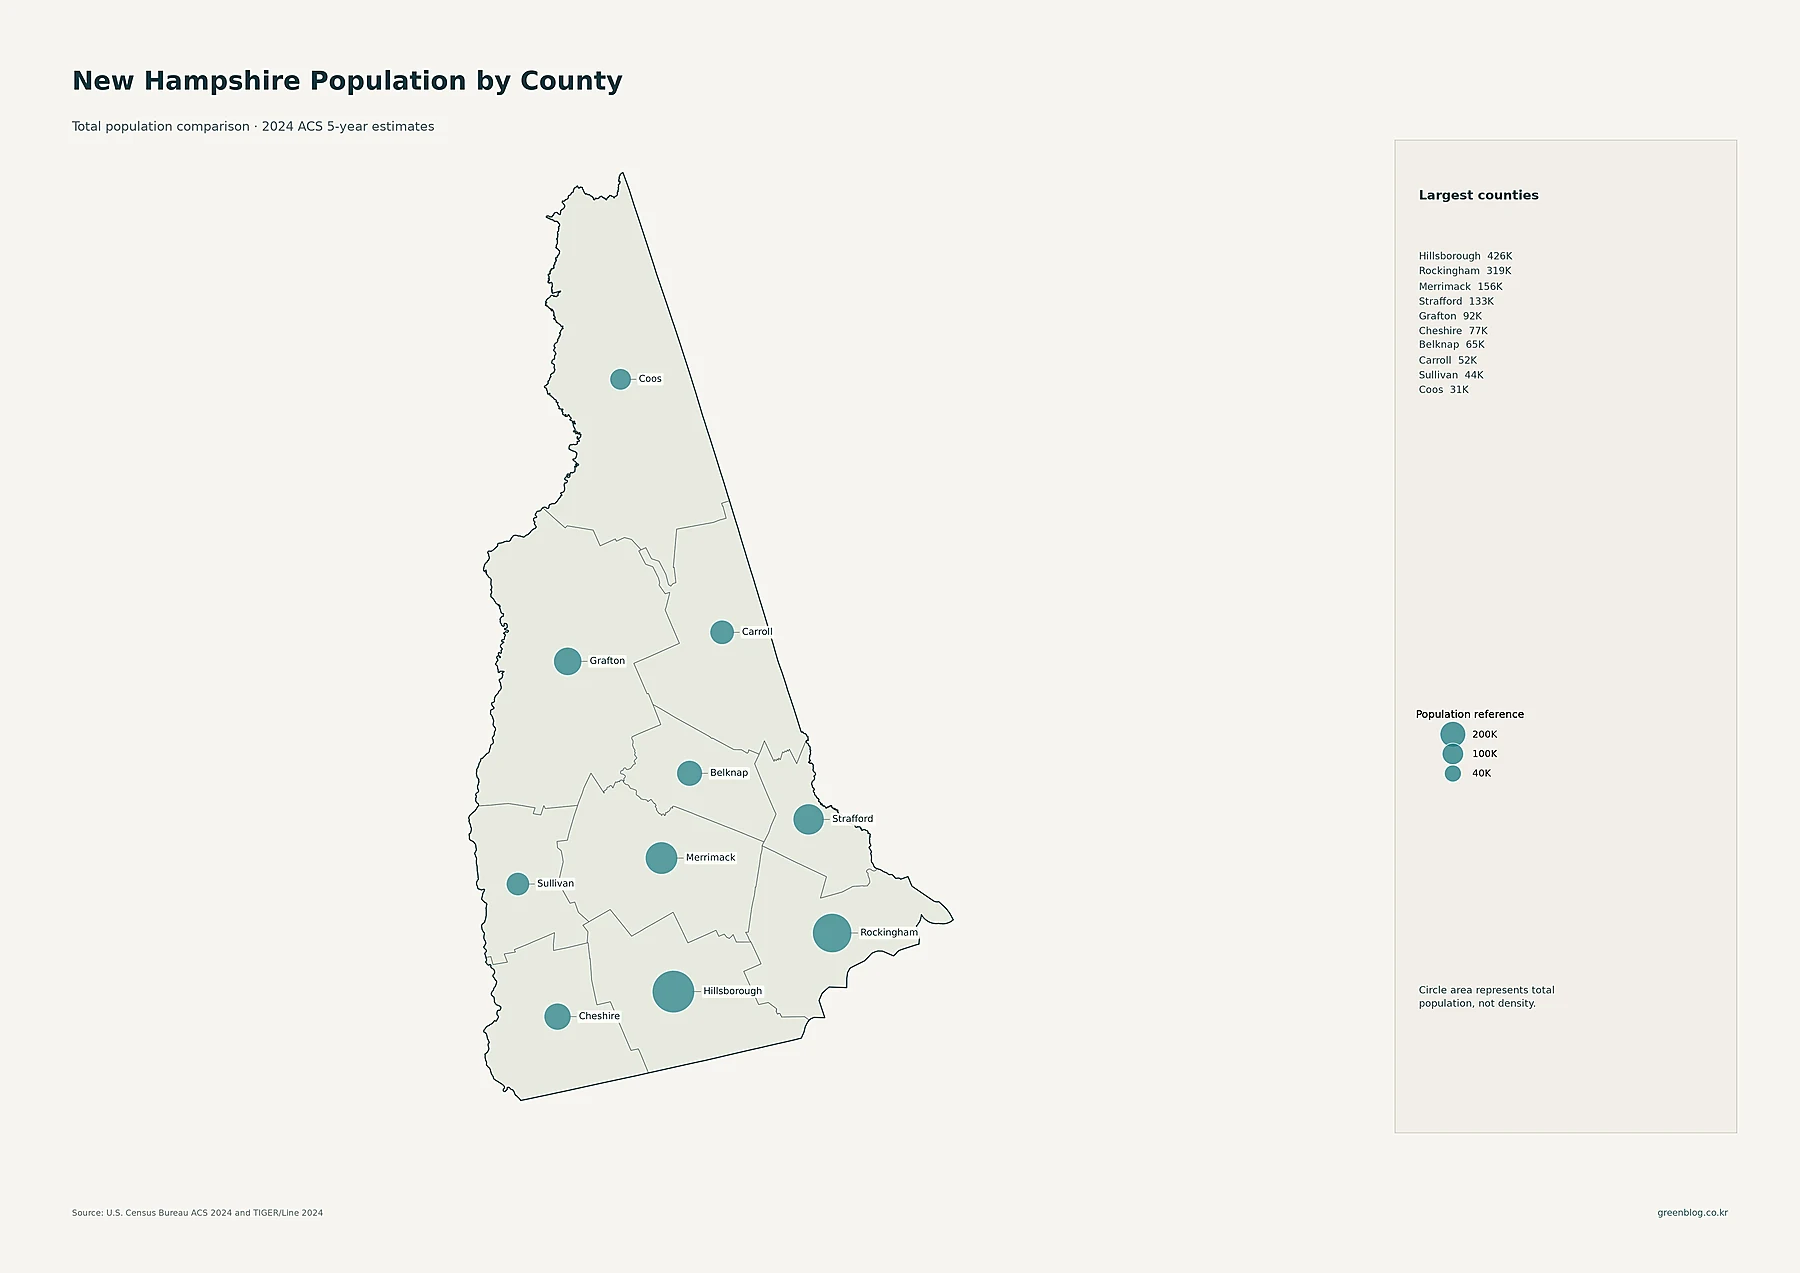
Hillsborough County has 426,378 residents in the supplied 2024 ACS data, the highest county total in New Hampshire. Rockingham County is second with 319,082. Merrimack County has 155,967 residents and Strafford County 132,575. Those four counties form the largest symbols on the map and reinforce the strong southern and southeastern population pattern visible in the tract layer.
The remaining county totals are smaller: Grafton has 92,120 residents, Cheshire 77,297, Belknap 64,659, Carroll 51,804, Sullivan 43,715, and Coos 31,271. Coos occupies a large share of northern New Hampshire on the map yet has the smallest county population. This contrast is a useful reminder that geographic area and population are separate measures. The proportional circles answer how many residents a county contains; the next map asks how many residents live within each square mile on average.
County density peaks in Hillsborough and Rockingham, then drops sharply toward the north
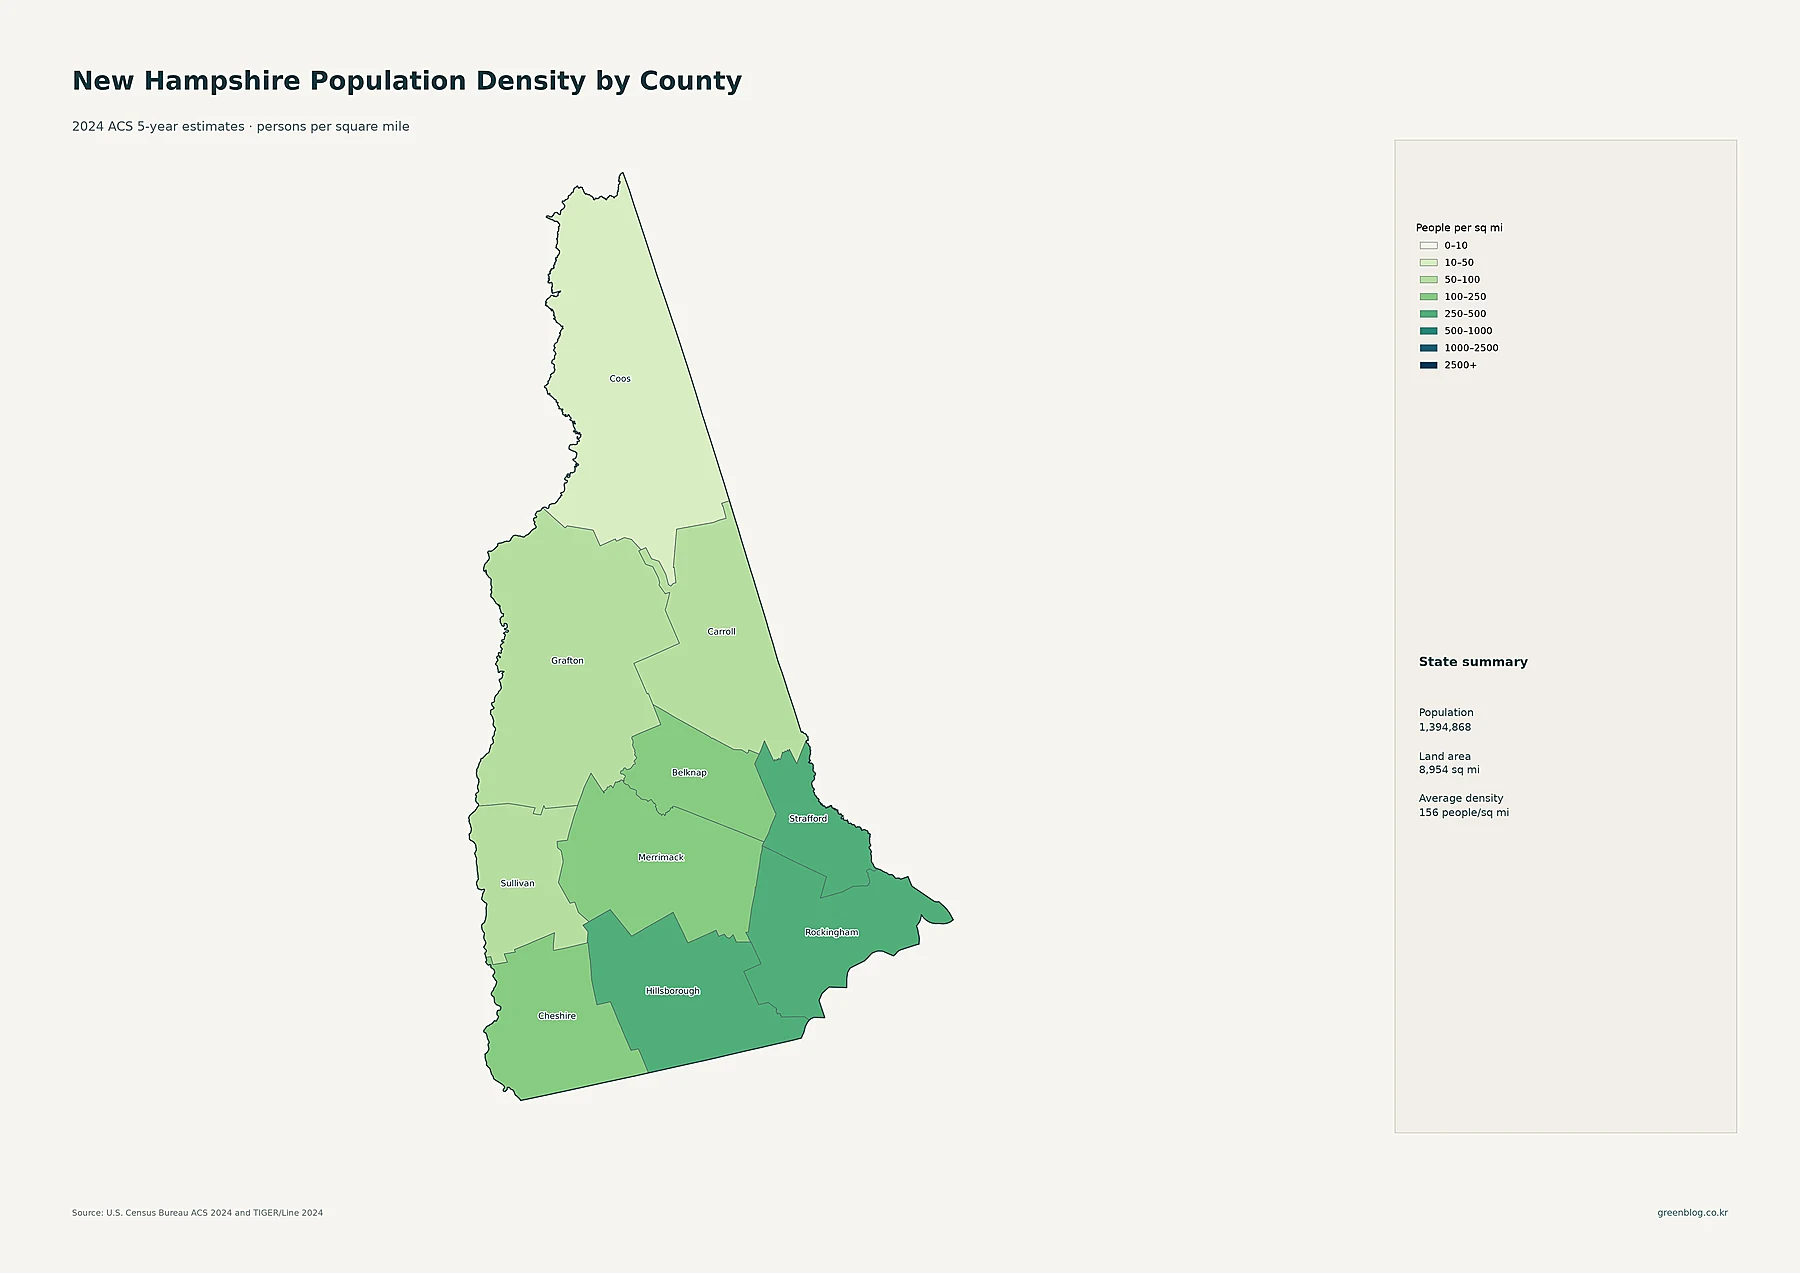
Hillsborough County has the highest county-average density at about 486.4 people per square mile. Rockingham is close behind at about 458.8, and Strafford averages about 360.8. Merrimack is about 167.2 and Belknap about 160.9, both near or slightly above the statewide average shown on the map. Cheshire averages about 109.4 and Sullivan about 81.3 people per square mile. The county layer therefore shows a clear density gradient from the southern metropolitan and Seacoast counties toward the interior and north.
Carroll County averages about 55.6 people per square mile and Grafton about 53.9. Coos is by far the sparsest at roughly 17.4 people per square mile. That low value fits the broad pale northern area visible on both the county and tract maps. County averages, however, smooth over local settlements. Berlin still appears as a distinct place on the city map, just as denser tracts appear around smaller centers elsewhere. The county-density map is most useful for regional contrast; the tract map supplies the local detail.
| Measure | Leading area | Value in supplied data |
|---|---|---|
| State population | New Hampshire | 1,394,868 |
| Largest county population | Hillsborough County | 426,378 |
| Highest county density | Hillsborough County | about 486.4/sq mi |
| Fastest 2010–2020 growth | Rockingham County | +6.4% |
| Largest 2010–2020 decline | Coos County | -5.4% |
Rockingham grew fastest during the 2010s, while Coos recorded the largest decline
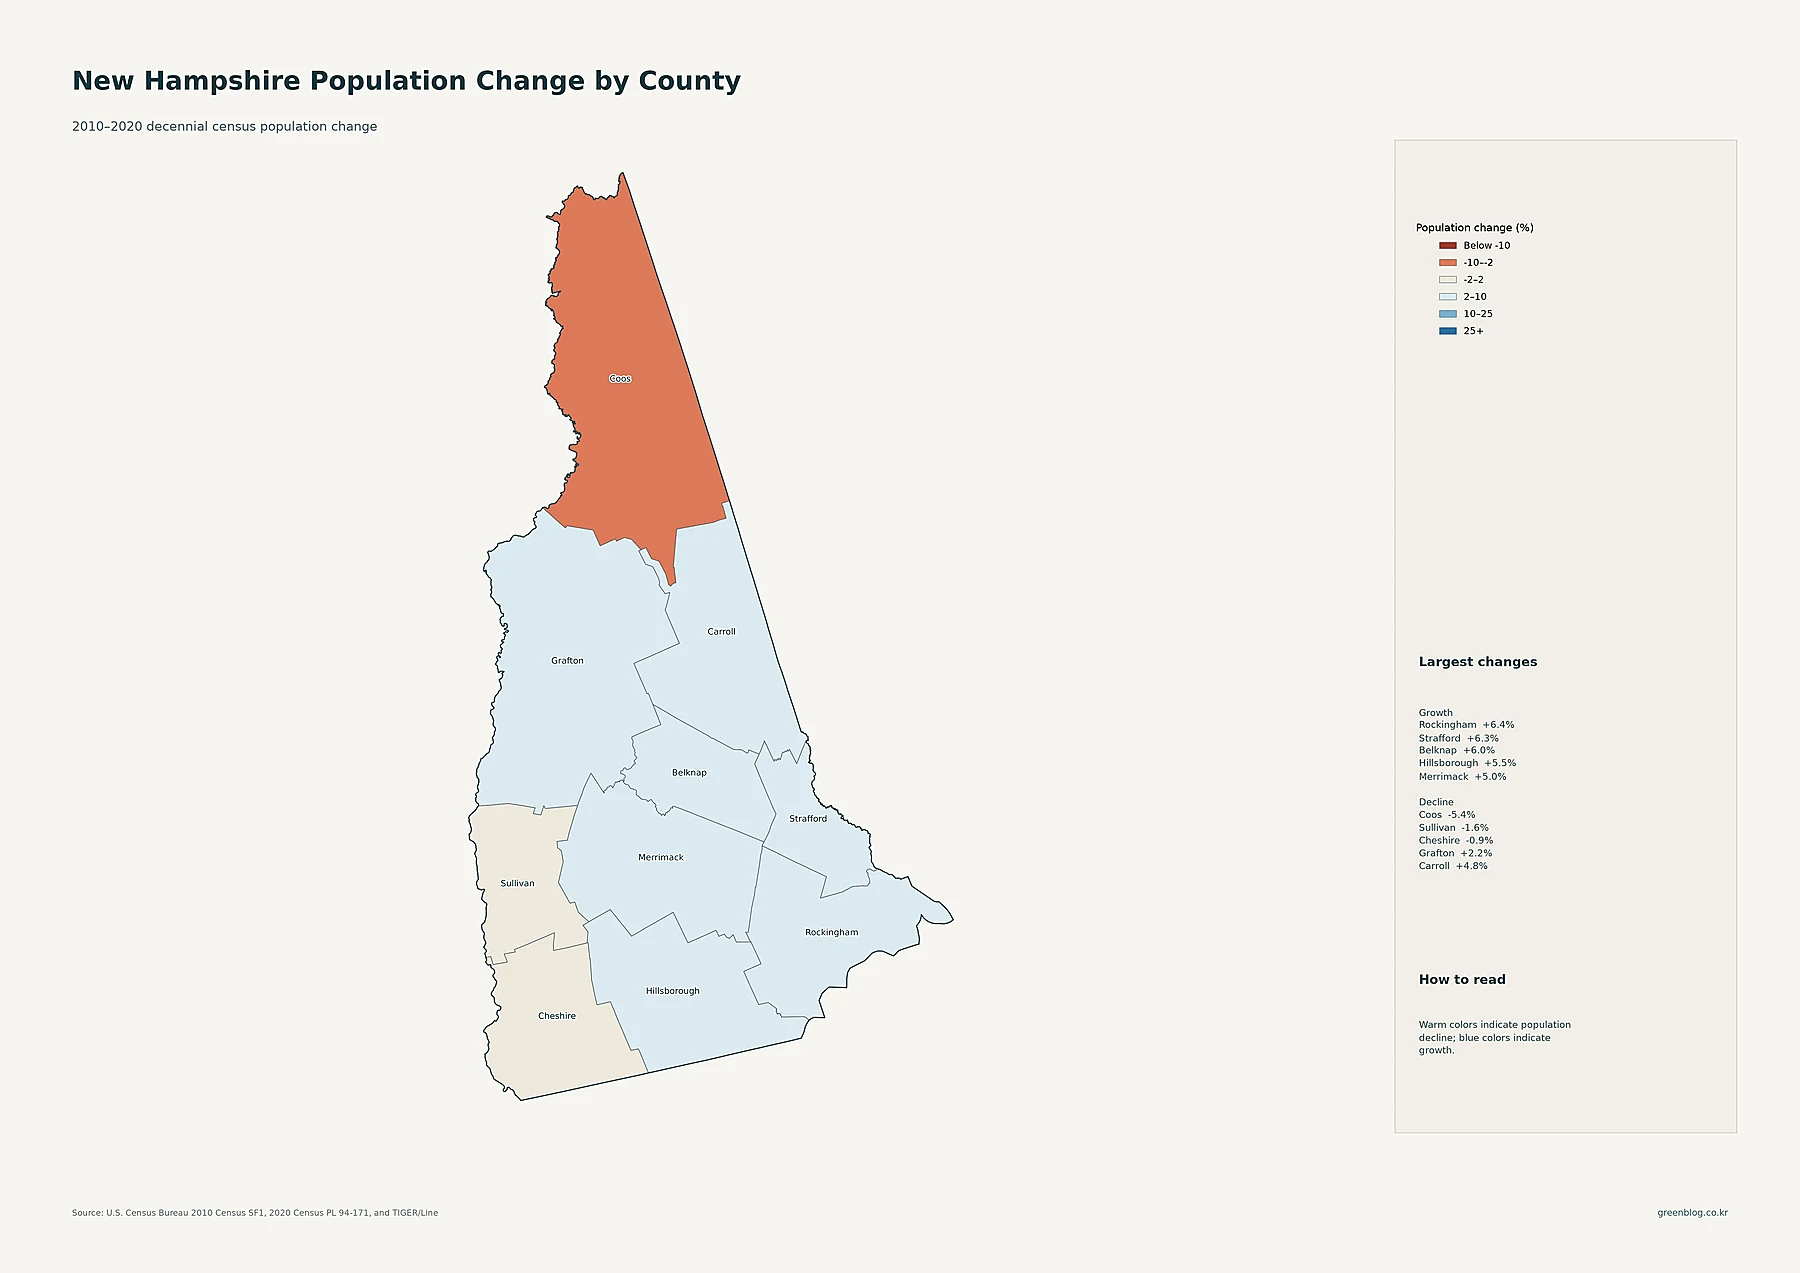
Rockingham County had the highest percentage growth in the supplied decade data, increasing from 295,223 residents in 2010 to 314,176 in 2020, or about 6.4%. Strafford grew 6.3%, Belknap 6.0%, Hillsborough 5.5%, and Merrimack 5.0%. Carroll increased 4.8% and Grafton 2.2%. These figures show that several southern, southeastern, and central counties gained population during the decade, but the fastest rate belonged to Rockingham rather than Hillsborough, even though Hillsborough remains larger in current population.
Three counties declined. Coos fell from 33,055 residents in 2010 to 31,268 in 2020, a decrease of about 5.4%. Sullivan declined about 1.6% and Cheshire about 0.9%. The change map makes the north-south contrast especially easy to see because Coos is colored for decline while most counties farther south are shaded for growth. These percentages come from the 2010 and 2020 decennial censuses and should not be read as 2024 changes; the current population and density maps use the later ACS estimate.
New Hampshire’s population geography is defined by a dense southern network and a much sparser north
Viewed together, the maps show a compact but strongly uneven settlement pattern. Hillsborough contains the state’s two largest census places, Manchester and Nashua, and also ranks first in both county population and average density. Rockingham adds the second-largest county population, nearly the same county-average density as Hillsborough, and the fastest 2010–2020 growth rate. Strafford continues the southeastern chain around Dover and Rochester, while Merrimack and Concord create an important central cluster.
The north presents the opposite pattern. Coos has the smallest county population, the lowest county-average density, and the largest percentage decline during the 2010s in the supplied data. Grafton and Carroll are also much less dense than the southern counties, despite containing recognizable local centers. A single statewide average of 156 people per square mile therefore tells only part of the story. The tract, place, county-total, county-density, and change maps together reveal where New Hampshire’s population is concentrated, how large those concentrations are, and how the pattern shifted over the previous decade.
Download the New Hampshire population map collection
The ZIP includes detailed census-tract density, major cities and urban areas, county population totals, 2010–2020 county population change, and county population density.
FAQ
Which New Hampshire county has the largest population?
Hillsborough County is the largest in the supplied 2024 ACS 5-year estimates, with 426,378 residents. Rockingham County is second with 319,082.
Which New Hampshire county has the highest population density?
Hillsborough County has the highest county-average density at about 486.4 people per square mile, followed by Rockingham at about 458.8. The census-tract map shows the finer pattern within those county averages.
Which New Hampshire county grew fastest from 2010 to 2020?
Rockingham County grew about 6.4%, from 295,223 residents in 2010 to 314,176 in 2020. That percentage compares the two decennial censuses and is separate from the 2024 ACS estimates used for current population and density.
Related Maps
Sources
- U.S. Census Bureau — American Community Survey (ACS): 2024 5-year population and density estimates
- U.S. Census Bureau — TIGER/Line Shapefiles: 2024 state, county, census tract, place geography and mapped boundaries
- U.S. Census Bureau — Decennial Census: 2010 and 2020 county population comparison
Green Map creates custom-edited map images using open geographic data sources such as geoBoundaries, Natural Earth, OpenStreetMap, and government open data. These maps are edited visual materials, not raw data files, and are provided for education, documents, presentations, and graphic reference.