Nevada covers a huge area, but its residents are concentrated in a small number of urban corridors rather than spread evenly across the state. The supplied 2024 ACS 5-year estimates put the state population at 3,184,612. The county-density map reports about 109,860 square miles of land and an average density of roughly 29 people per square mile. That statewide average hides the most important feature of Nevada’s settlement pattern: dense tracts around Las Vegas and Reno sit beside enormous stretches of extremely low-density interior land.
The five layers answer different questions and should not be treated as interchangeable. The tract map shows fine-scale population density; the city map and county circles show total population; the county choropleth shows average density; and the change map compares the 2010 and 2020 decennial censuses. Clark County dominates current population totals, Carson City has the highest county-equivalent average density, and Nye County recorded the fastest percentage growth over the decade.
All five embedded WebP graphics below are site-owned data maps built from the cited U.S. Census Bureau datasets. Each figure is the visual referenced by its surrounding section, rather than a decorative cover image.
Table of Contents
Tract density reveals two major settlement clusters and a mostly sparse interior
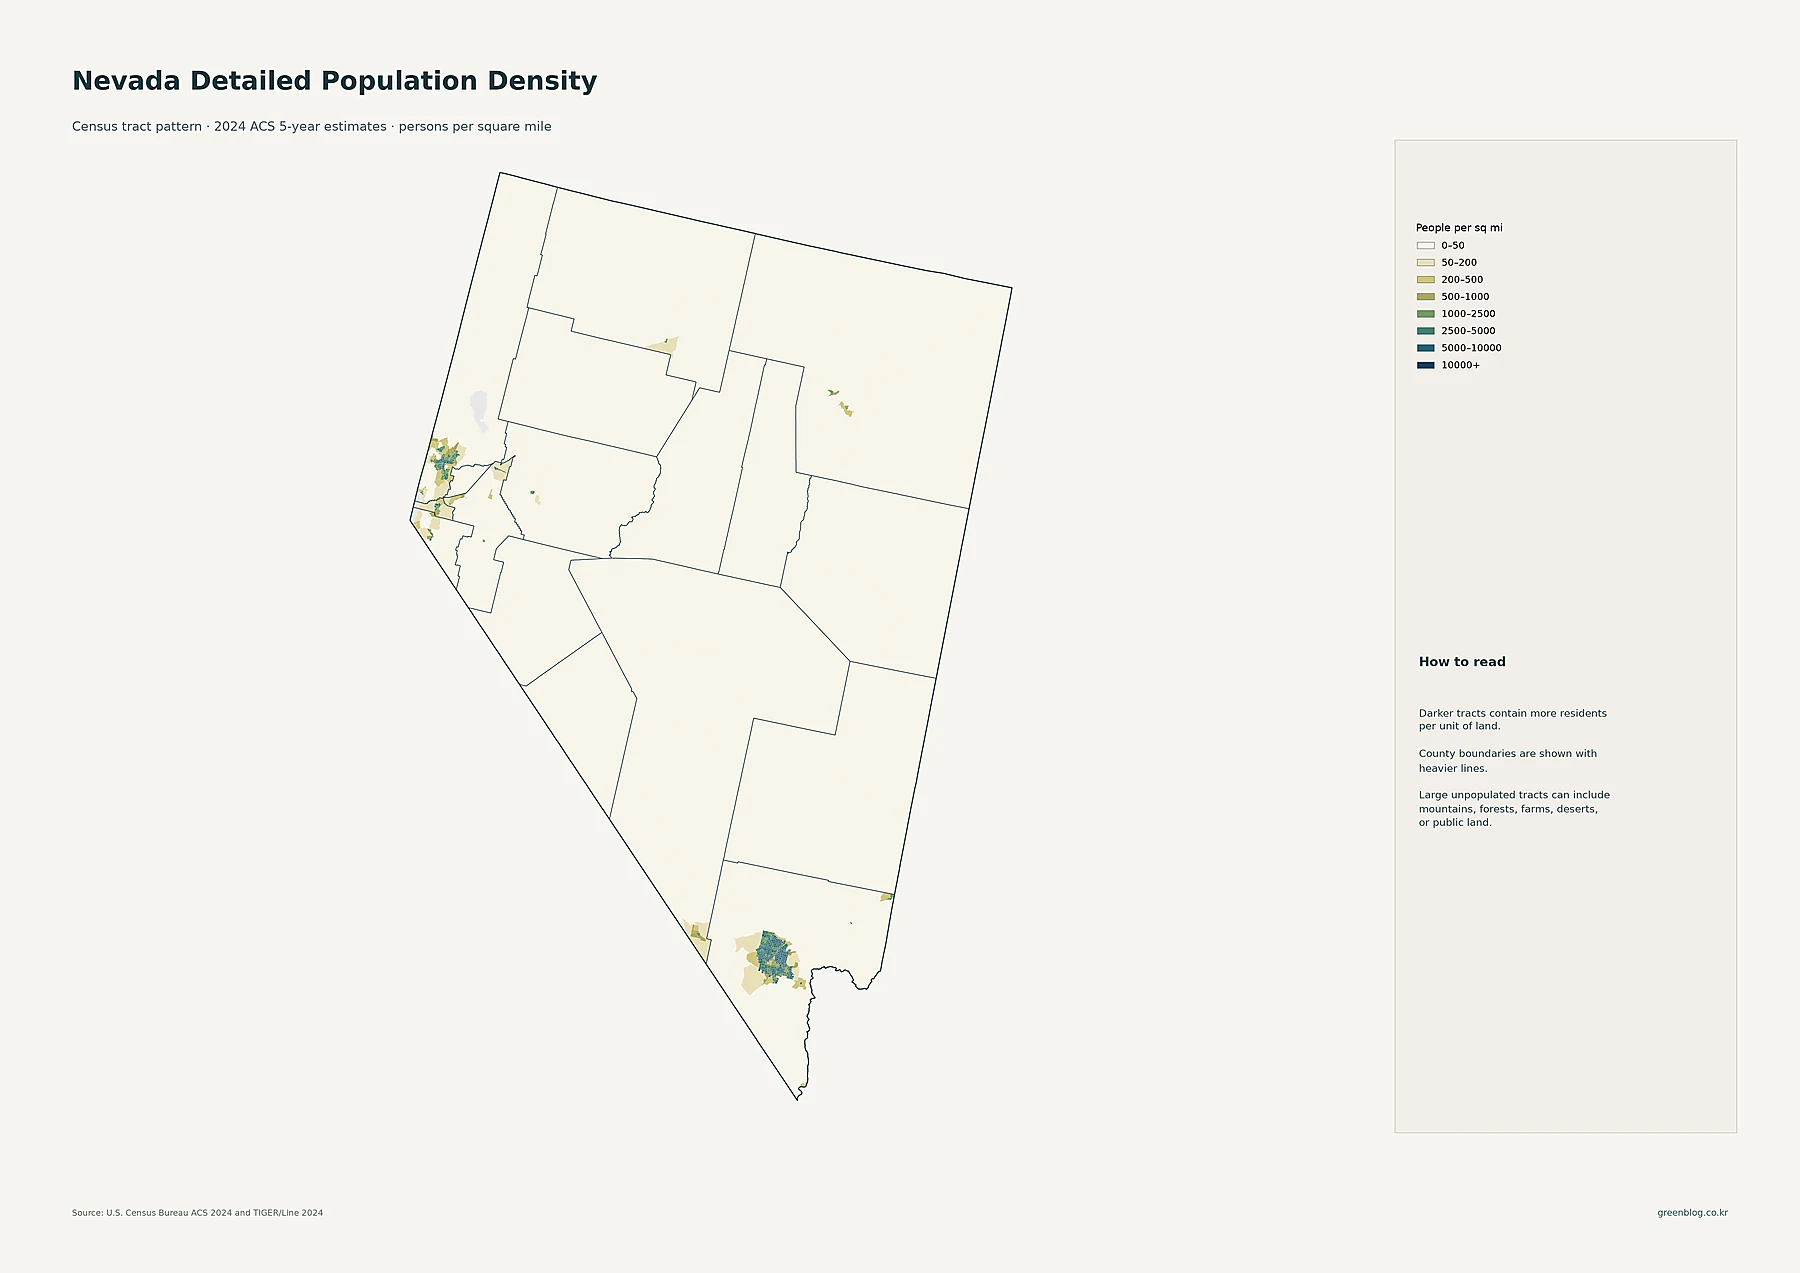
The largest continuous concentration is in the Las Vegas Valley at Nevada’s southern tip. Dense tracts spread across Las Vegas, North Las Vegas, Henderson, and the surrounding Clark County urban area, then fade quickly into much lighter classes beyond the developed valley. The second major cluster sits along the western edge around Reno and Sparks. Smaller pockets are visible around Carson City and nearby communities, giving western Nevada a distinct chain of settlement that contrasts with the much emptier center of the state.
Most central and eastern tracts fall in the lightest categories, with only small higher-density patches around places such as Elko and other local centers. The legend separates 0–50, 50–200, 200–500, 500–1,000, 1,000–2,500, 2,500–5,000, 5,000–10,000, and 10,000+ people per square mile. This is why the tract layer is so useful: a county can have a very low overall average while still containing a compact town or city that is much denser than the surrounding land.
Las Vegas leads the place ranking, while multiple large communities fill the same southern valley
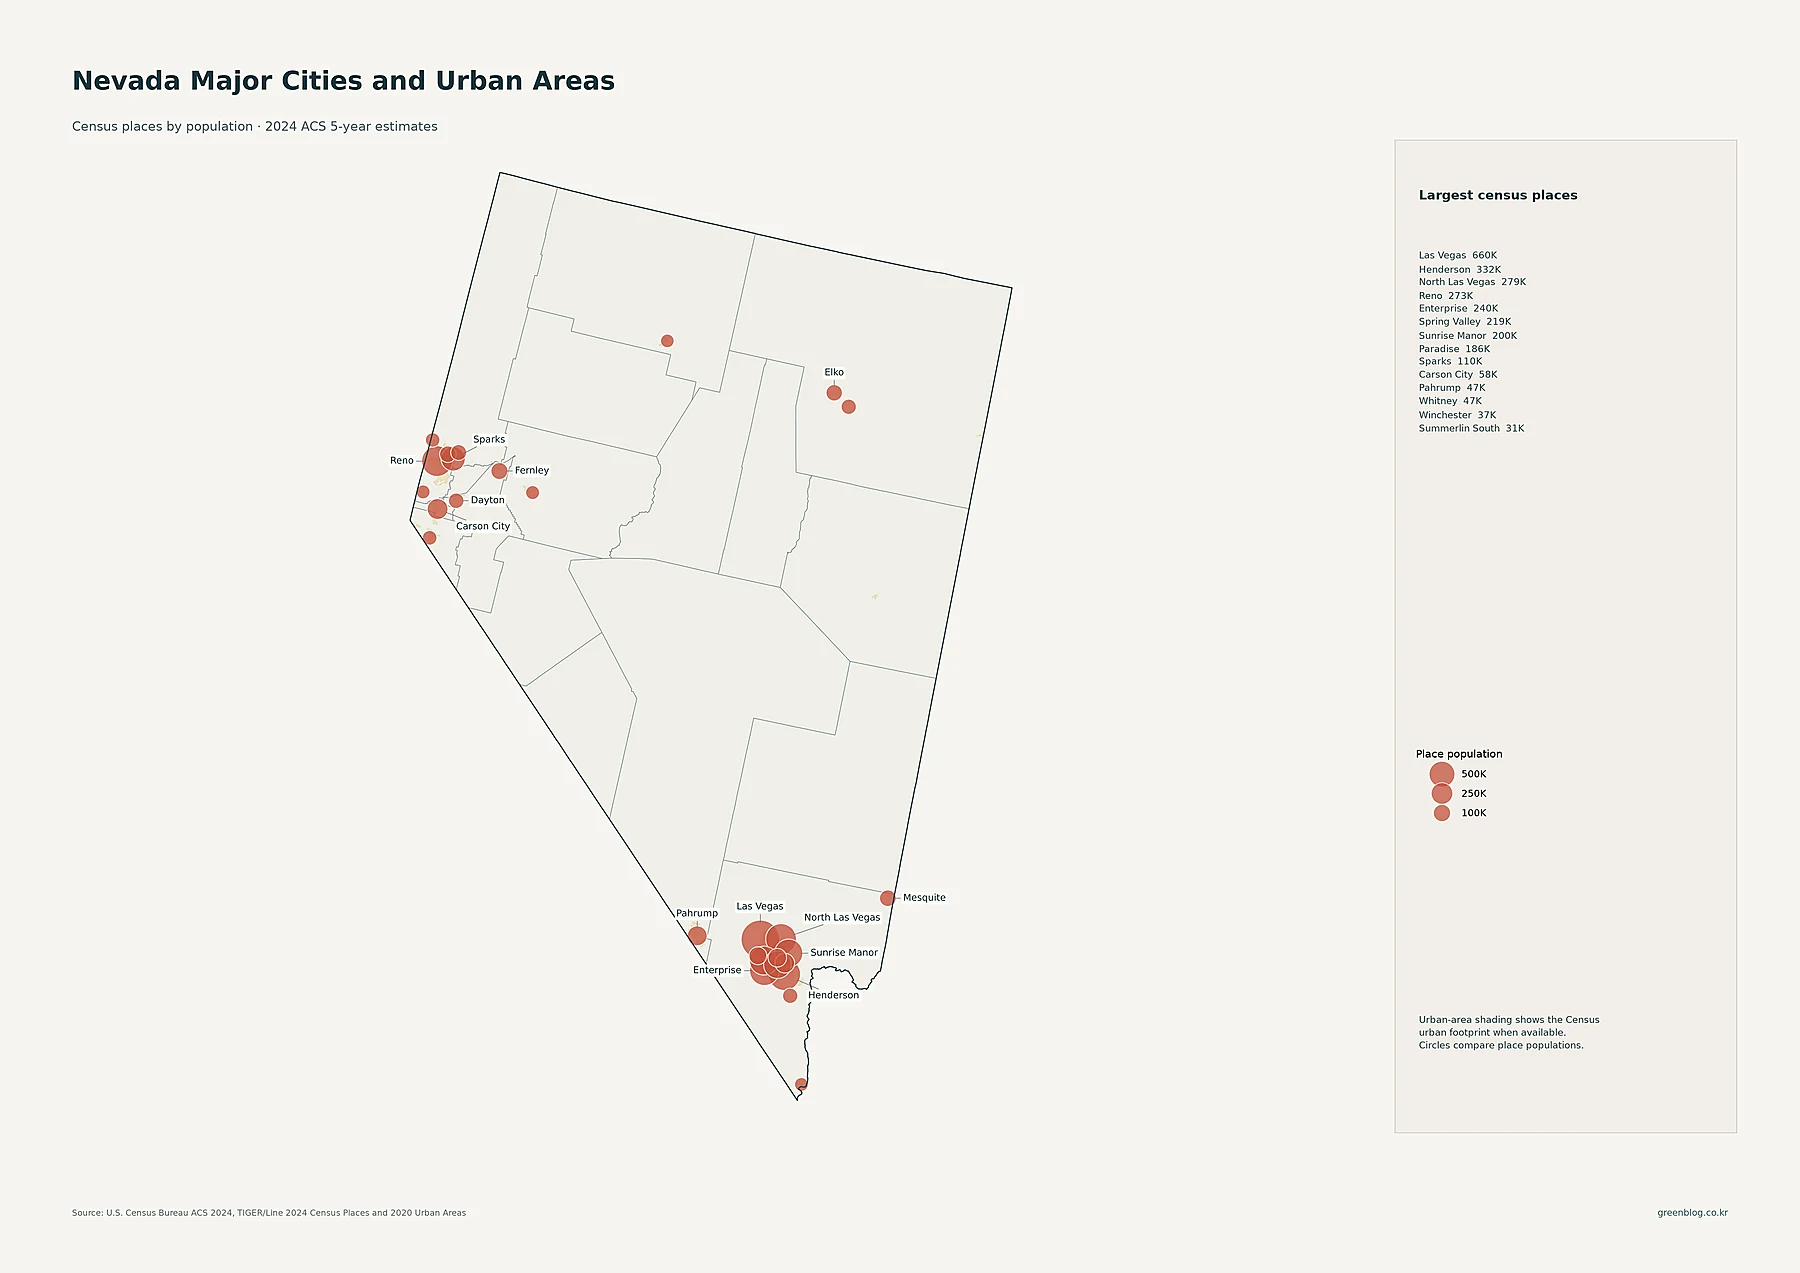
Las Vegas is the largest census place in the supplied dataset with 660,400 residents. Henderson follows with 332,141 and North Las Vegas with 278,595. Reno has 273,212 residents and is the clear anchor of northern Nevada. The southern ranking also includes Enterprise at 240,464, Spring Valley at 219,187, Sunrise Manor at 200,218, and Paradise at 185,913. Because several of these large census places sit inside the same metropolitan area, the map shows a cluster of overlapping large circles in the Las Vegas Valley rather than a single dominant point.
Sparks has 110,024 residents and reinforces the Reno-area cluster. Carson City has 58,384, Pahrump 47,347, Whitney 47,221, Winchester 37,081, and Summerlin South 31,354. The proportional circles represent total place population, not people per square mile. A large circle therefore means more residents, not necessarily greater density. Comparing these symbols with the tract layer makes it possible to separate the size of a community from how tightly its population is distributed.
Clark County holds more than 2.3 million residents and stands far above every other county total
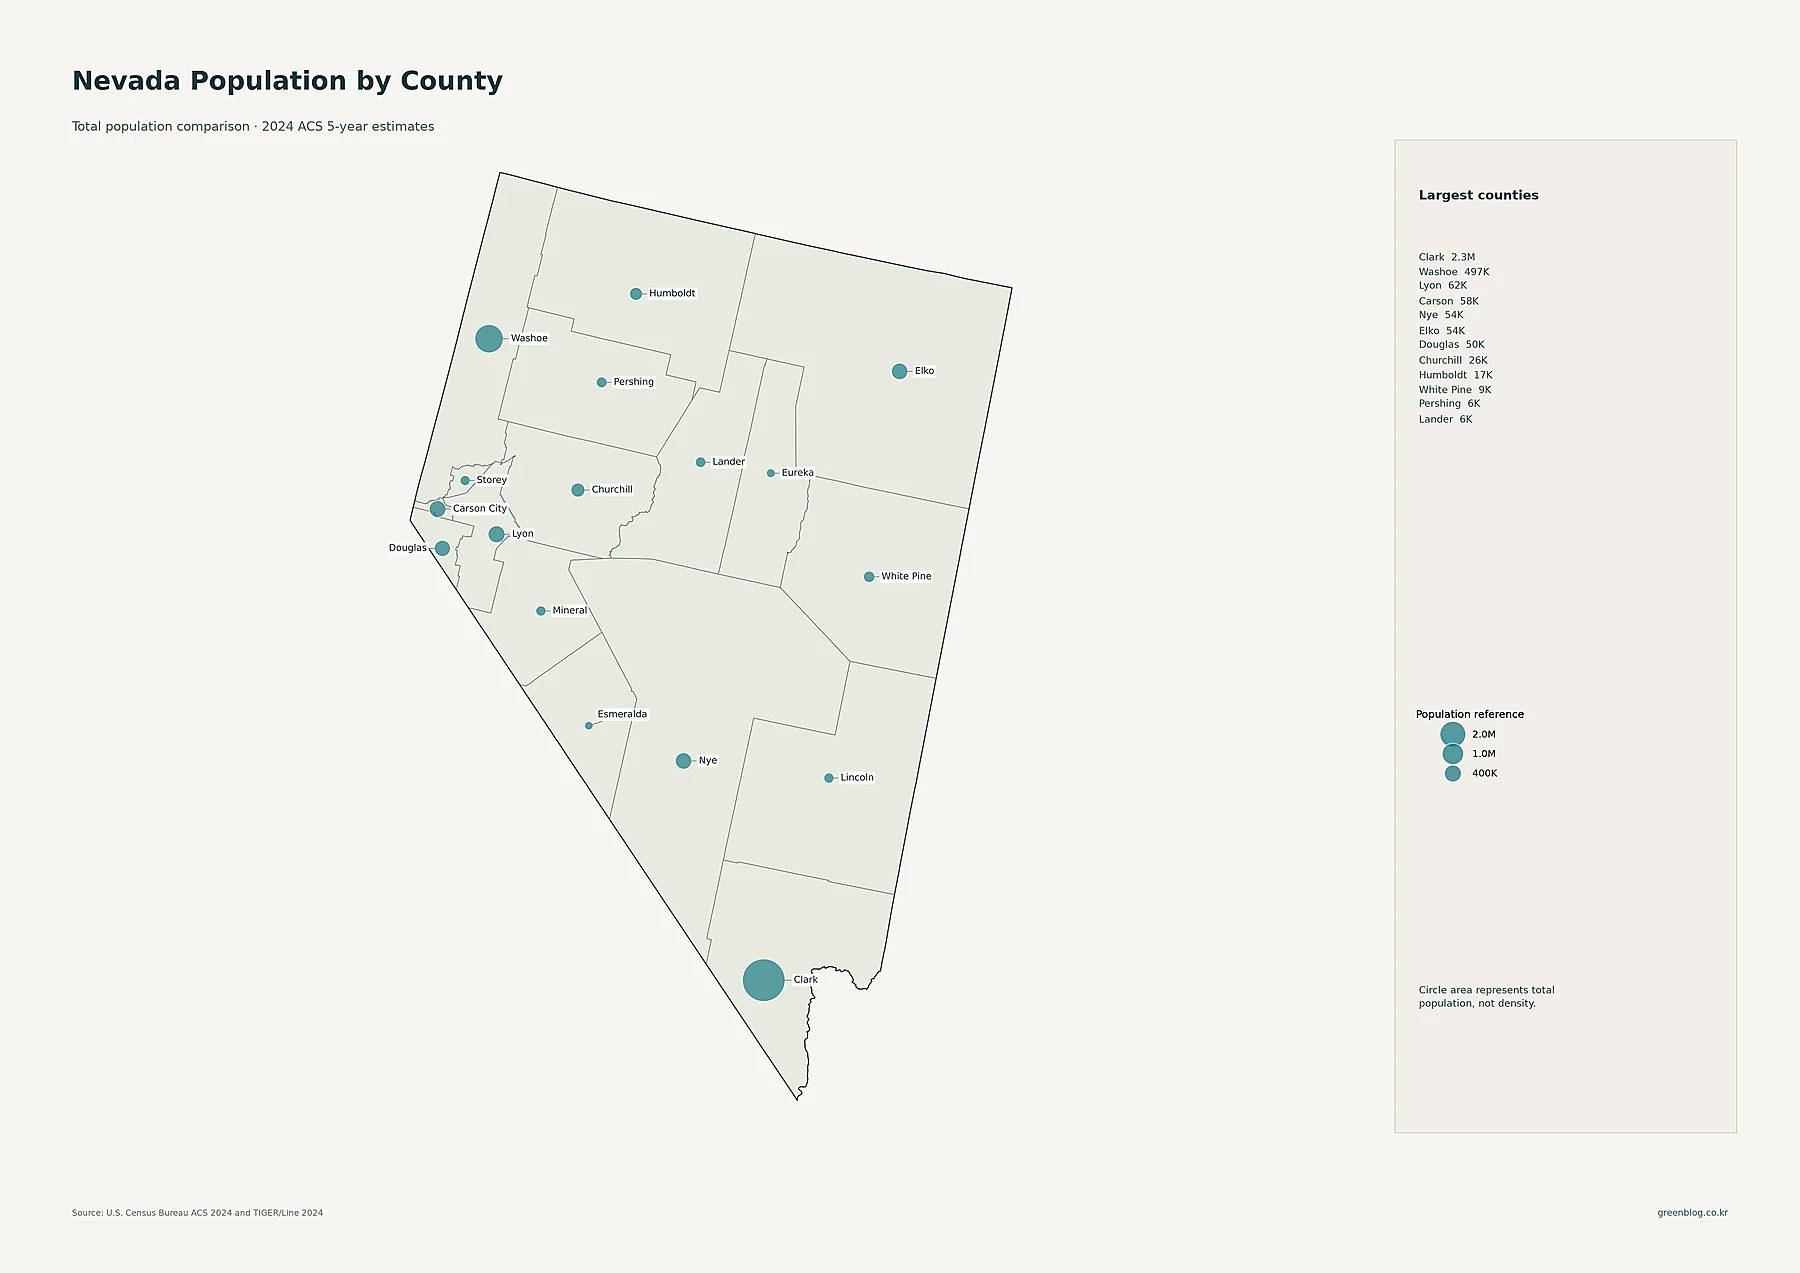
Clark County has 2,329,548 residents in the supplied 2024 ACS data, making it by far Nevada’s largest county population. Washoe County is second at 497,200. After those two, totals fall sharply: Lyon County has 61,680 residents, Carson City 58,384, Nye County 54,344, Elko County 54,047, and Douglas County 49,623. Churchill has 25,805 and Humboldt 17,289. The circle map makes this imbalance immediately visible, with Clark’s symbol much larger than any other.
Nye and Elko are especially useful examples of why physical size should not be confused with population. Both cover very large areas, yet each has only about 54,000 residents. Carson City presents the opposite case: its current population is below 60,000, but its compact county-equivalent geography produces the highest average density in the next map. Total population answers how many people live in an area; density answers how concentrated those people are relative to land area.
Carson City has the highest county-level density, ahead of Clark and Washoe
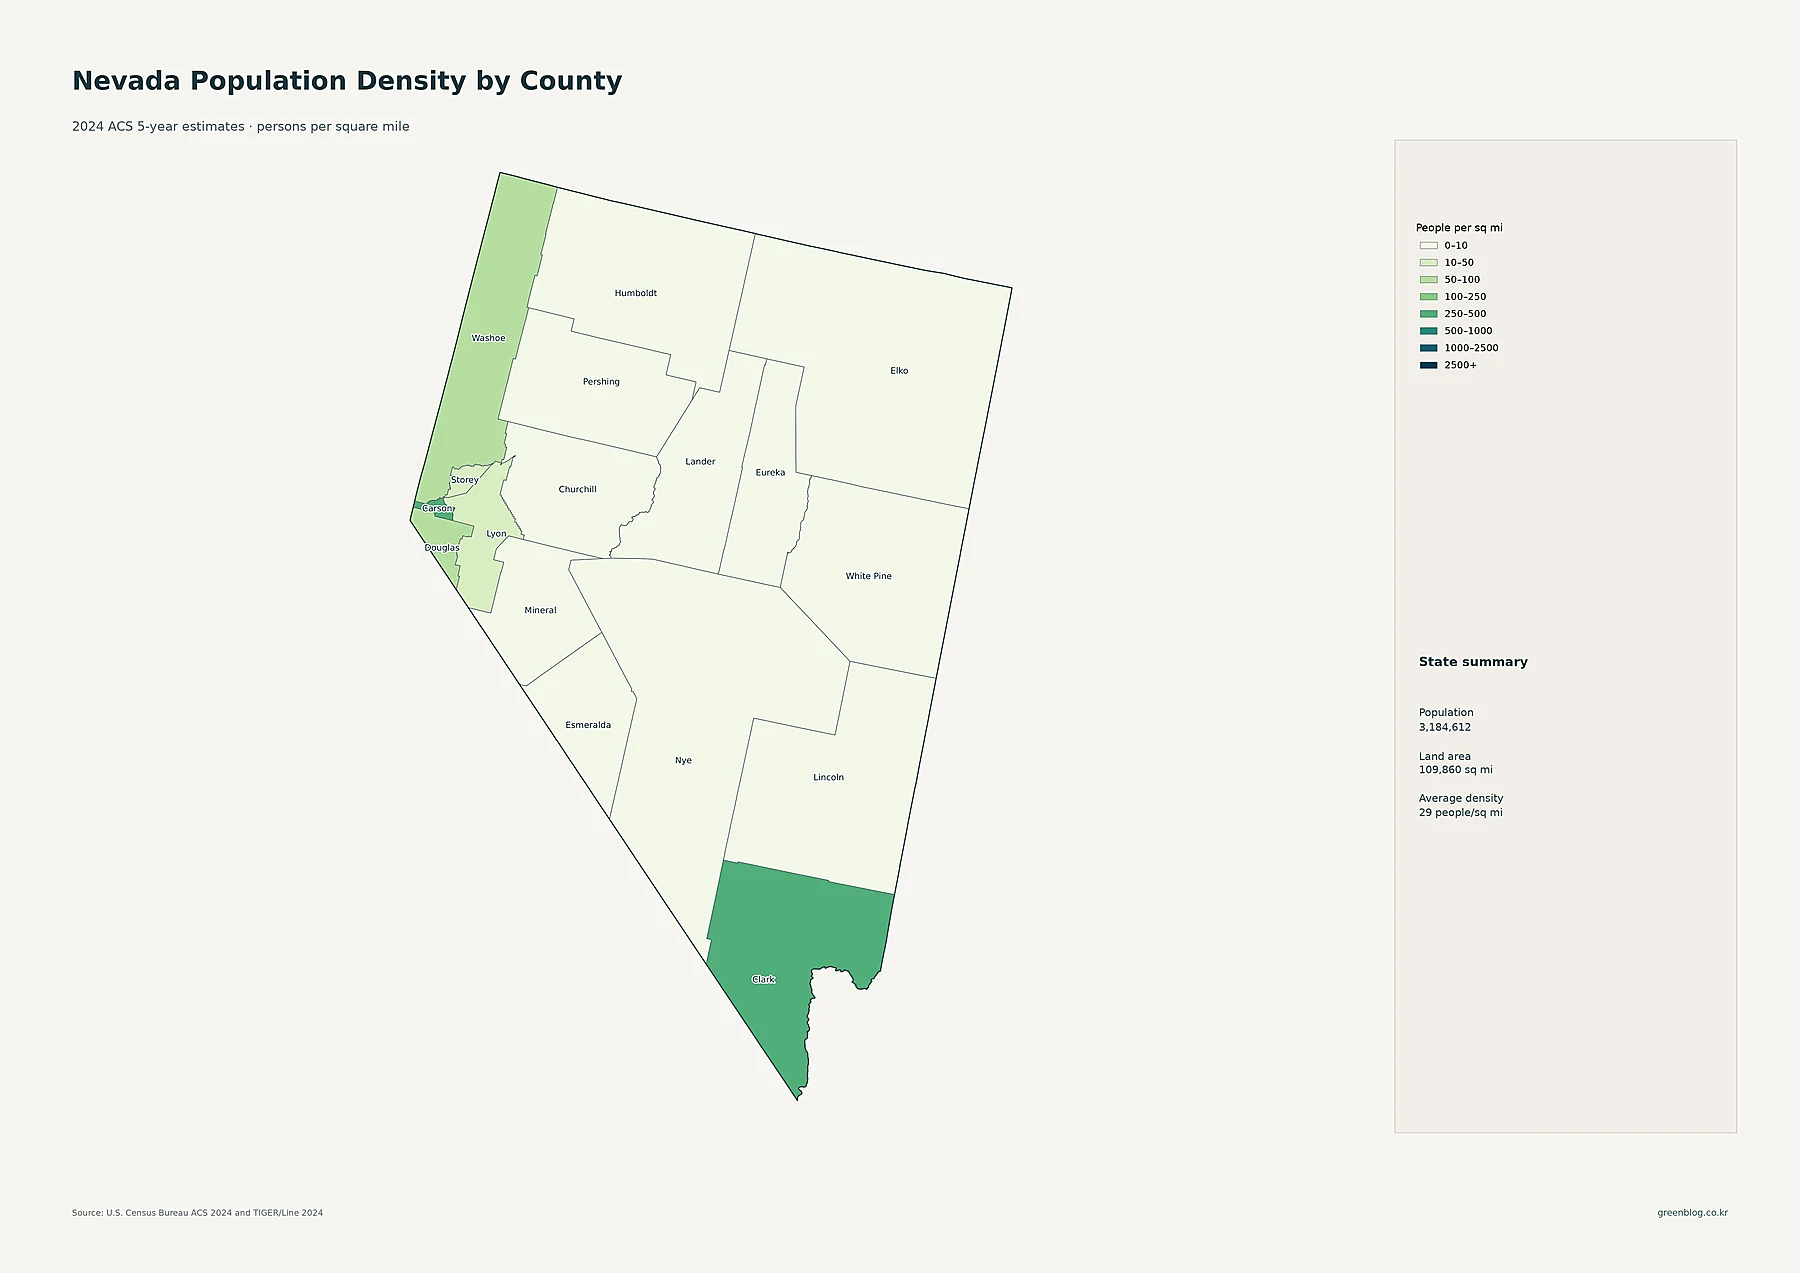
Carson City averages about 403.9 people per square mile, the highest county-level value in the supplied data. Clark County follows at about 295.2, while Washoe County is about 78.7 and Douglas County about 69.8. Lyon County averages about 30.8, close to the statewide figure, and Storey County is about 15.7. Most of the remaining counties are below 10 people per square mile. Clark’s position illustrates how a county can contain the state’s largest urban concentration and still rank below a much smaller geography in county-average density.
At the sparse end, Esmeralda County averages about 0.29 people per square mile, Eureka about 0.38, Lincoln about 0.41, and White Pine about 0.98. Lander and Pershing are just above one person per square mile, and Mineral is about 1.21. These values explain the broad pale interior on the county-density map. They also show why Nevada’s statewide average of 29 is not representative of most counties: the figure is lifted by a few much denser urban jurisdictions.
| Measure | Leading area | Value in supplied data |
|---|---|---|
| State population | Nevada | 3,184,612 |
| Largest county population | Clark County | 2,329,548 |
| Highest county-level density | Carson City | about 403.9/sq mi |
| Fastest 2010–2020 growth | Nye County | +17.4% |
| Largest 2010–2020 decline | Lincoln County | -15.8% |
Nye grew fastest from 2010 to 2020, while Lincoln recorded the largest percentage decline
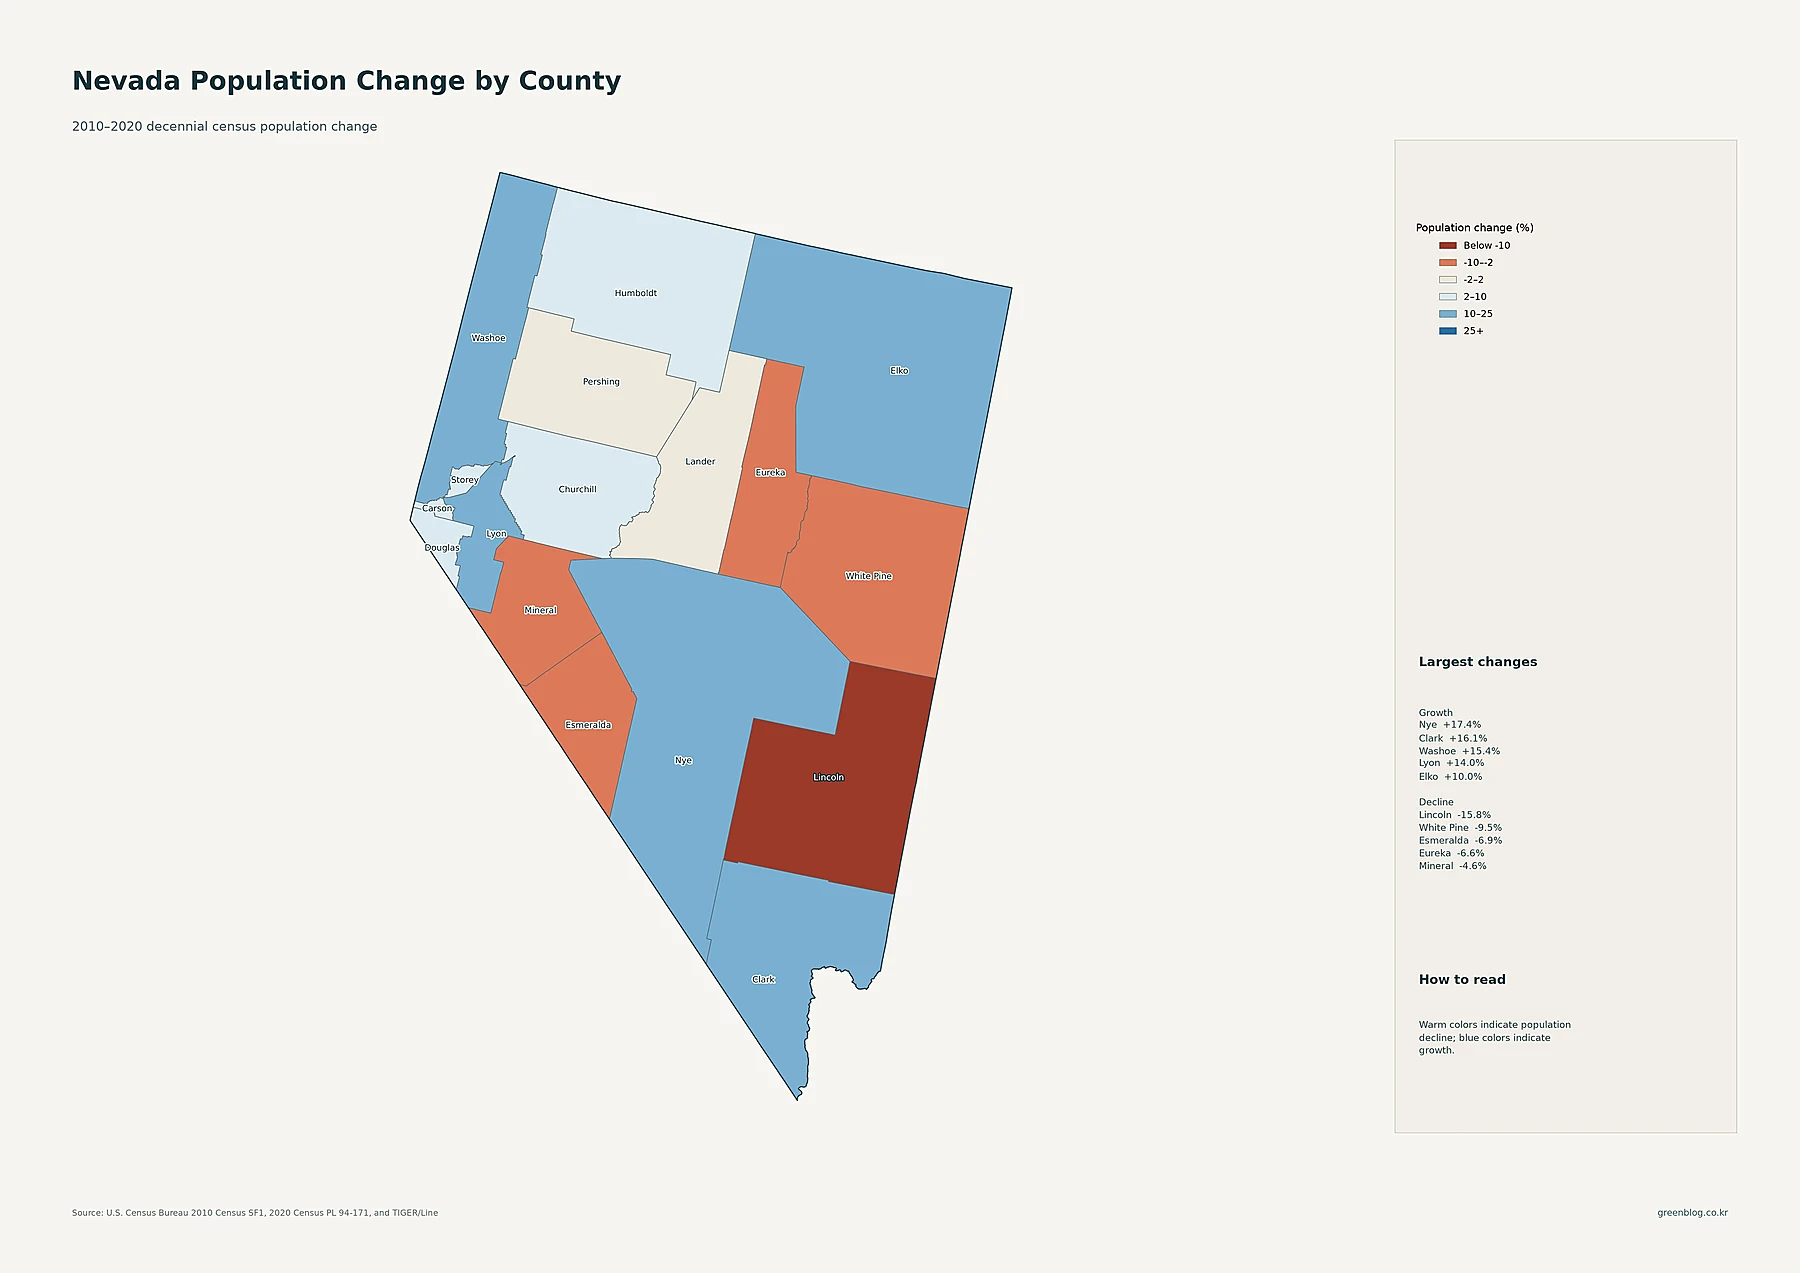
Nye County recorded the fastest percentage growth in the supplied data, rising from 43,946 residents in 2010 to 51,591 in 2020, an increase of about 17.4%. Clark County grew from 1,951,269 to 2,265,461, or about 16.1%. Washoe increased 15.4%, Lyon 14.0%, and Elko 10.0%. The change map therefore shows strong growth in several of the same places that anchor Nevada’s current population, but the fastest rate belongs to Nye rather than Clark or Washoe.
Lincoln County had the largest percentage decline, falling from 5,345 residents in 2010 to 4,499 in 2020, about -15.8%. White Pine declined 9.5%, Esmeralda 6.9%, Eureka 6.6%, and Mineral 4.6%. Pershing and Lander also posted small declines. Because some of these counties have small populations, a change of hundreds of residents can translate into a large percentage. The decade-change map is best read beside the current county-total map rather than as a measure of present-day population size.
Nevada’s defining pattern is extreme concentration within an otherwise low-density state
Taken together, the maps show a population geography built around two main urban systems. Southern Clark County contains the Las Vegas Valley and the state’s largest concentration by a wide margin. Northwestern Nevada is anchored by Reno and Sparks in Washoe County, with Carson City, Douglas, and Lyon extending the western settlement corridor. Between and beyond those clusters, most county averages remain very low and the tract map shows long stretches with little visible concentration.
Current scale and historical growth tell different parts of the story. Clark is the largest county population in 2024, but Nye had the fastest 2010–2020 percentage growth. Carson City has fewer than 60,000 residents yet ranks first in county-level density because of its compact area. Reading the tract, place, county-total, density, and change layers separately makes Nevada’s pattern clearer than a single statewide average can: very dense urban pockets coexist with some of the sparsest county landscapes in the country.
Download the Nevada population map collection
The ZIP includes detailed census-tract density, major cities and urban areas, county population totals, 2010–2020 county population change, and county population density.
FAQ
Which Nevada county has the largest population?
Clark County is the largest in the supplied 2024 ACS 5-year estimates, with 2,329,548 residents. Washoe County is second with 497,200.
Which Nevada county-level area has the highest population density?
Carson City has the highest average density at about 403.9 people per square mile. Clark County is about 295.2 and Washoe County about 78.7. The census-tract map provides a finer view of density within these areas.
Which Nevada county grew fastest between 2010 and 2020?
Nye County grew about 17.4%, from 43,946 residents in 2010 to 51,591 in 2020. That percentage compares the two decennial censuses and is separate from the 2024 ACS estimate used for current population and density.
Related Maps
Sources
- U.S. Census Bureau — American Community Survey (ACS): 2024 5-year population and density estimates
- U.S. Census Bureau — TIGER/Line Shapefiles: 2024 state, county, census tract, place geography and mapped boundaries
- U.S. Census Bureau — Decennial Census: 2010 and 2020 county population comparison
Green Map creates custom-edited map images using open geographic data sources such as geoBoundaries, Natural Earth, OpenStreetMap, and government open data. These maps are edited visual materials, not raw data files, and are provided for education, documents, presentations, and graphic reference.