Nebraska’s population is not spread evenly across its long east–west footprint. The supplied 2024 ACS 5-year estimates put the state population at 1,978,707, while the county-density map reports about 76,815 square miles of land and a statewide average of roughly 26 people per square mile. That average hides the state’s defining contrast: the Omaha and Lincoln areas are much denser than most of western and north-central Nebraska, where several counties average close to or below one person per square mile.
The five maps answer different questions, so they are most useful when read together rather than interchangeably. The tract map shows where residents are concentrated within counties. The city map compares census-place populations. The county population map compares total residents, the county-density map adjusts those totals for land area, and the 2010–2020 map measures change between two decennial censuses. Douglas County leads the current county totals and county-average density, but Sarpy County posted the fastest growth rate over the decade.
Table of Contents
Tract-level density makes the Omaha–Bellevue cluster stand out immediately
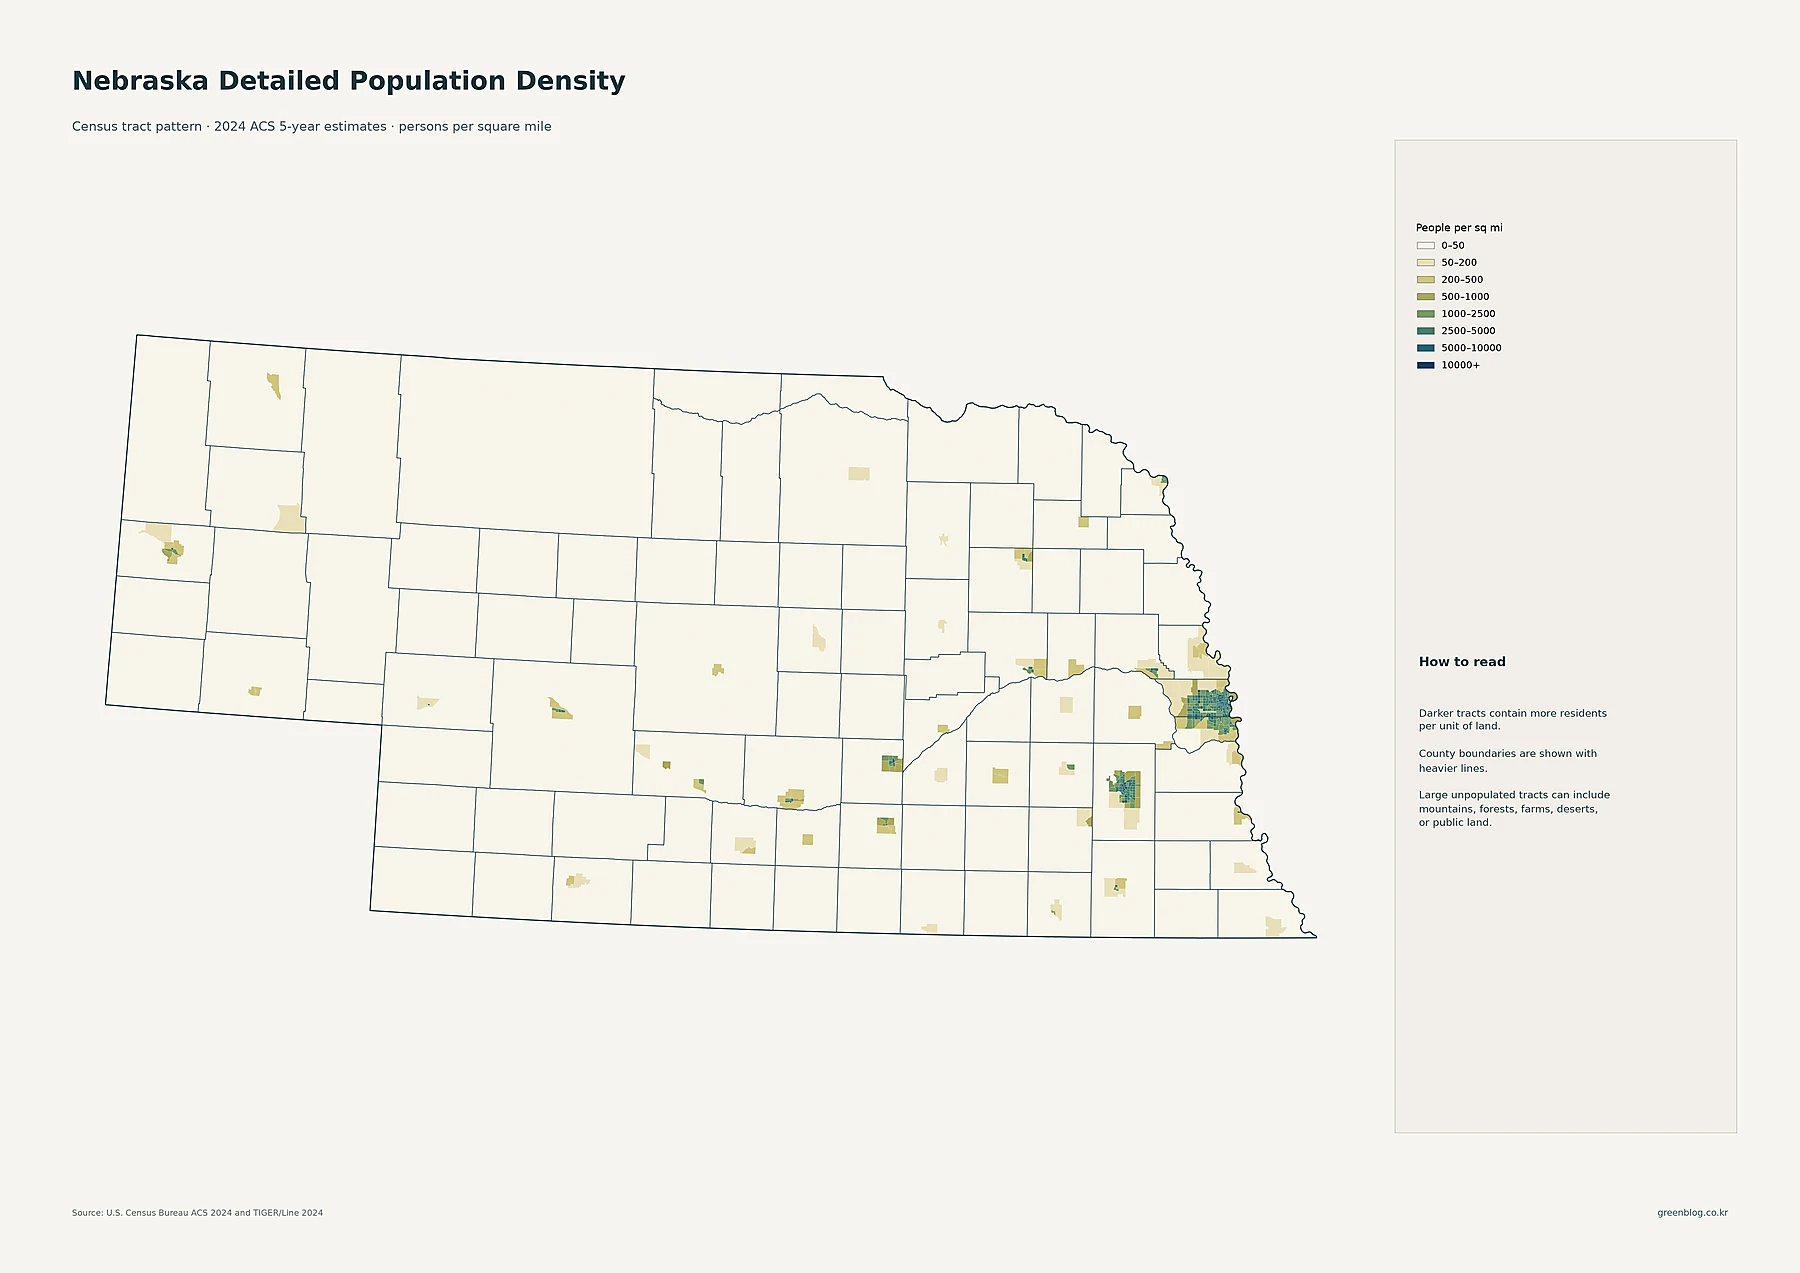
The darkest and most continuous concentration is at the eastern edge of the state around Omaha, Bellevue, and nearby communities in Douglas and Sarpy counties. Multiple high-density tracts sit next to one another rather than appearing as a single isolated patch. Lincoln forms the second major concentration farther southwest in Lancaster County. The space between the two metros is much lighter, which is a useful reminder that eastern Nebraska is not uniformly urban even though most of the state’s largest population centers are there.
Outside those two clusters, the map shows smaller pockets around Grand Island, Kearney, Hastings, Columbus, Norfolk, Fremont, North Platte, and the Scottsbluff–Gering area. They appear as compact islands of higher density surrounded by large tracts in the lightest classes. The legend separates 0–50, 50–200, 200–500, 500–1,000, 1,000–2,500, 2,500–5,000, 5,000–10,000, and 10,000+ people per square mile. That fine scale is important because a county can have a very low average while still containing a relatively dense city tract.
Omaha and Lincoln dominate the city ranking, with regional centers spaced across the state
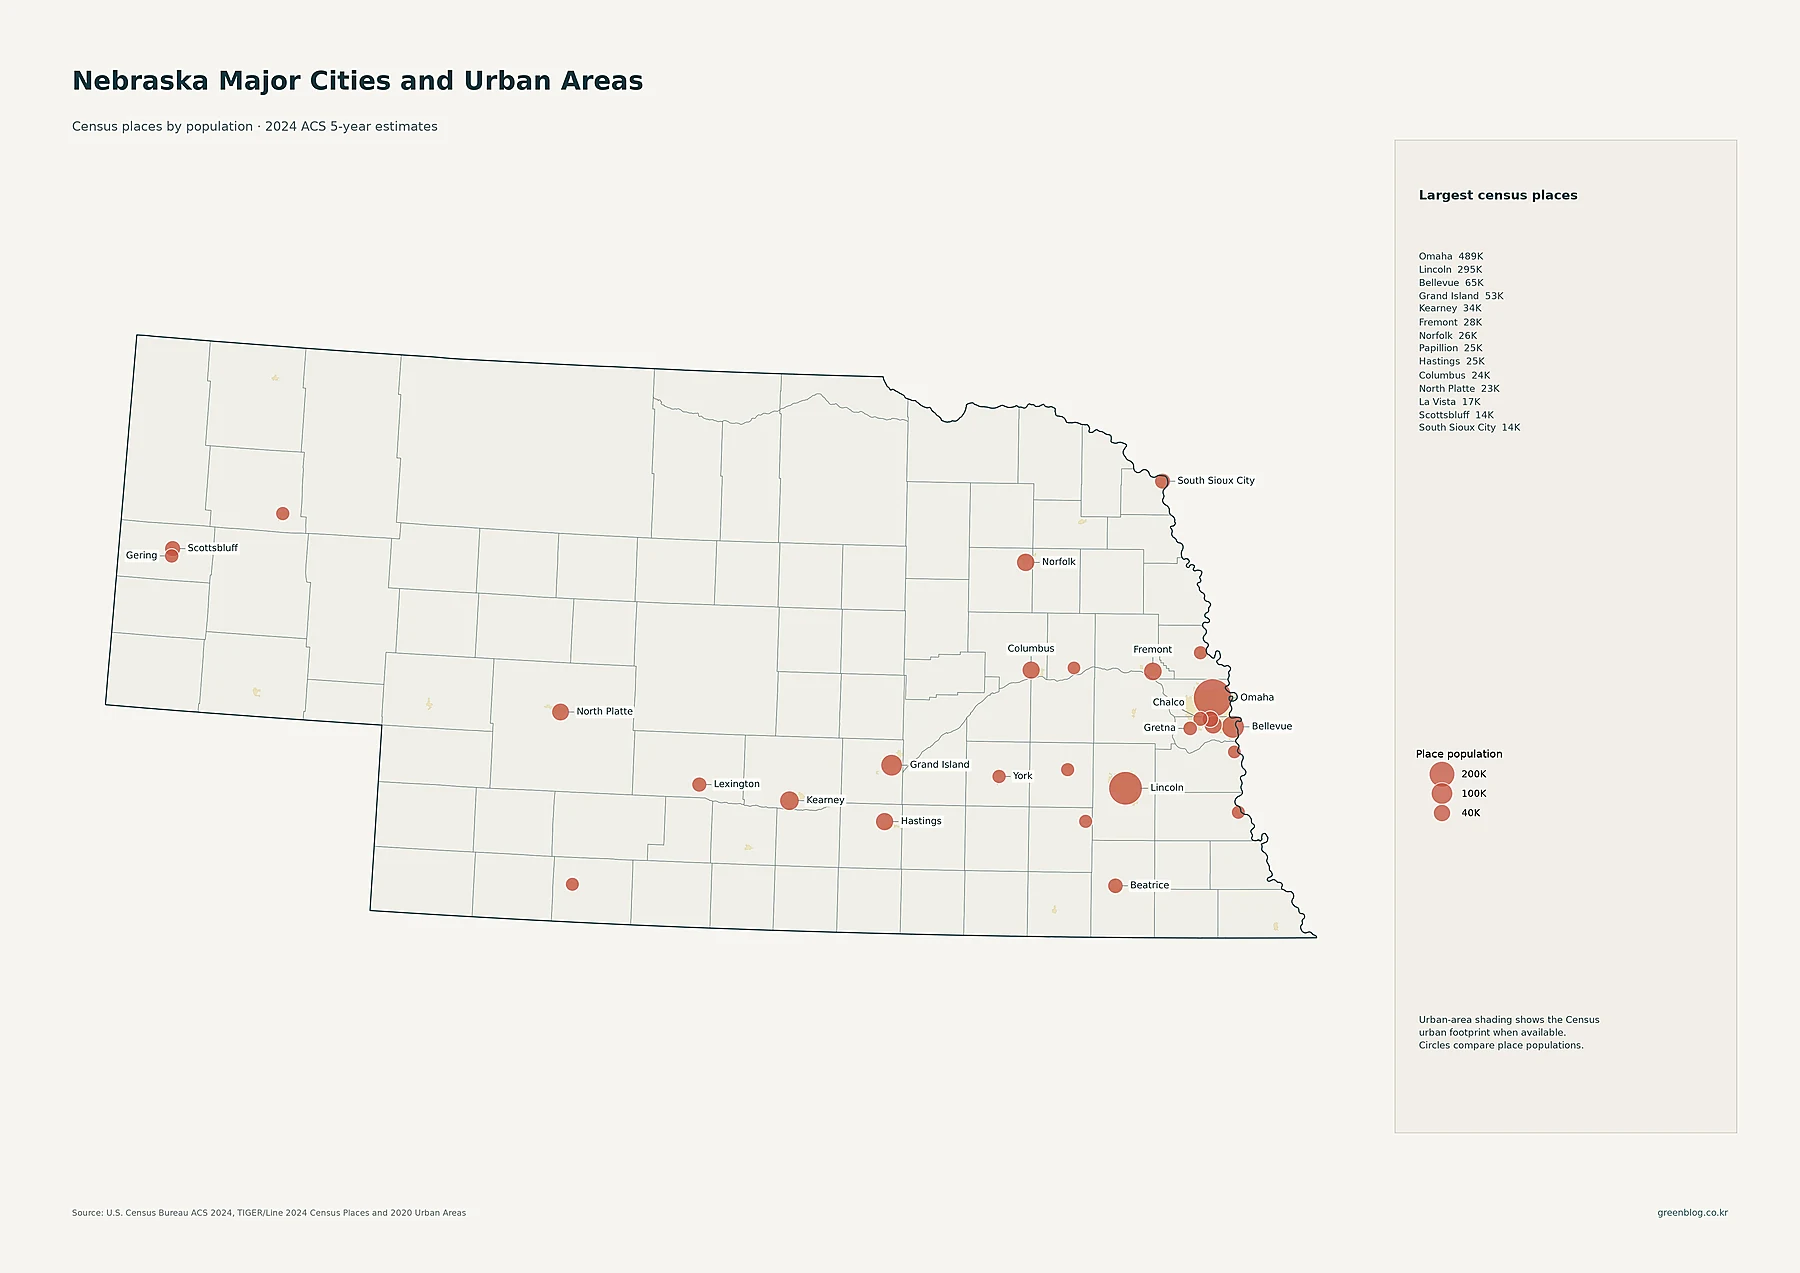
Omaha is the largest census place in the supplied data with 488,837 residents. Lincoln follows with 294,856. Bellevue has 64,510, Grand Island 52,884, Kearney 34,246, Fremont 27,567, Norfolk 26,054, Papillion 25,244, Hastings 25,008, and Columbus 24,488. North Platte has 22,831 residents, La Vista 16,563, Scottsbluff 14,376, and South Sioux City 13,907. The map therefore has two very large eastern circles and a chain of smaller regional centers extending across central and western Nebraska.
These circles represent total place population, not density. Omaha’s large symbol tells us it has more residents than any other census place in the dataset; it does not by itself measure how tightly those residents are packed. When this map is compared with the tract map, however, the broader Omaha-area cluster becomes clear because Bellevue, Papillion, La Vista, Chalco, and Gretna sit close to the state’s largest city. Farther west, places such as Grand Island, Kearney, North Platte, Scottsbluff, and Gering function as more separated population nodes.
Douglas, Lancaster and Sarpy account for the largest county totals by a wide margin
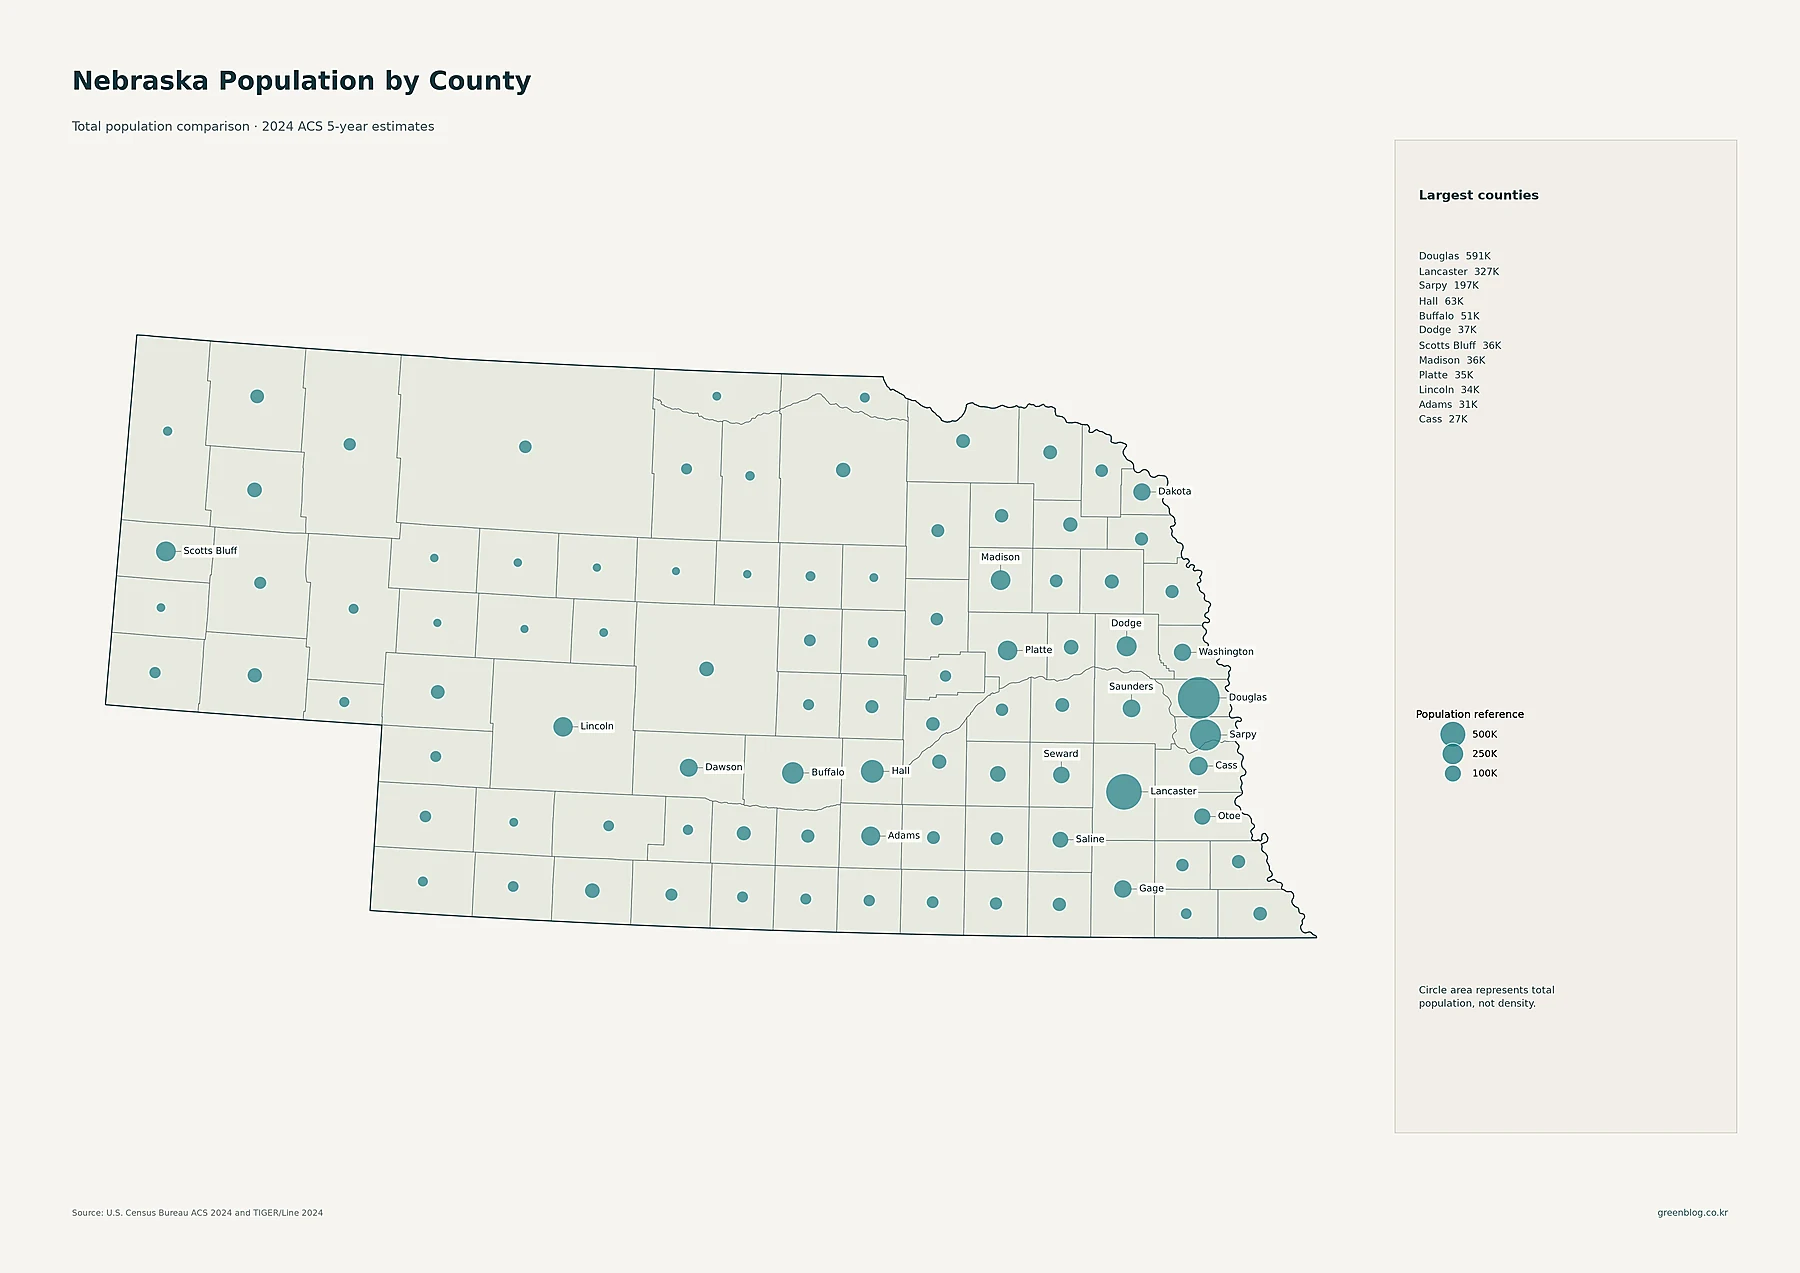
Among Nebraska’s 93 counties, Douglas County is the largest in the supplied 2024 ACS data with 590,736 residents. Lancaster County has 326,696 and Sarpy County 197,389. Together, those three counties contain well over half of the state’s population. The next tier is much smaller: Hall County has 62,536 residents, Buffalo 50,579, Dodge 37,351, Scotts Bluff 35,843, Madison 35,532, Platte 34,716, Lincoln 33,802, Adams 31,052, and Cass 27,161.
The proportional circles make the east-heavy distribution easy to see. Douglas and Sarpy create a large pair near Omaha, while Lancaster creates another large symbol around Lincoln. Central Nebraska contains several mid-sized circles associated with Grand Island, Kearney, Hastings, and Columbus, and western Nebraska has much smaller totals even where county polygons are geographically large. A county’s size on the map therefore should not be confused with its number of residents. This layer answers where the largest county populations are, not where the land is most densely settled.
Douglas County averages about 1,809 people per square mile, while much of the west stays below 10
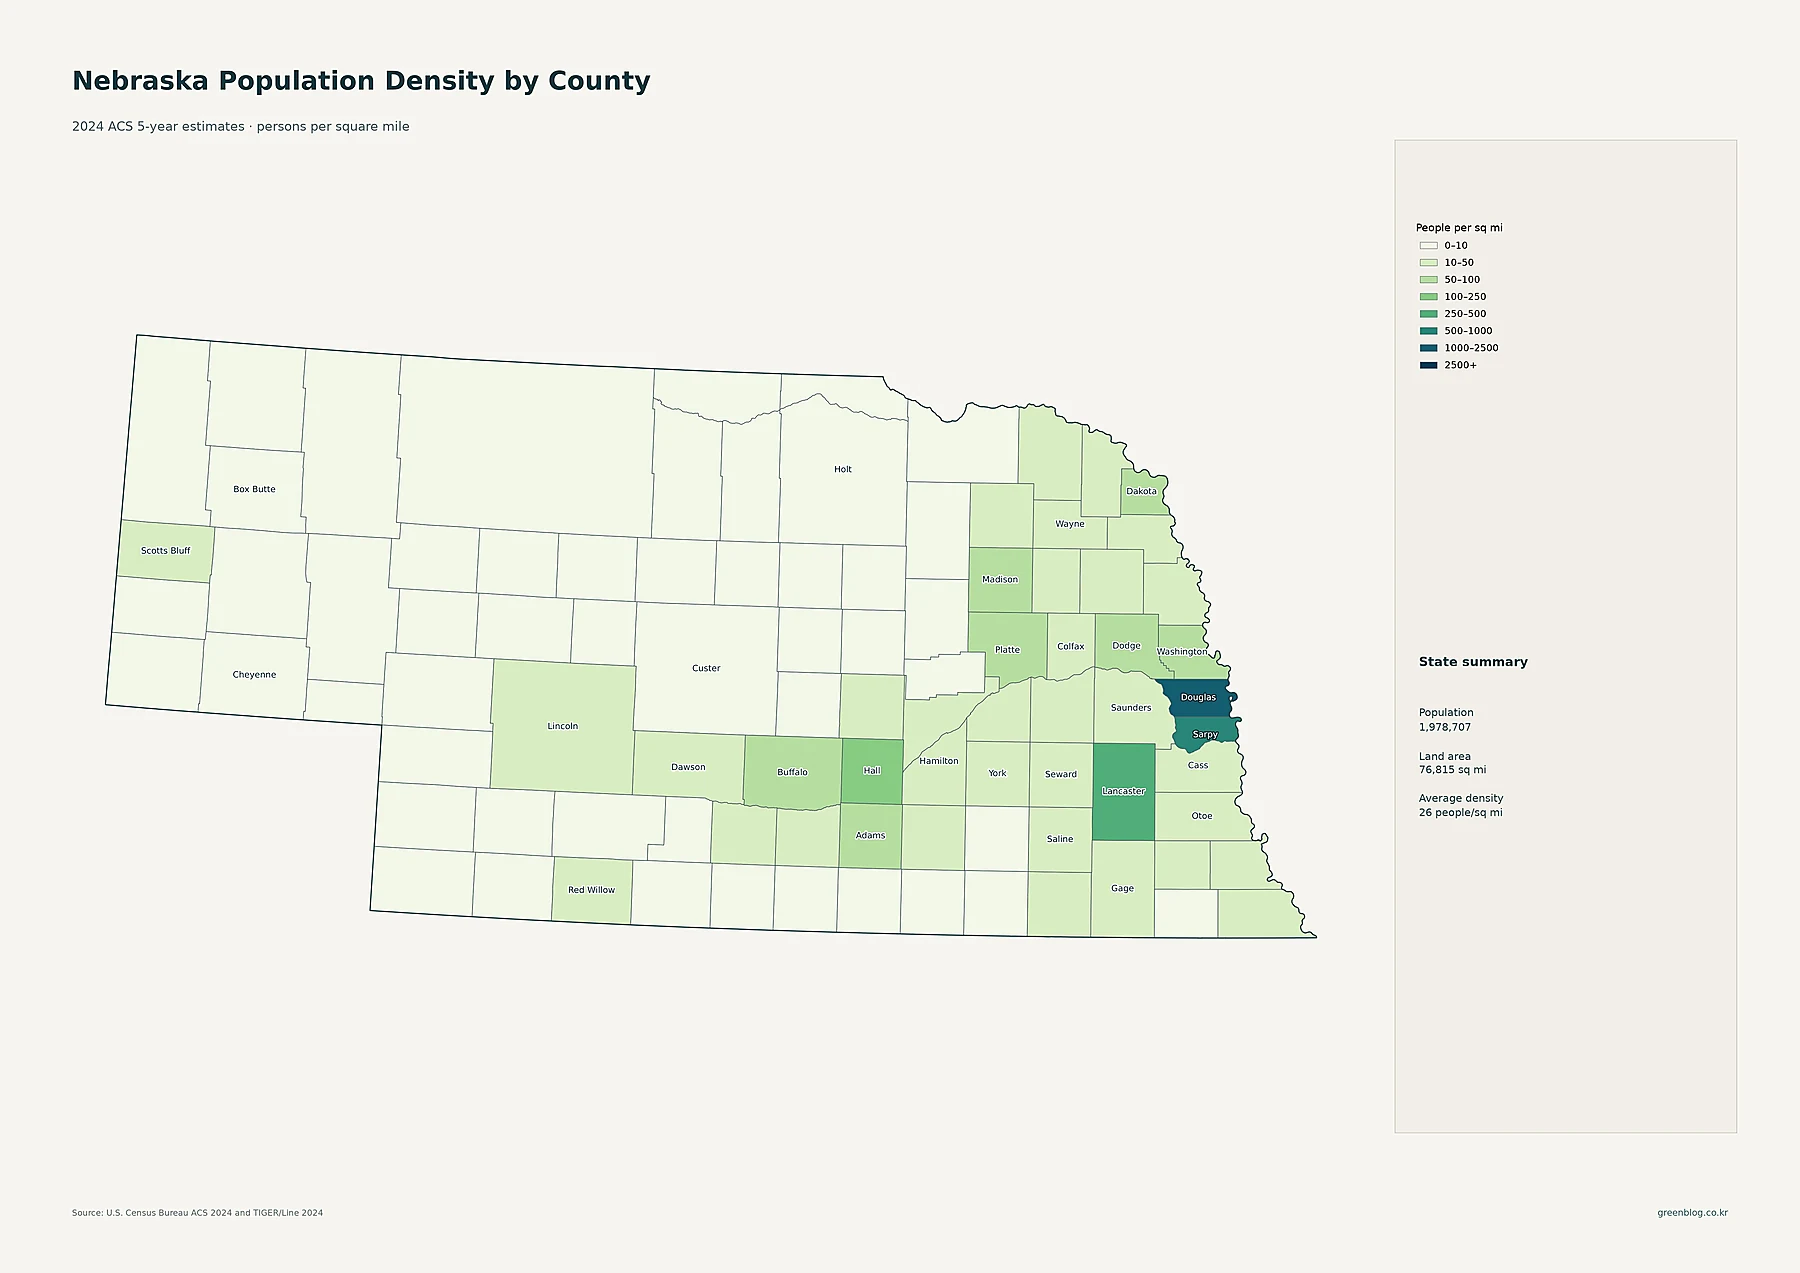
Douglas County has the highest county-average density at about 1,809 people per square mile. Sarpy County is next at about 829, followed by Lancaster at about 390. Hall County is roughly 114, Dakota 80.8, Dodge 70.6, Madison 62.1, Adams 55.1, Washington 54.1, Buffalo 52.2, Platte 51.4, and Cass 48.8. The darker eastern counties therefore reflect both large population totals and relatively compact land areas, while a few central counties reach moderate density because their residents are concentrated around regional cities.
The other end of the scale is just as important. McPherson County averages about 0.55 people per square mile, Sioux about 0.57, Blaine 0.59, Arthur 0.68, Thomas 0.79, and Grant 0.81. Cherry County, despite its very large area, averages only about 0.92. These values explain why the western half of the county-density map is dominated by the lightest 0–10 class. The statewide average of 26 is therefore not a typical county value; it is an average pulled upward by the Omaha and Lincoln areas.
| Measure | Leading area | Value in supplied data |
|---|---|---|
| State population | Nebraska | 1,978,707 |
| Largest county population | Douglas County | 590,736 |
| Highest county density | Douglas County | about 1,809/sq mi |
| Fastest 2010–2020 growth | Sarpy County | +20.0% |
| Largest 2010–2020 decline | McPherson County | -26.0% |
Sarpy grew 20.0% from 2010 to 2020, while McPherson declined about 26.0%
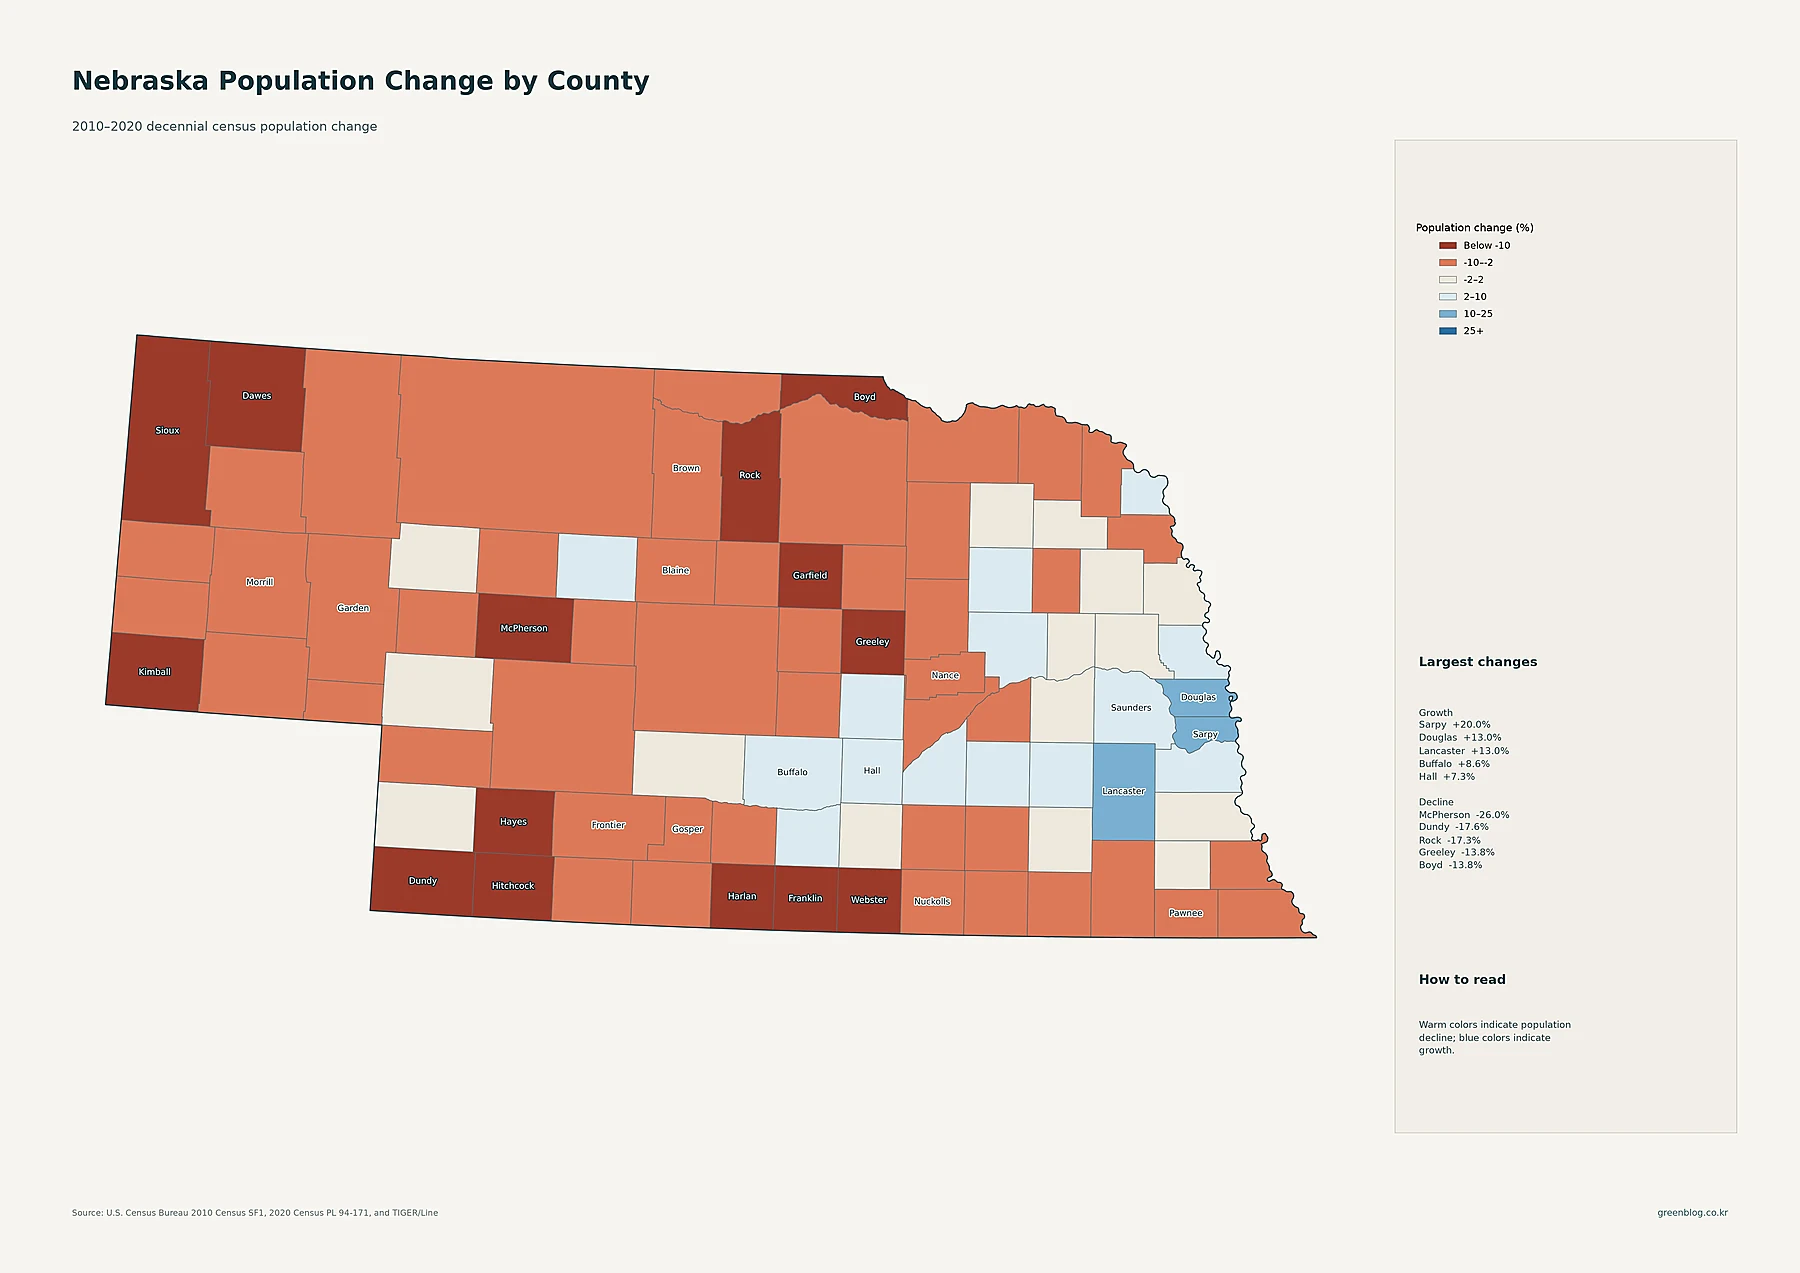
Sarpy County recorded the fastest percentage growth in the supplied county data, rising from 158,840 residents in 2010 to 190,604 in 2020, an increase of about 20.0%. Douglas County grew from 517,110 to 584,526, or about 13.0%, and Lancaster County rose from 285,407 to 322,608, also about 13.0%. Buffalo grew 8.6%, Hall 7.3%, Saunders 7.2%, Platte 6.4%, Cass 5.4%, and Seward 5.1%. The strongest growth is therefore concentrated in and around the state’s largest eastern population centers, with a smaller set of gains in central Nebraska.
McPherson County had the largest percentage decline, falling from 539 residents in 2010 to 399 in 2020, or about -26.0%. Dundy declined 17.6%, Rock 17.3%, Greeley 13.8%, Boyd 13.8%, and Sioux 13.4%. Webster, Dawes, Kimball, and Hitchcock also lost around a tenth of their 2010 populations. Because many of these counties are small, a relatively modest numerical loss can create a large percentage change. The change map is therefore best interpreted beside the current population map rather than as a ranking of present-day population size.
Nebraska’s population pattern is a dense eastern core connected to widely separated regional centers
Reading all five layers together gives a clearer picture than any statewide average. Omaha and its surrounding communities form the state’s strongest concentration, Lincoln creates a second large cluster, and cities such as Grand Island, Kearney, Hastings, Columbus, Norfolk, North Platte, and Scottsbluff appear as smaller nodes across a much more lightly populated landscape. The county totals reinforce that pattern: Douglas, Lancaster, and Sarpy are far ahead of every other county in population.
The maps also show why “largest,” “densest,” and “fastest-growing” should not be treated as synonyms. Douglas County is both the largest and densest county in the 2024 ACS data, but Sarpy grew faster between the 2010 and 2020 censuses. Meanwhile, several western and north-central counties have very low density and experienced population decline over that decade. Separating total population, density, fine-scale settlement, and historical change makes Nebraska’s east–west population contrast much easier to understand.
Download the Nebraska population map collection
The ZIP includes detailed census-tract density, major cities and urban areas, county population totals, 2010–2020 county population change, and county population density.
FAQ
Which Nebraska county has the largest population?
Douglas County is the largest in the supplied 2024 ACS 5-year estimates, with 590,736 residents. Lancaster County has 326,696 and Sarpy County 197,389.
Which Nebraska county has the highest population density?
Douglas County has the highest county-average density at about 1,809 people per square mile. Sarpy is about 829 and Lancaster about 390. The tract map provides a more detailed view of density within those counties.
Which Nebraska county grew fastest between 2010 and 2020?
Sarpy County grew about 20.0%, from 158,840 residents in 2010 to 190,604 in 2020. That percentage compares the two decennial censuses and is separate from the 2024 ACS estimate used for current population and density.
Related Maps
Sources
- U.S. Census Bureau — American Community Survey (ACS): 2024 5-year population and density estimates
- U.S. Census Bureau — TIGER/Line Shapefiles: 2024 state, county, census tract, place geography and mapped boundaries
- U.S. Census Bureau — Decennial Census: 2010 and 2020 county population comparison
Green Map creates custom-edited map images using open geographic data sources such as geoBoundaries, Natural Earth, OpenStreetMap, and government open data.
These maps are edited visual materials, not raw data files, and are provided for education, documents, presentations, and graphic reference.