Maine’s population pattern is weighted strongly toward the south, especially the Portland area and the southern coastal counties, while much of the north and interior remains sparsely settled. The supplied 2024 ACS 5-year data place the state population at 1,387,817. The county-density map also reports about 30,845 square miles of land and an average density near 45 people per square mile. That statewide average hides a much wider range. Cumberland County contains the largest population and the highest county-level density, York and Androscoggin are also relatively dense, and separate urban clusters appear around Augusta–Waterville and Bangor. Farther north and inland, counties such as Aroostook, Piscataquis, Somerset, and Washington cover large areas with far fewer residents per square mile.
The five maps are designed to answer different questions. The circles on the major-cities map and county-population map compare resident totals, not density. The census-tract and county-density maps use color to show people per square mile. The change map uses a different time frame as well: it compares the 2010 and 2020 Decennial Census rather than the 2024 ACS estimates used for the current population maps. Keeping those measures separate prevents a common mistake. A county can have many residents because it is large, a high density because residents occupy less land, or a high growth rate because its population increased quickly from a smaller starting point.
Table of Contents
Census tracts show the sharpest concentration around Portland and a chain of smaller southern and central clusters
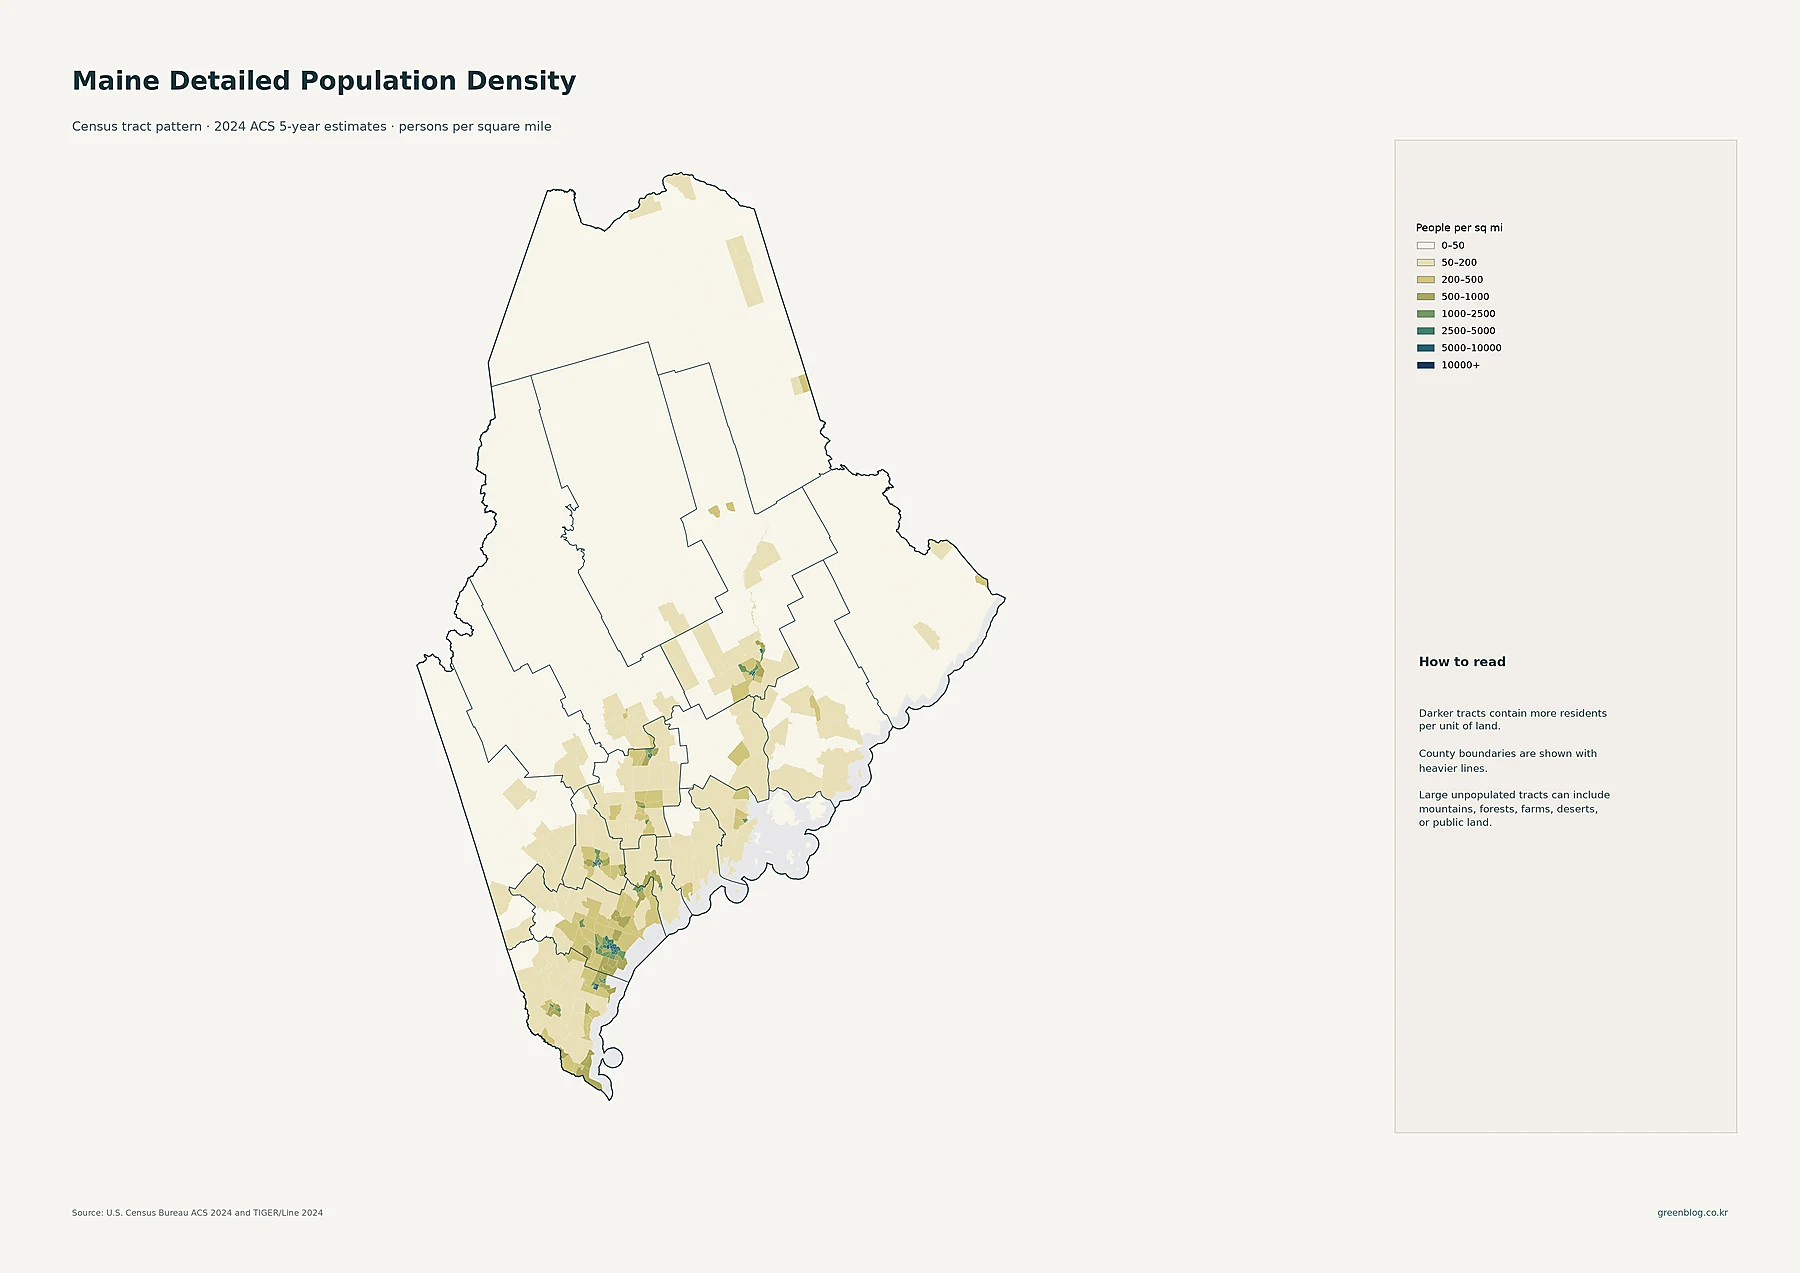
The darkest tract cluster sits in and around Portland and South Portland. Higher-density tracts continue through nearby parts of the southern coastal corridor, including the Westbrook, Saco, and Biddeford area, making this the most continuous concentration on the state map. Lewiston and Auburn form another clear cluster farther inland. Because the two places are close together, their dense tracts stand out as a paired urban center in Androscoggin County. Augusta and Waterville create smaller concentrations in central Maine, while Bangor, Brewer, and Orono form another distinct group farther northeast.
Most of northern and western Maine is much lighter. Large portions of Aroostook, Piscataquis, Somerset, and neighboring interior territory fall in the lowest legend classes. Presque Isle and Caribou still appear as local population centers within Aroostook, but the darker tracts occupy only a small share of the county’s very large area. The same pattern is visible elsewhere: compact towns can be locally dense even when the surrounding county is sparse. That is the main advantage of the tract map over a county average, because it reveals where residents actually cluster inside administrative boundaries.
Portland is the largest census place, while Lewiston and Bangor anchor separate population centers
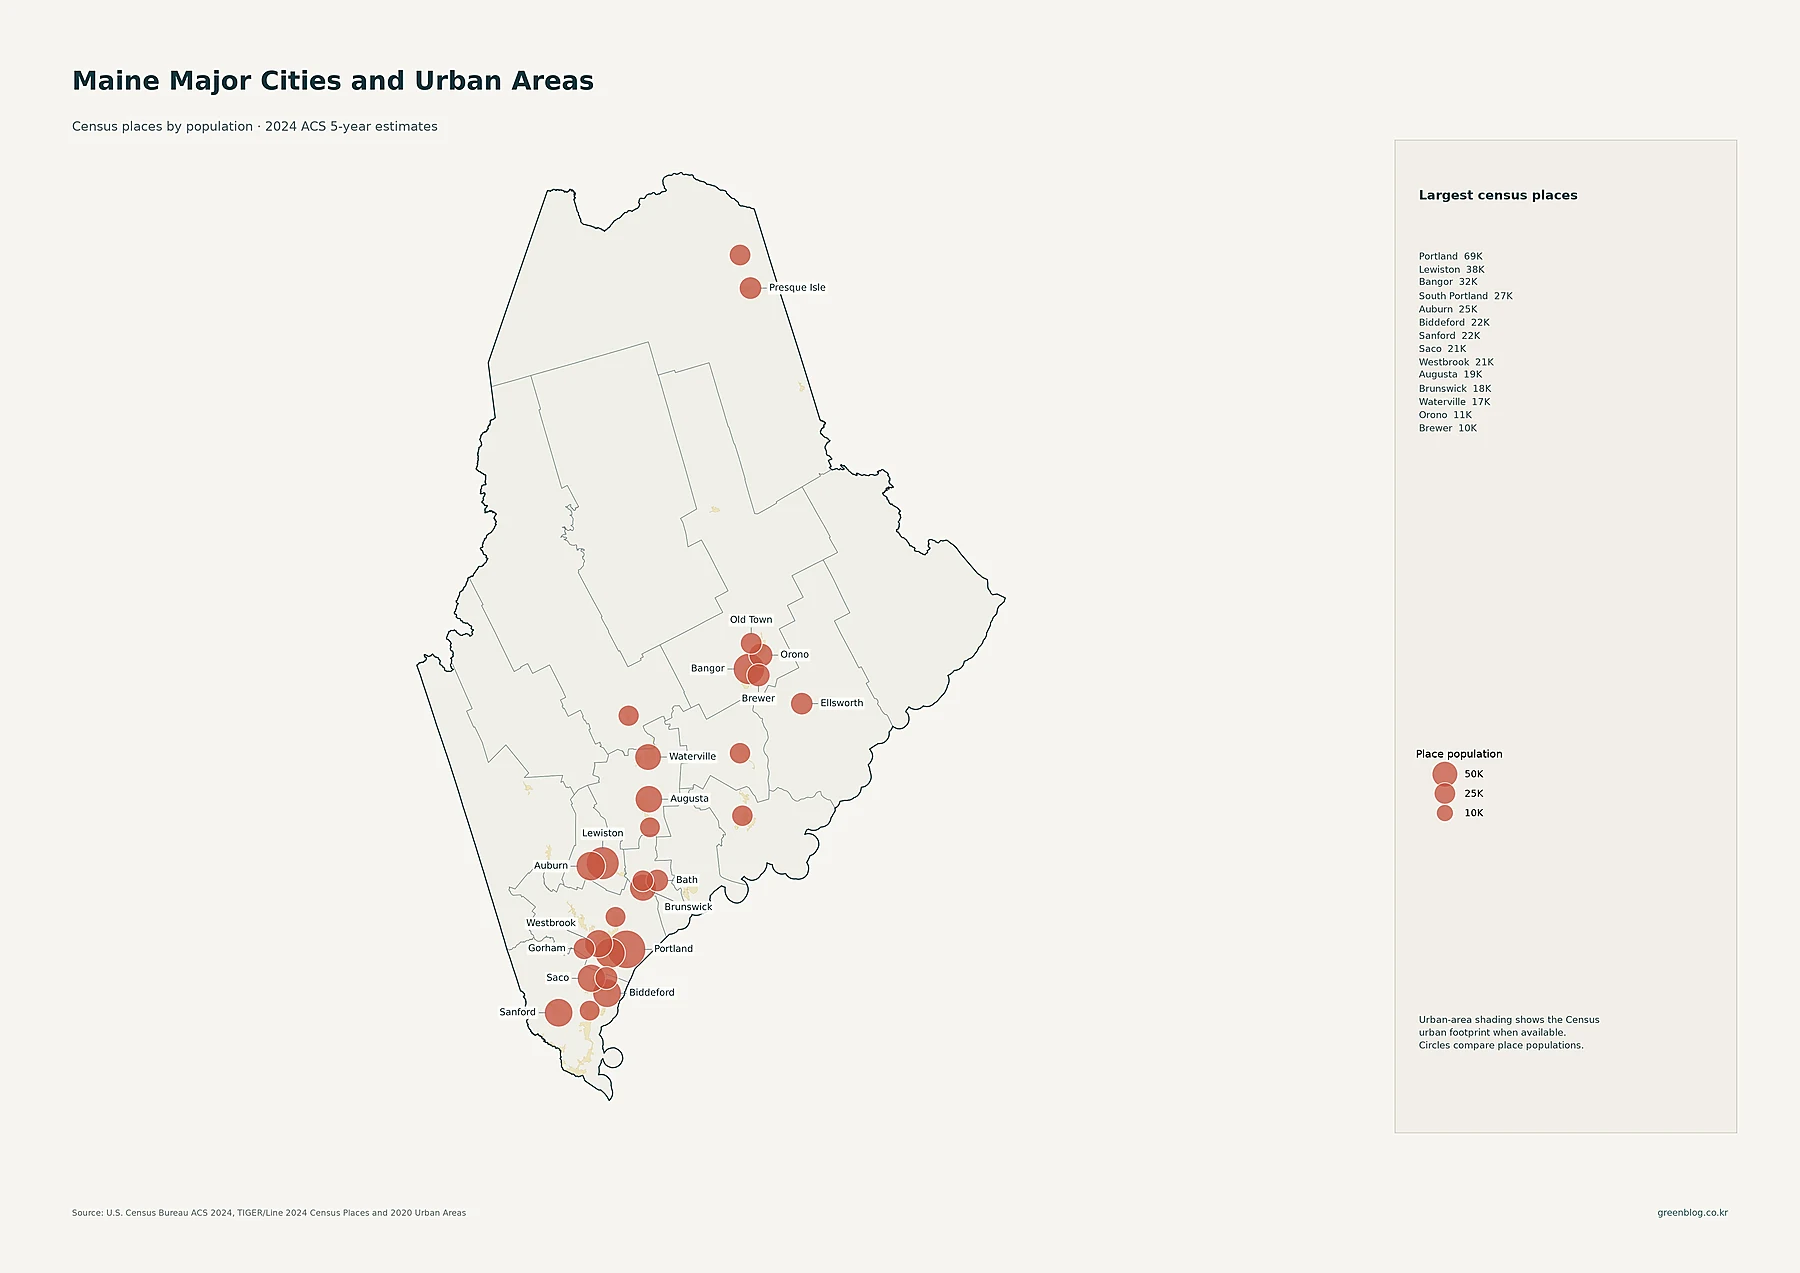
Portland is the largest census place in the supplied table at 68,854 residents. Lewiston follows at 38,324 and Bangor at 31,938. South Portland has 26,930, Auburn 24,602, Biddeford 22,498, and Sanford 22,247. Saco and Westbrook are both near 21,000, while Augusta has 19,077, Brunswick 17,652, and Waterville 17,077. Orono has 11,151 and Brewer 9,652. In northern Maine, Presque Isle has 8,736 residents and forms one of the clearest place circles away from the southern half of the state.
The spatial arrangement matters as much as the ranking. Portland, South Portland, Westbrook, Saco, Biddeford, and Sanford create a relatively tight southern group. Lewiston and Auburn form a second paired center north of that cluster. Augusta and Waterville occupy central Maine, while Bangor, Brewer, Old Town, and Orono form a separate concentration farther northeast. The proportional circles are not a measure of how tightly people live within each place. A larger circle simply means a larger place population; tract density is the better map for comparing the concentration of residents within those urban areas.
Cumberland and York dominate county population totals, with Penobscot and Kennebec forming the next tier
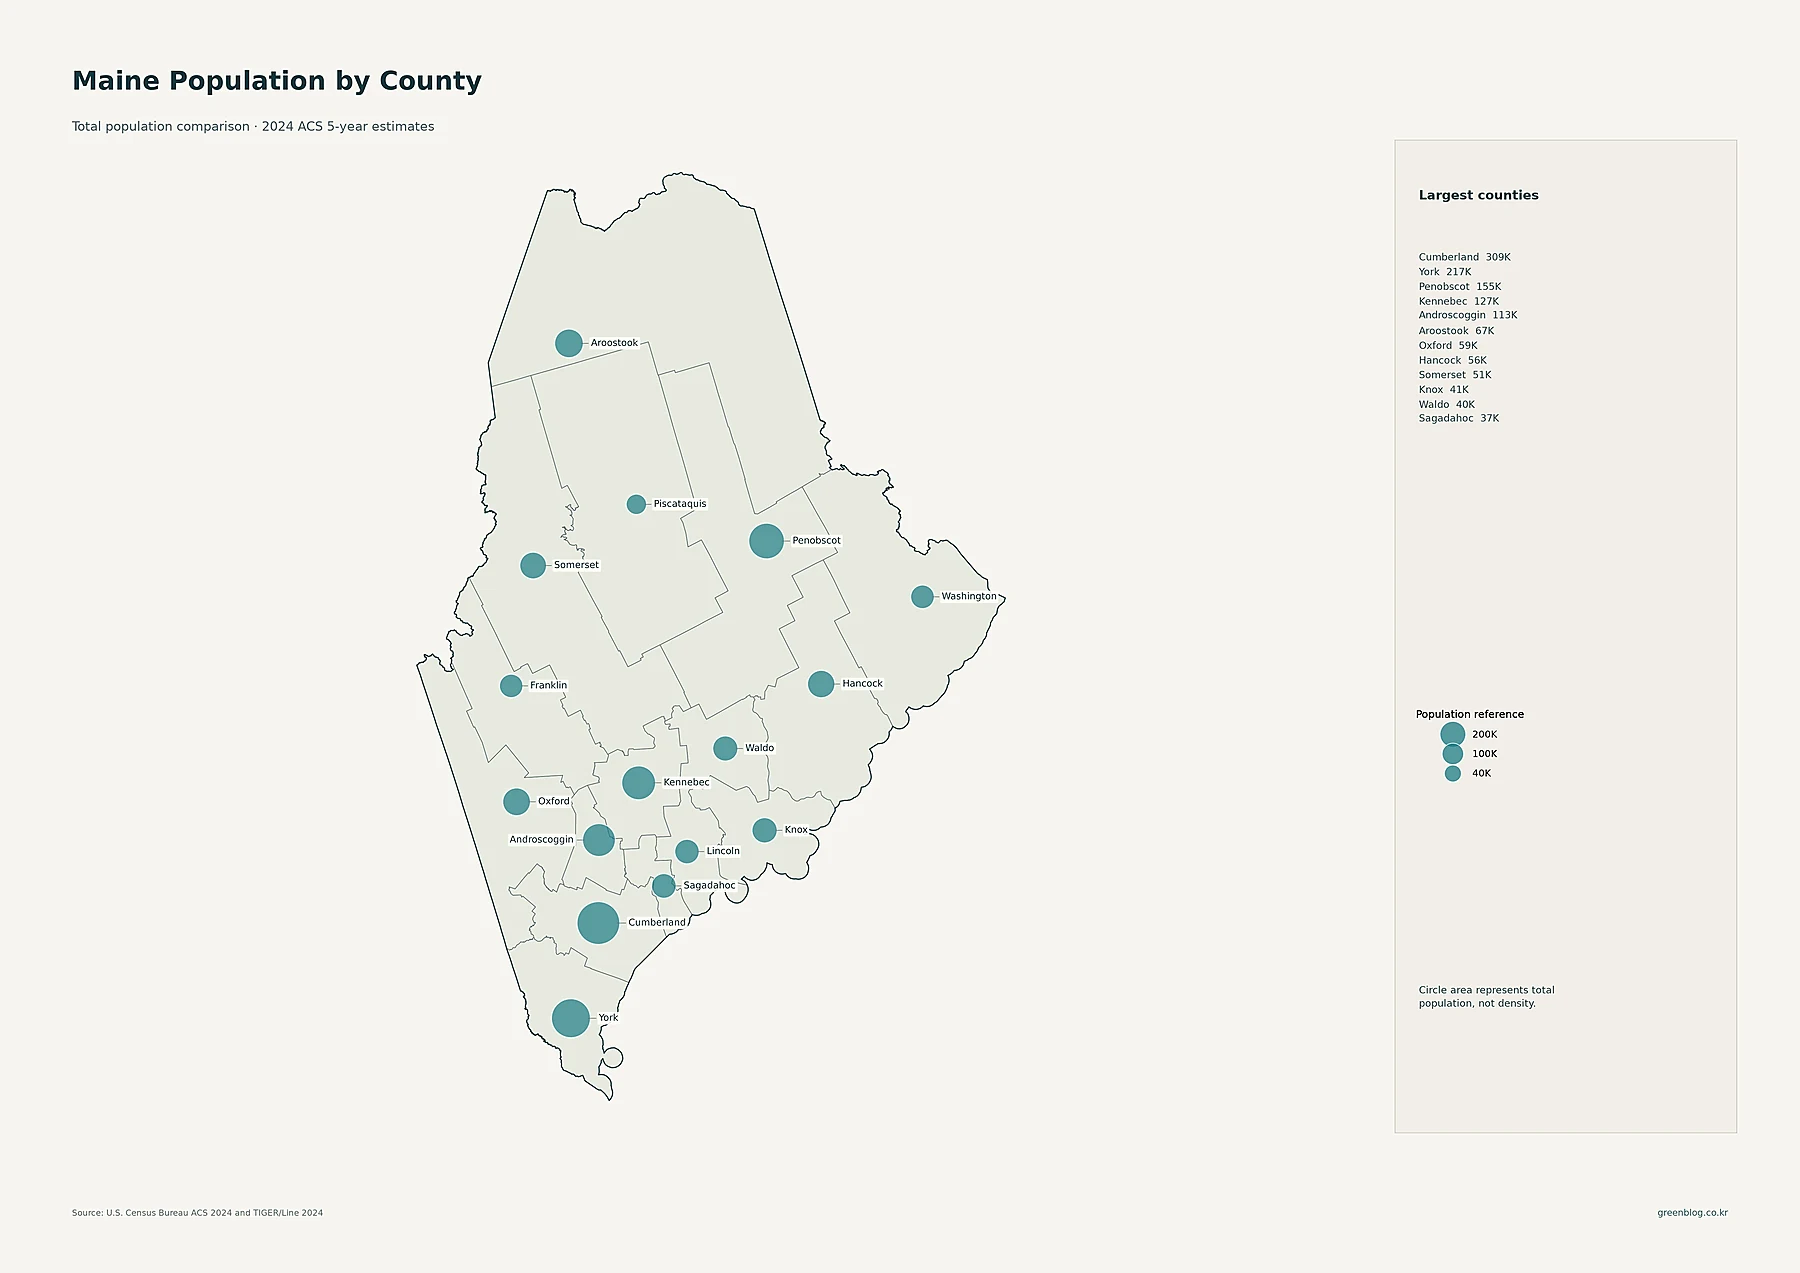
Cumberland County has 308,827 residents, the largest county total in the dataset. York County is second at 216,731. Penobscot has 154,710, Kennebec 126,808, and Androscoggin 113,423. The middle of the ranking includes Aroostook at 67,058, Oxford at 59,255, Hancock at 56,460, and Somerset at 50,959. Knox has 41,003, Waldo 40,192, Sagadahoc 37,285, Lincoln 36,099, Washington 31,331, Franklin 30,413, and Piscataquis 17,263.
The largest circles therefore sit in southern Maine, especially Cumberland and York, but county area changes how those totals should be interpreted. Aroostook is geographically enormous yet has only about one-fifth of Cumberland’s population. Penobscot ranks third in total residents but is much less dense than the leading southern counties. The county circle for Cumberland also should not be confused with Portland’s city population: the county total includes Portland, other cities and towns, and residents outside those individual census places.
Cumberland, Androscoggin, and York lead county density, while Piscataquis is below five people per square mile
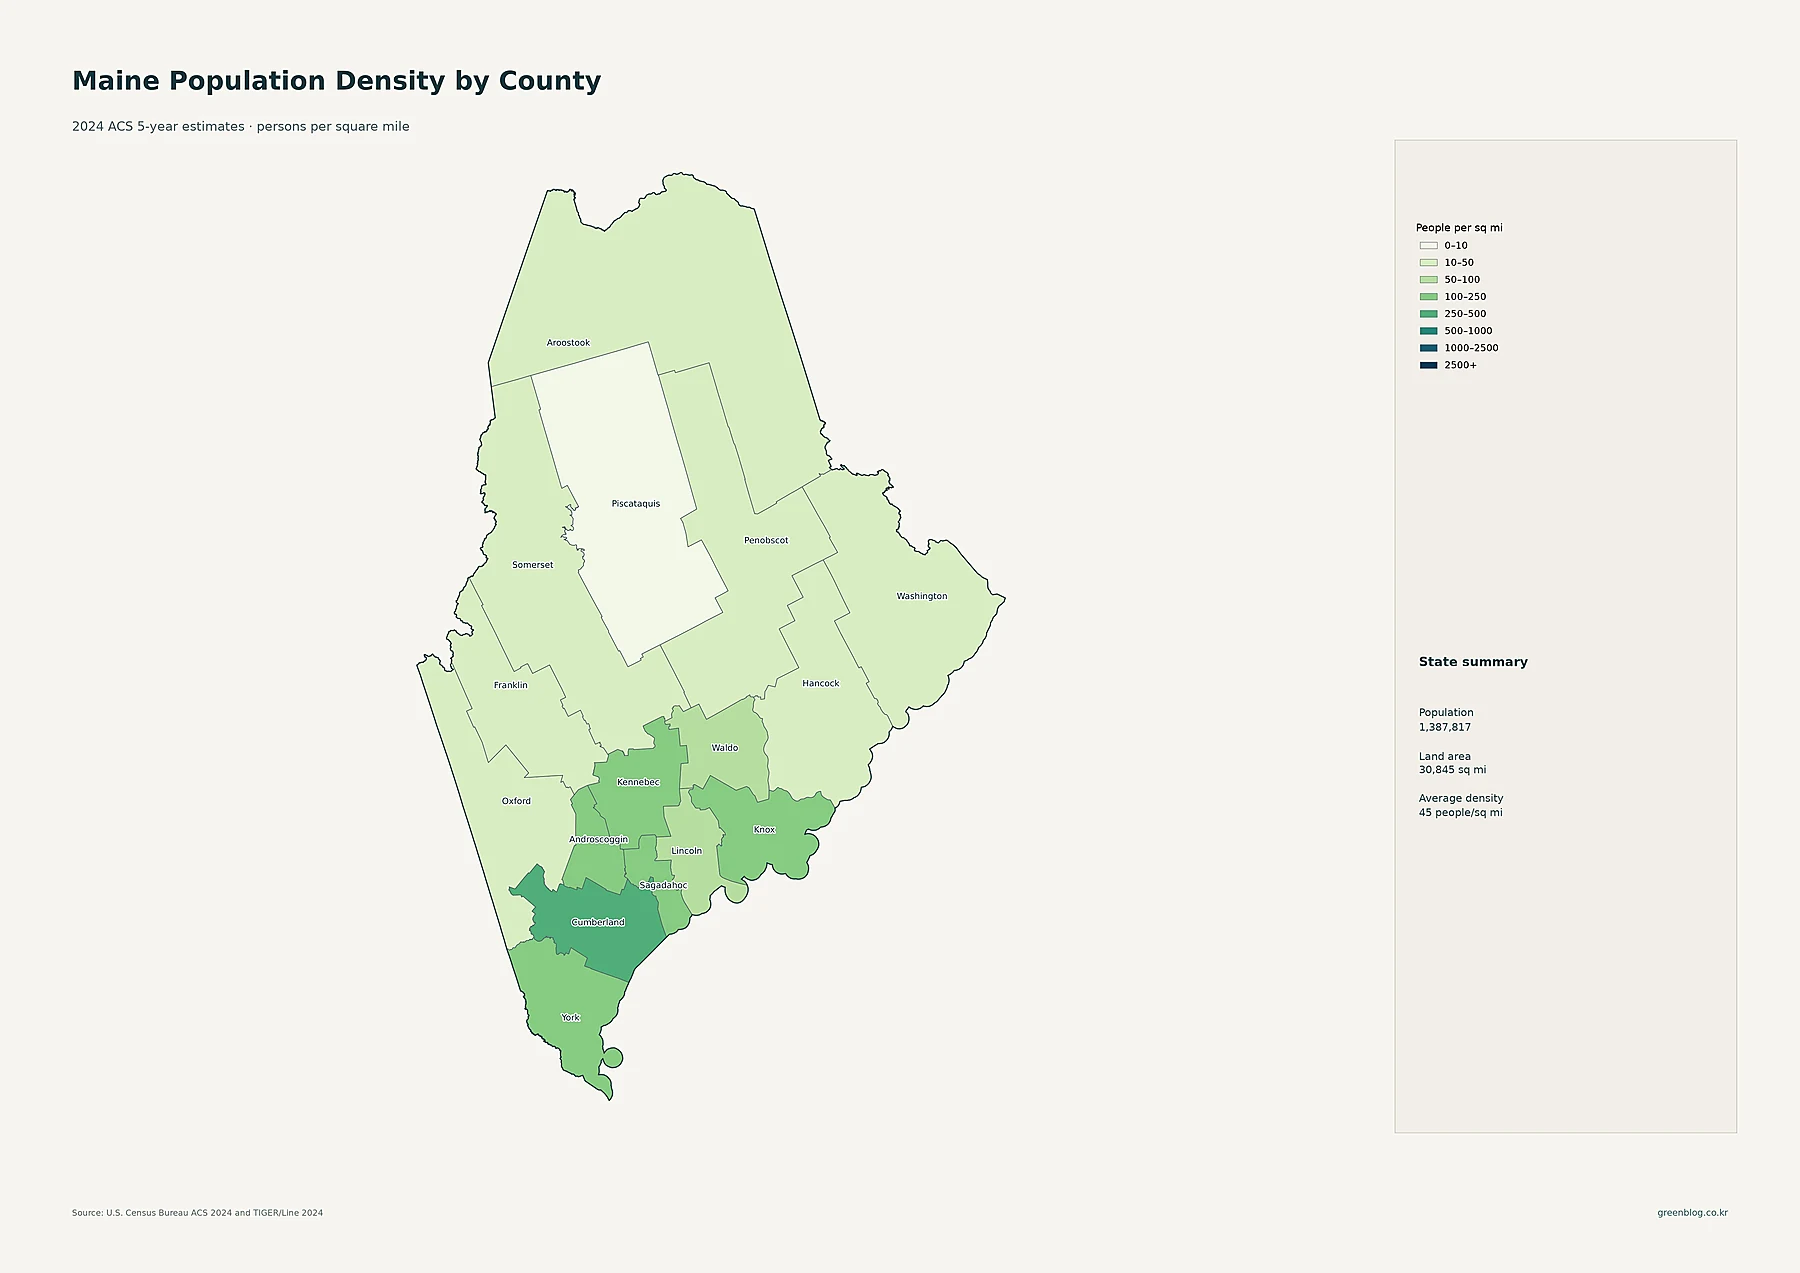
Cumberland County averages about 369 people per square mile, the highest county value in the supplied data. Androscoggin follows at about 242 and York at 219. Sagadahoc and Kennebec are nearly tied at roughly 147 and 146, while Knox is about 112. Lincoln averages about 79, Waldo 55, Penobscot 46, Hancock 36, and Oxford 29. The ranking shows that Portland’s home county is not the only dense part of Maine: the Lewiston–Auburn area pushes Androscoggin well above most of the state, and York’s southern settlements also create a relatively high county average.
The low-density end is dramatically different. Piscataquis averages only about 4.4 people per square mile. Aroostook is about 10.1, Washington 12.2, Somerset 13.0, and Franklin 17.9. Those values explain why the statewide average of roughly 45 can be misleading when used alone. Maine contains a county above 300 people per square mile and another below five. County density is useful for broad administrative comparison, while the tract map adds the local detail needed to see towns and urban neighborhoods inside these large, sparsely populated counties.
| Measure | Leading area | Value in the supplied data |
|---|---|---|
| State population | Maine | 1,387,817 |
| Largest county population | Cumberland | 308,827 |
| Highest county density | Cumberland | about 369/sq mi |
| Fastest 2010–2020 growth | Cumberland | +7.6% |
| Largest 2010–2020 decline | Aroostook | -6.6% |
2010–2020 growth favored the south, while Aroostook and Washington recorded the largest declines
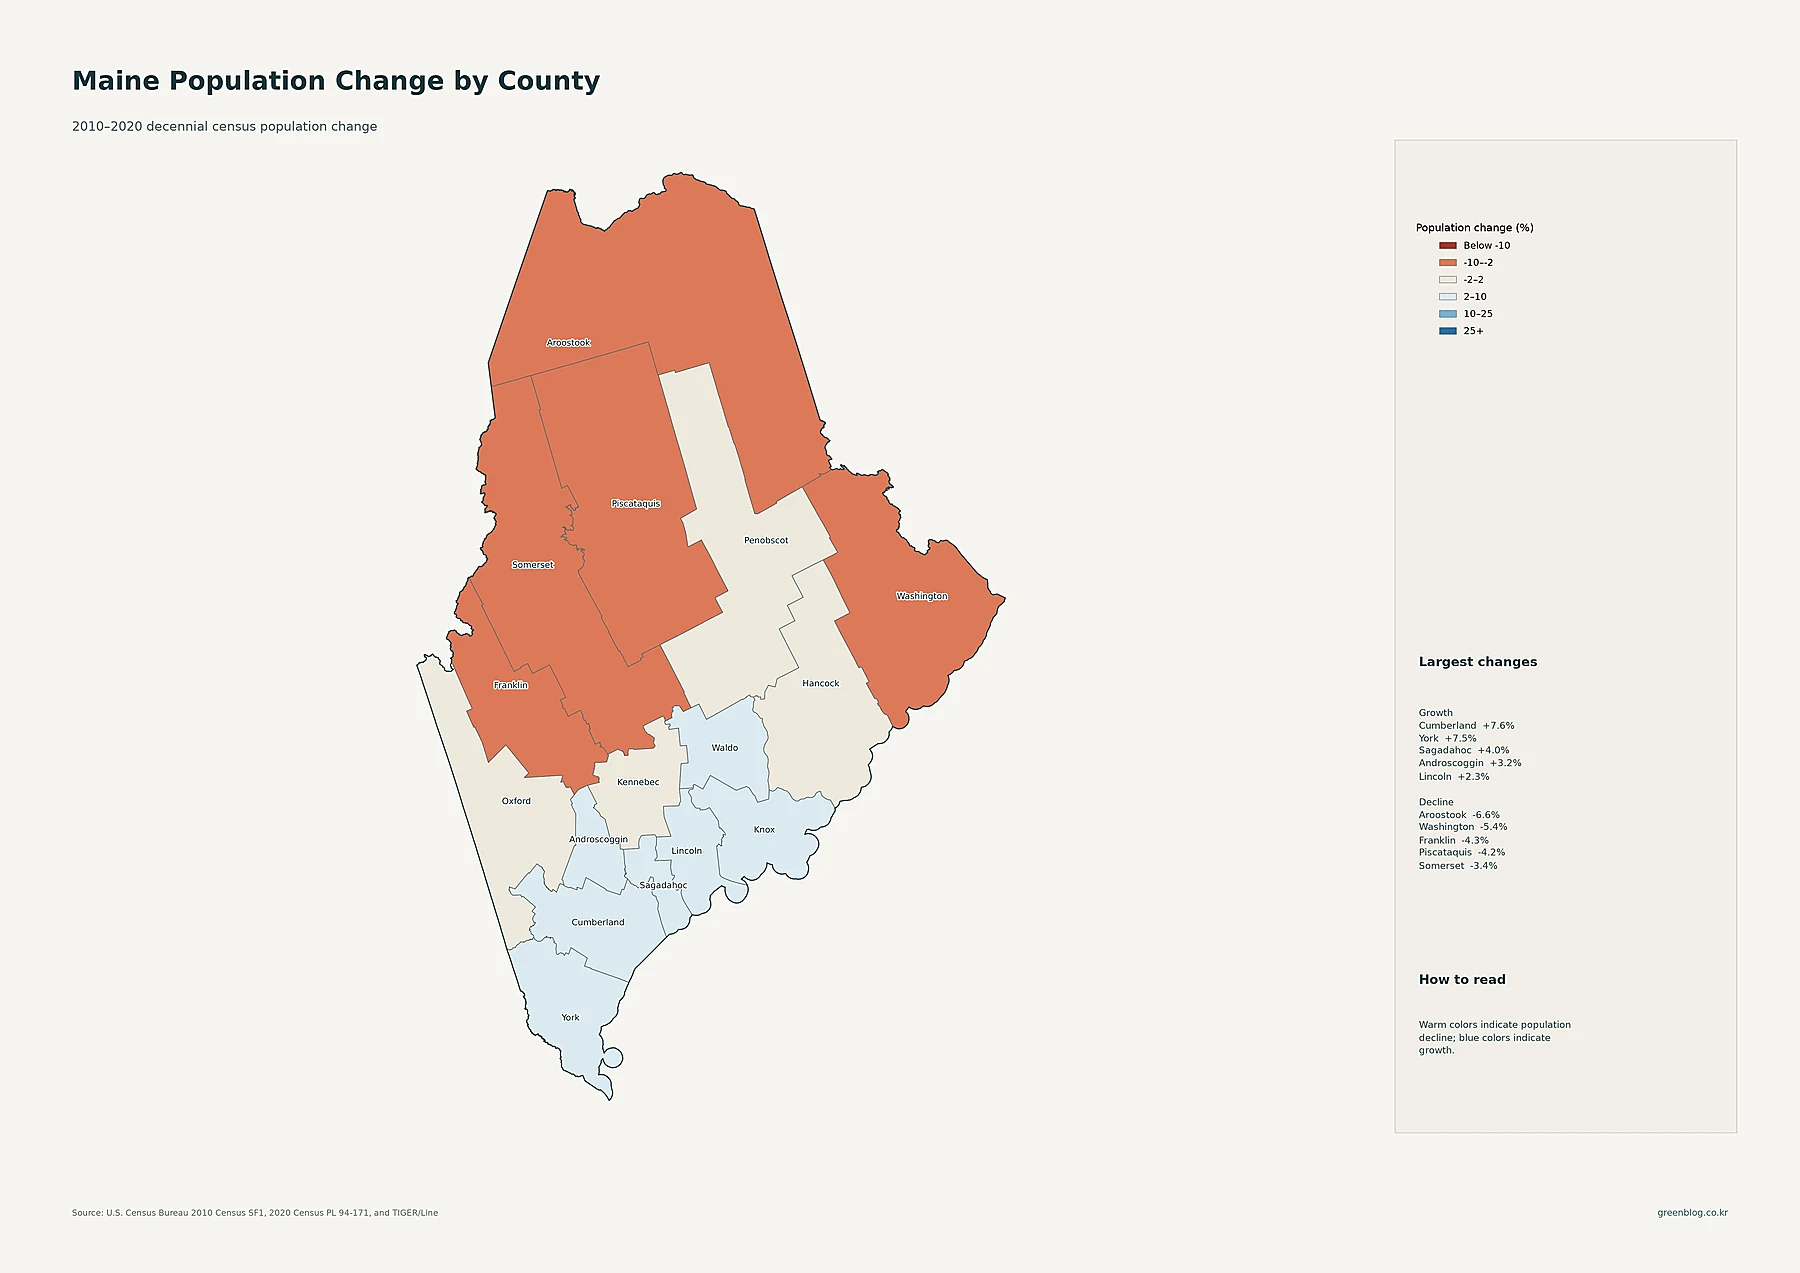
Cumberland County had the largest percentage increase at about 7.6%, with York very close at 7.5%. Sagadahoc grew about 4.0%, Androscoggin 3.2%, Lincoln 2.3%, Knox 2.2%, Waldo 2.1%, Hancock 1.9%, and Kennebec 1.2%. The growth side of the map is concentrated mostly in southern and coastal counties. These percentages should not be mixed with the 2024 population estimates, because they measure change between two decennial census counts rather than current population size.
Aroostook County recorded the largest decline at about 6.6%. Washington fell about 5.4%, Franklin 4.3%, Piscataquis 4.2%, Somerset 3.4%, and Penobscot 1.1%. Oxford was nearly flat at about -0.1%. The warm colors spread across much of the north, east, and western interior, contrasting with the blue growth counties in the south. The map supports the direction and magnitude of change, but it does not by itself establish why a county gained or lost population, so causal explanations should not be inferred from these colors alone.
Reading Maine correctly means separating where the most people live from where they live most densely
Cumberland is unusual because it leads the current county population, county density, and 2010–2020 growth rate at the same time. Other counties make the distinction clearer. Penobscot has 154,710 residents, the third-largest total, but averages only about 46 people per square mile. Sagadahoc has just 37,285 residents yet averages about 147 people per square mile, placing it near the top of the density ranking. A large population total does not automatically create a high density when the land area is also large.
For practical use, start with the place map to locate Portland, Lewiston–Auburn, Bangor, Augusta–Waterville, and other centers. Then use the tract map to see which parts of those areas contain the strongest concentration. The county-population map compares the size of all 16 administrative units, while the county-density map shows how sharply the southern counties differ from the sparse north and interior. Finally, the 2010–2020 change map adds a time dimension, showing that the strongest current southern concentration also overlaps several growth counties while many sparse northern and interior counties lost population during that decade. Together the maps provide a more useful picture than any single statewide average.
Download the Maine population map collection
The ZIP collection includes detailed census-tract density, major cities and urban areas, county population totals, 2010–2020 county change, and county population density.
FAQ
Which Maine county has the largest population and the highest density?
Cumberland County leads both measures in the supplied 2024 ACS data. It has 308,827 residents and an average density of about 369 people per square mile. Population and density are still separate measures even though the same county ranks first in this case.
Which Maine county grew fastest from 2010 to 2020?
Cumberland County had the largest percentage increase at about 7.6%, followed very closely by York County at 7.5%. Aroostook had the largest decline at about 6.6% over the same decennial-census interval.
Why does Maine’s statewide average density hide major differences?
The statewide average is about 45 people per square mile, but Cumberland is near 369 while Piscataquis is only about 4.4. Census-tract detail also shows dense urban pockets around Portland, Lewiston–Auburn, Bangor, and other centers inside a state dominated by much lighter rural tracts.
Related Maps
Sources
- U.S. Census Bureau — American Community Survey (ACS): 2024 ACS 5-year population estimates.
- U.S. Census Bureau — TIGER/Line Shapefiles: 2024 county, census tract, and place geography used in the maps.
- U.S. Census Bureau — Decennial Census: 2010 and 2020 county population counts used for the change comparison.
Green Map creates custom-edited map images using open geographic data sources such as geoBoundaries, Natural Earth, OpenStreetMap, and government open data.
These maps are edited visual materials, not raw data files, and are provided for education, documents, presentations, and graphic reference.