Louisiana’s population pattern is far more concentrated than the statewide average suggests. The supplied 2024 ACS 5-year data put the state population at 4,611,961. The county-density map reports about 43,213 square miles of land and an average density of roughly 107 people per square mile. On the maps, however, the strongest concentrations sit around New Orleans and Jefferson Parish, Baton Rouge in East Baton Rouge Parish, and Lafayette. Shreveport–Bossier City in the northwest, Lake Charles in the southwest, Monroe in the north, and Alexandria near the center form additional urban clusters separated by much lower-density territory. Louisiana uses parishes as its county-equivalent units, and the supplied dataset contains all 64.
The five maps answer different questions. Proportional circles on the city and parish-population maps compare total residents; they do not measure density. The census-tract and parish-density maps use color to show people per square mile. The population-change map uses 2010 and 2020 Decennial Census counts rather than the 2024 ACS estimates. That distinction matters: East Baton Rouge currently has the largest parish population, Orleans has the highest parish-level density, and St. Bernard posted the fastest percentage growth between 2010 and 2020. Those statements describe three different measurements rather than competing rankings.
Table of Contents
The tract map reveals dense New Orleans, Baton Rouge, and Lafayette cores inside much broader low-density areas
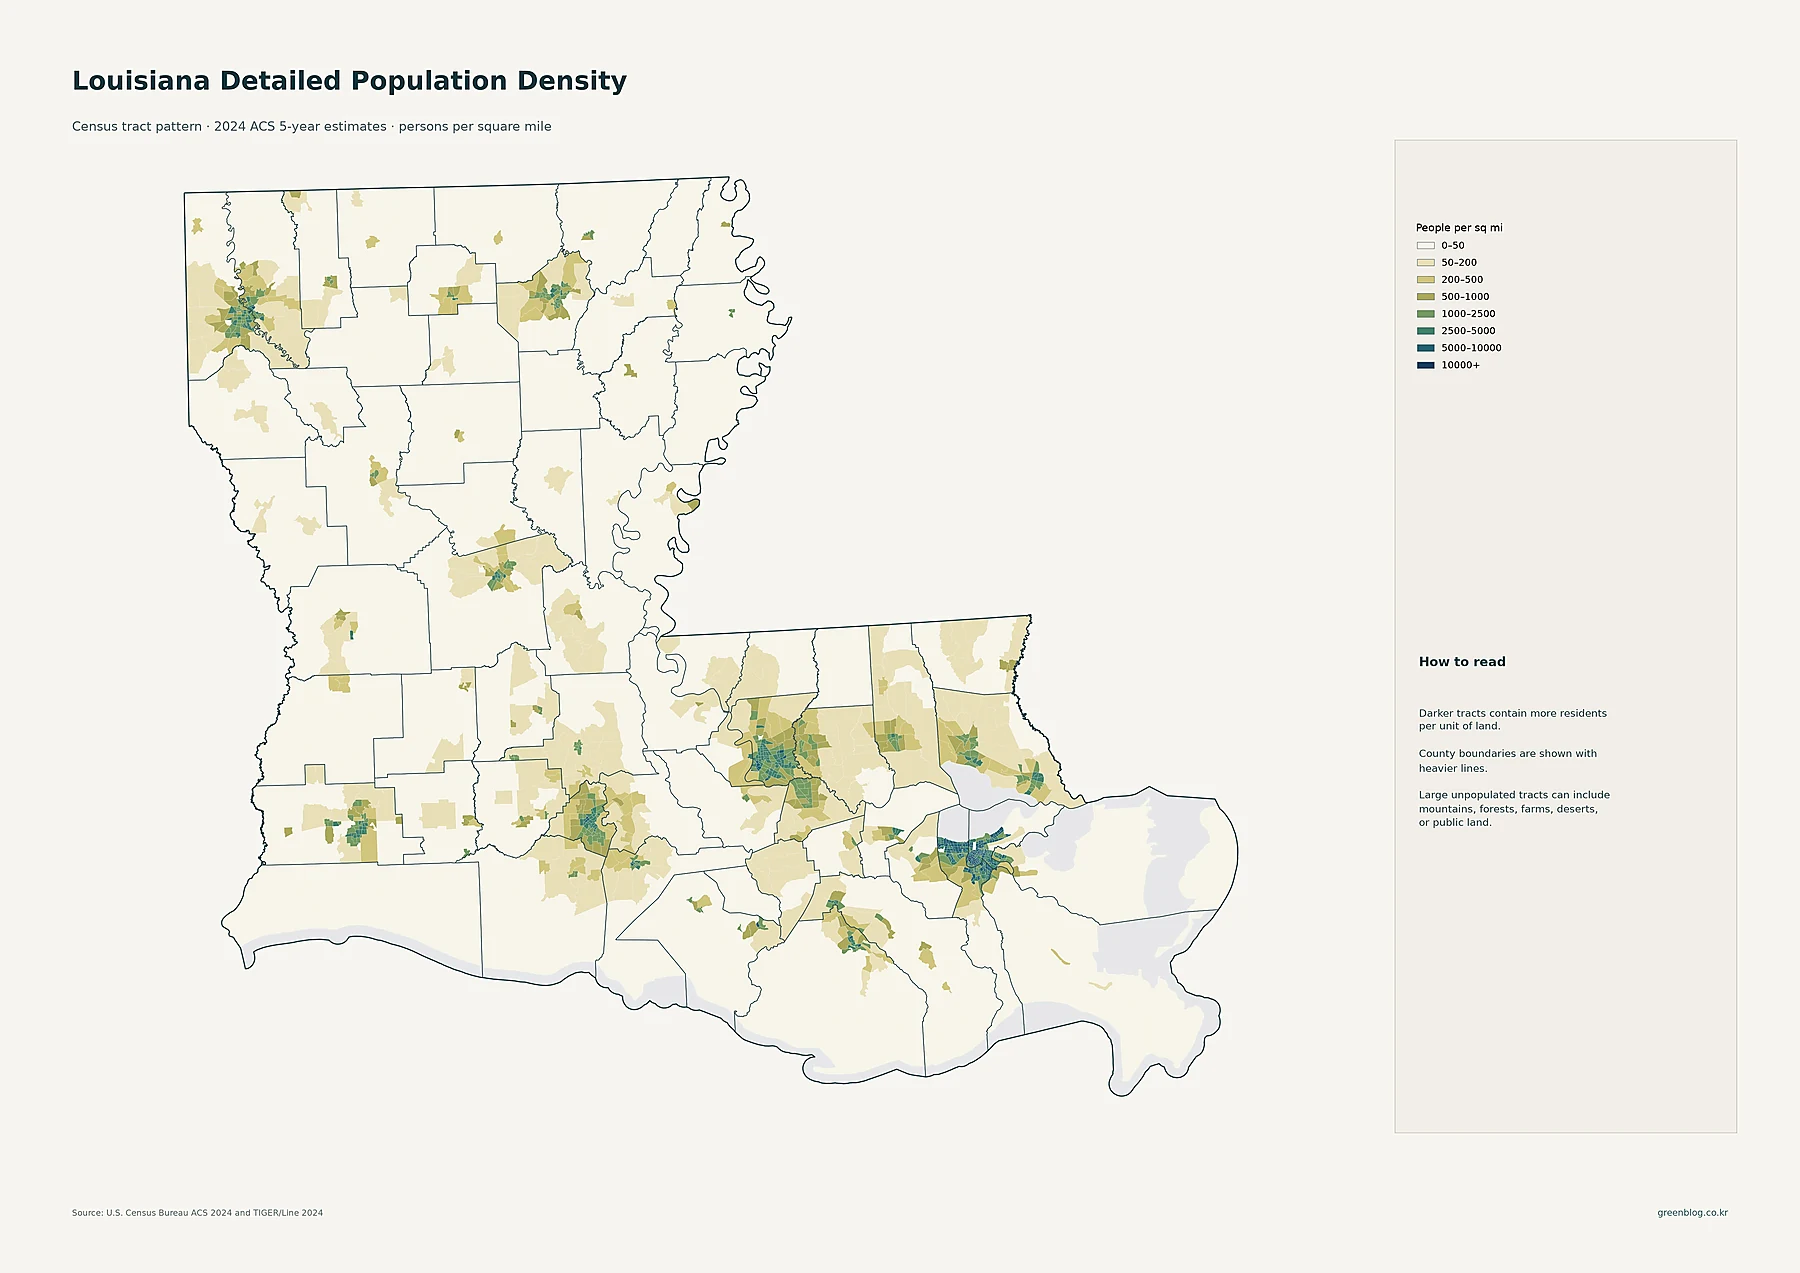
The darkest and most extensive cluster is in southeastern Louisiana around New Orleans. Orleans and Jefferson contain many tracts in the higher legend classes, including areas above 2,500 and 5,000 people per square mile, with urbanized tracts continuing toward neighboring St. Charles, St. John the Baptist, and parts of St. Tammany. Farther northwest, Baton Rouge creates another broad concentration. Dense tracts in East Baton Rouge sit close to developed areas in Ascension, Livingston, and West Baton Rouge, making the capital region stand out as a second major population focus.
Lafayette forms a distinct high-density patch in south-central Louisiana. Lake Charles, Shreveport–Bossier City, Monroe, and Alexandria appear as smaller but clearly visible urban islands against lighter surrounding tracts. Large rural sections of northern and central Louisiana and extensive coastal areas remain in the lowest categories, especially where few developed tracts interrupt broad low-density territory. This is why the tract map is useful even after seeing parish averages: it shows exactly where residents are concentrated within a parish instead of assigning one density value to the entire administrative unit.
New Orleans is the largest census place, while Baton Rouge and Shreveport anchor separate urban centers
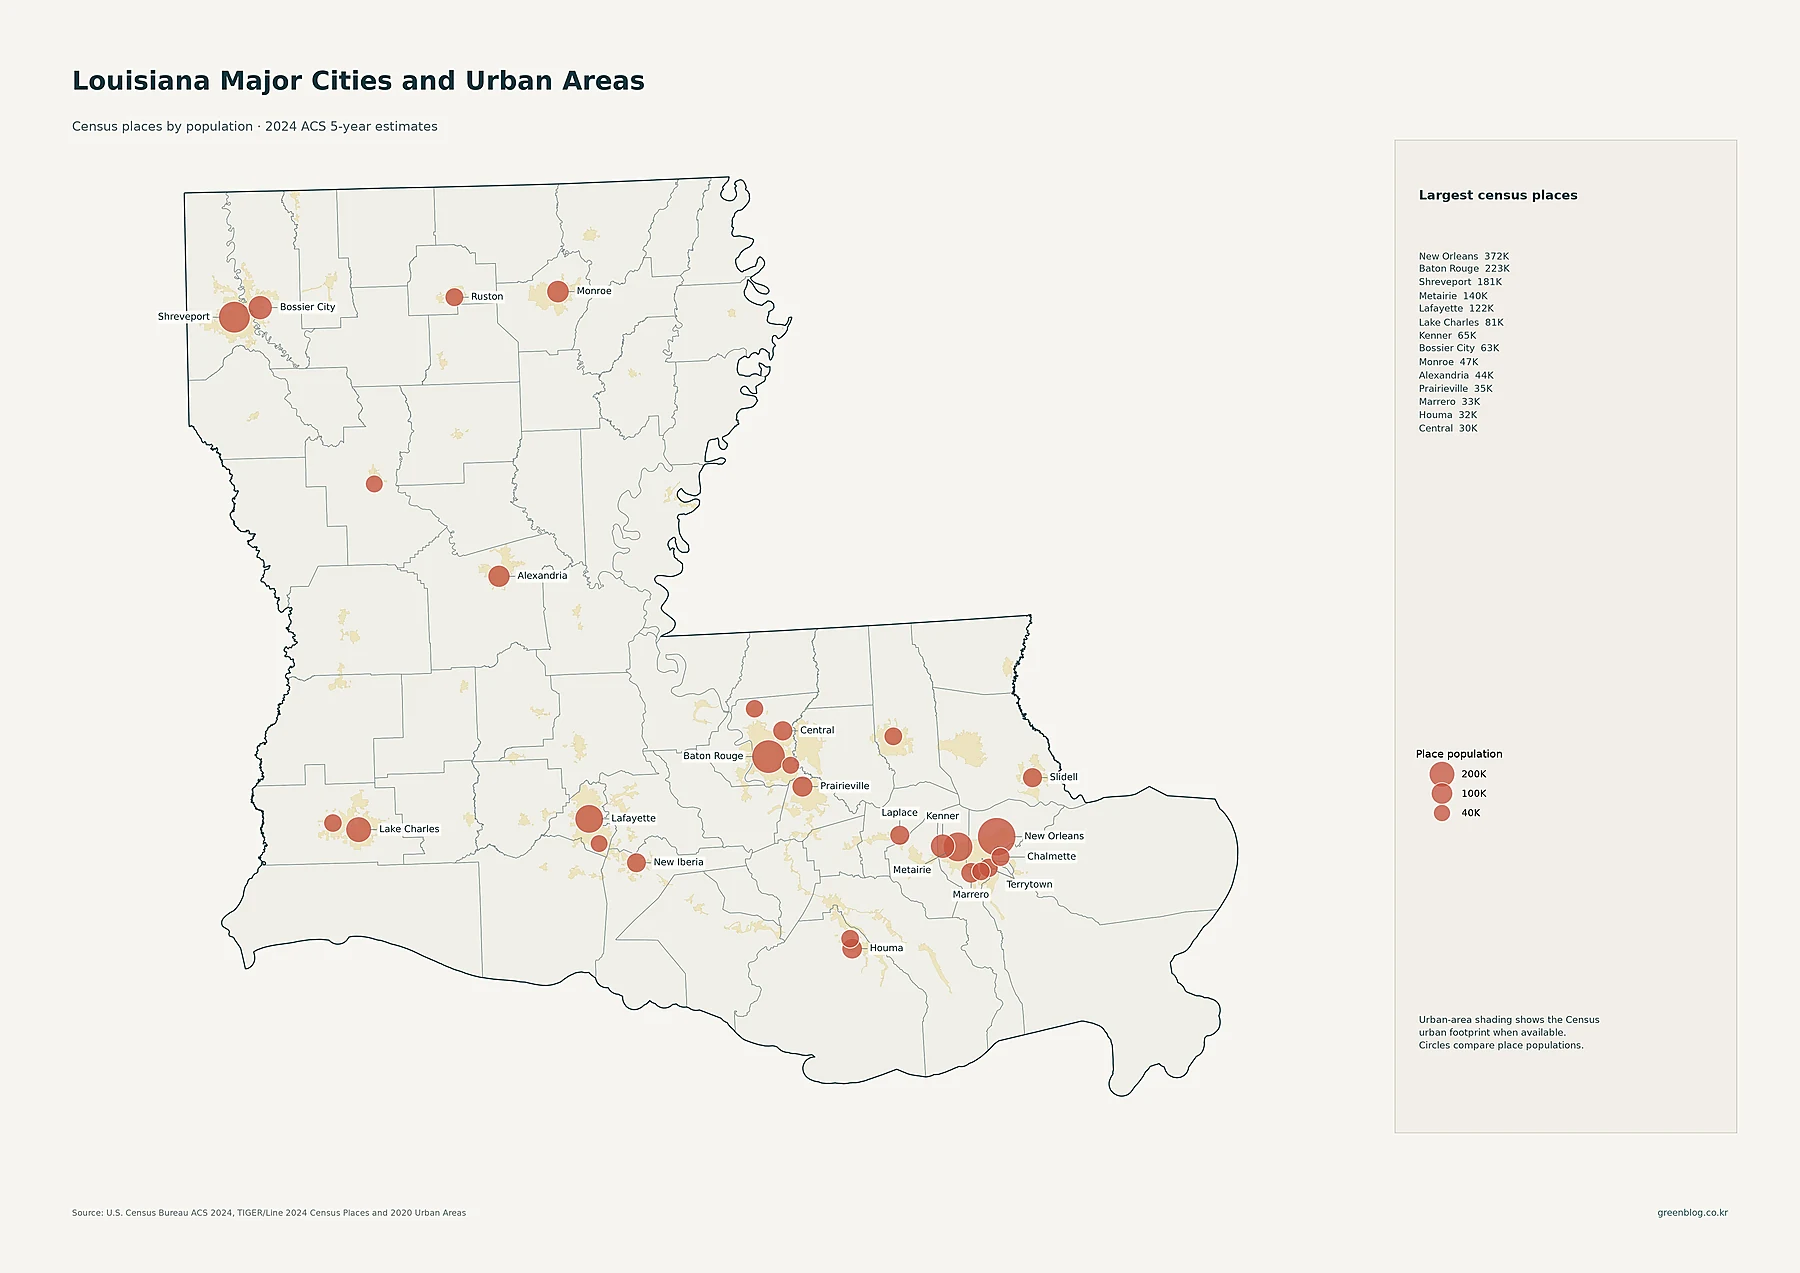
New Orleans is the largest census place in the supplied table at 371,853 residents. Baton Rouge has 222,771, Shreveport 180,982, Metairie 139,729, and Lafayette 121,715. The next tier includes Lake Charles at 81,143, Kenner at 64,904, Bossier City at 62,901, Monroe at 47,004, and Alexandria at 44,060. Prairieville has 35,238 residents, Marrero 32,540, Houma 32,392, Central 29,783, Slidell 28,561, Laplace 28,343, and New Iberia 27,571. The largest-circle list on the map makes the dominance of the top five places immediately visible.
Location matters as much as rank. New Orleans, Metairie, Kenner, Marrero, Terrytown, and Chalmette form a tight southeastern cluster. Baton Rouge, Central, and Prairieville create another group farther northwest. Lafayette and New Iberia occupy south-central Louisiana, Lake Charles anchors the southwest, Shreveport and Bossier City sit together in the northwest, and Monroe and Ruston form northern centers. The circles should not be read as a density scale. A large circle means a place has more residents, while the actual concentration of those residents is better evaluated with the tract-density map.
East Baton Rouge leads parish population, followed by Jefferson and Orleans
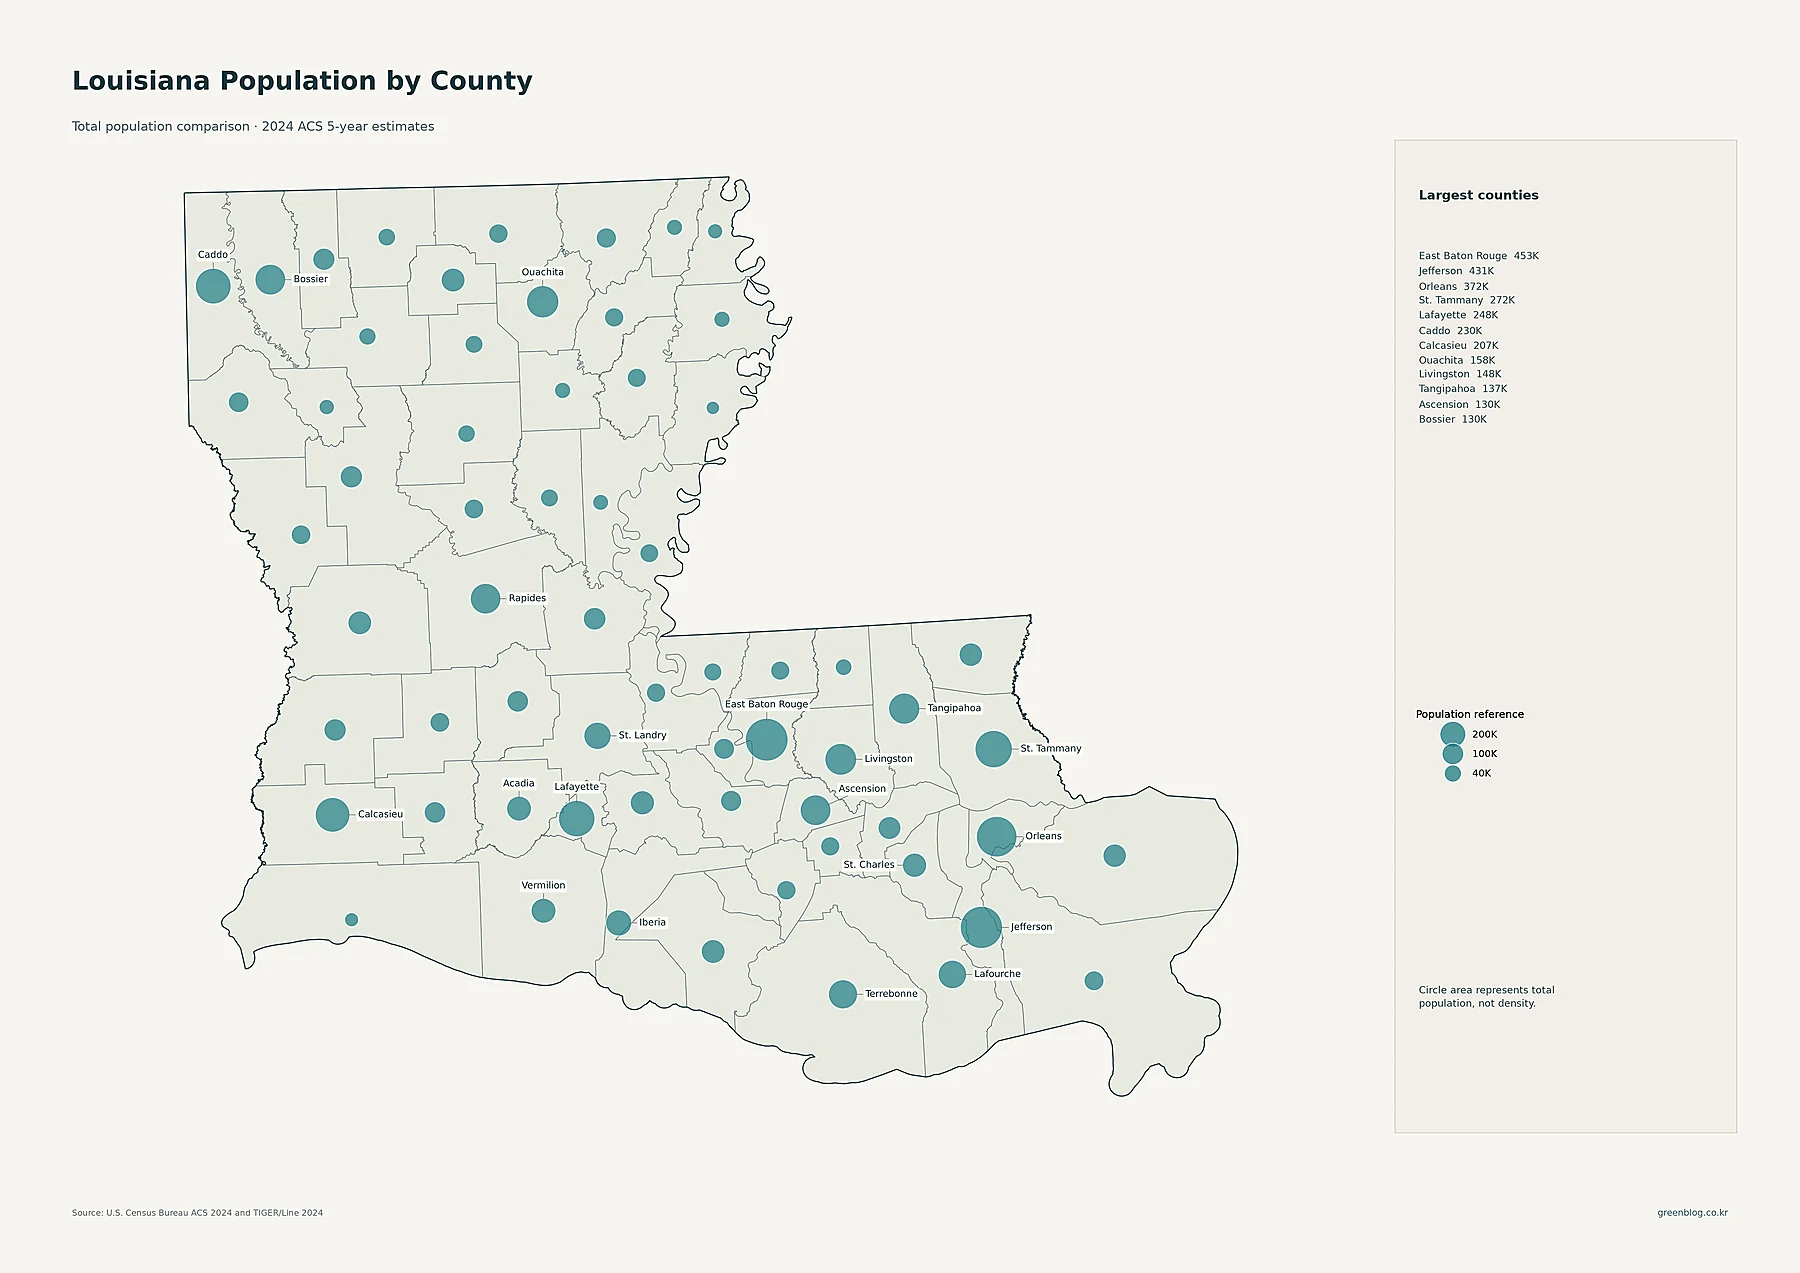
East Baton Rouge Parish has the largest current population at 452,938. Jefferson Parish follows at 430,920 and Orleans at 371,853. St. Tammany has 272,421 residents, Lafayette 247,997, Caddo 230,004, and Calcasieu 207,088. Ouachita has 158,480, Livingston 148,115, Tangipahoa 136,738, Ascension 130,314, Bossier 129,789, and Rapides 127,527. The map therefore shows a chain of large circles in southeastern Louisiana and around the capital region, plus notable regional centers in the southwest, northwest, and north.
Parish totals are not interchangeable with city totals. East Baton Rouge Parish’s 452,938 residents include far more people than the Baton Rouge census-place count of 222,771. Caddo Parish’s 230,004 includes Shreveport and residents outside the city, while Calcasieu’s 207,088 includes Lake Charles and the rest of the parish. Large total population also does not guarantee high density. A geographically large parish may hold many residents while still averaging far fewer people per square mile than a compact urban parish.
Orleans and Jefferson have the highest parish densities, with a sharp contrast to rural Louisiana
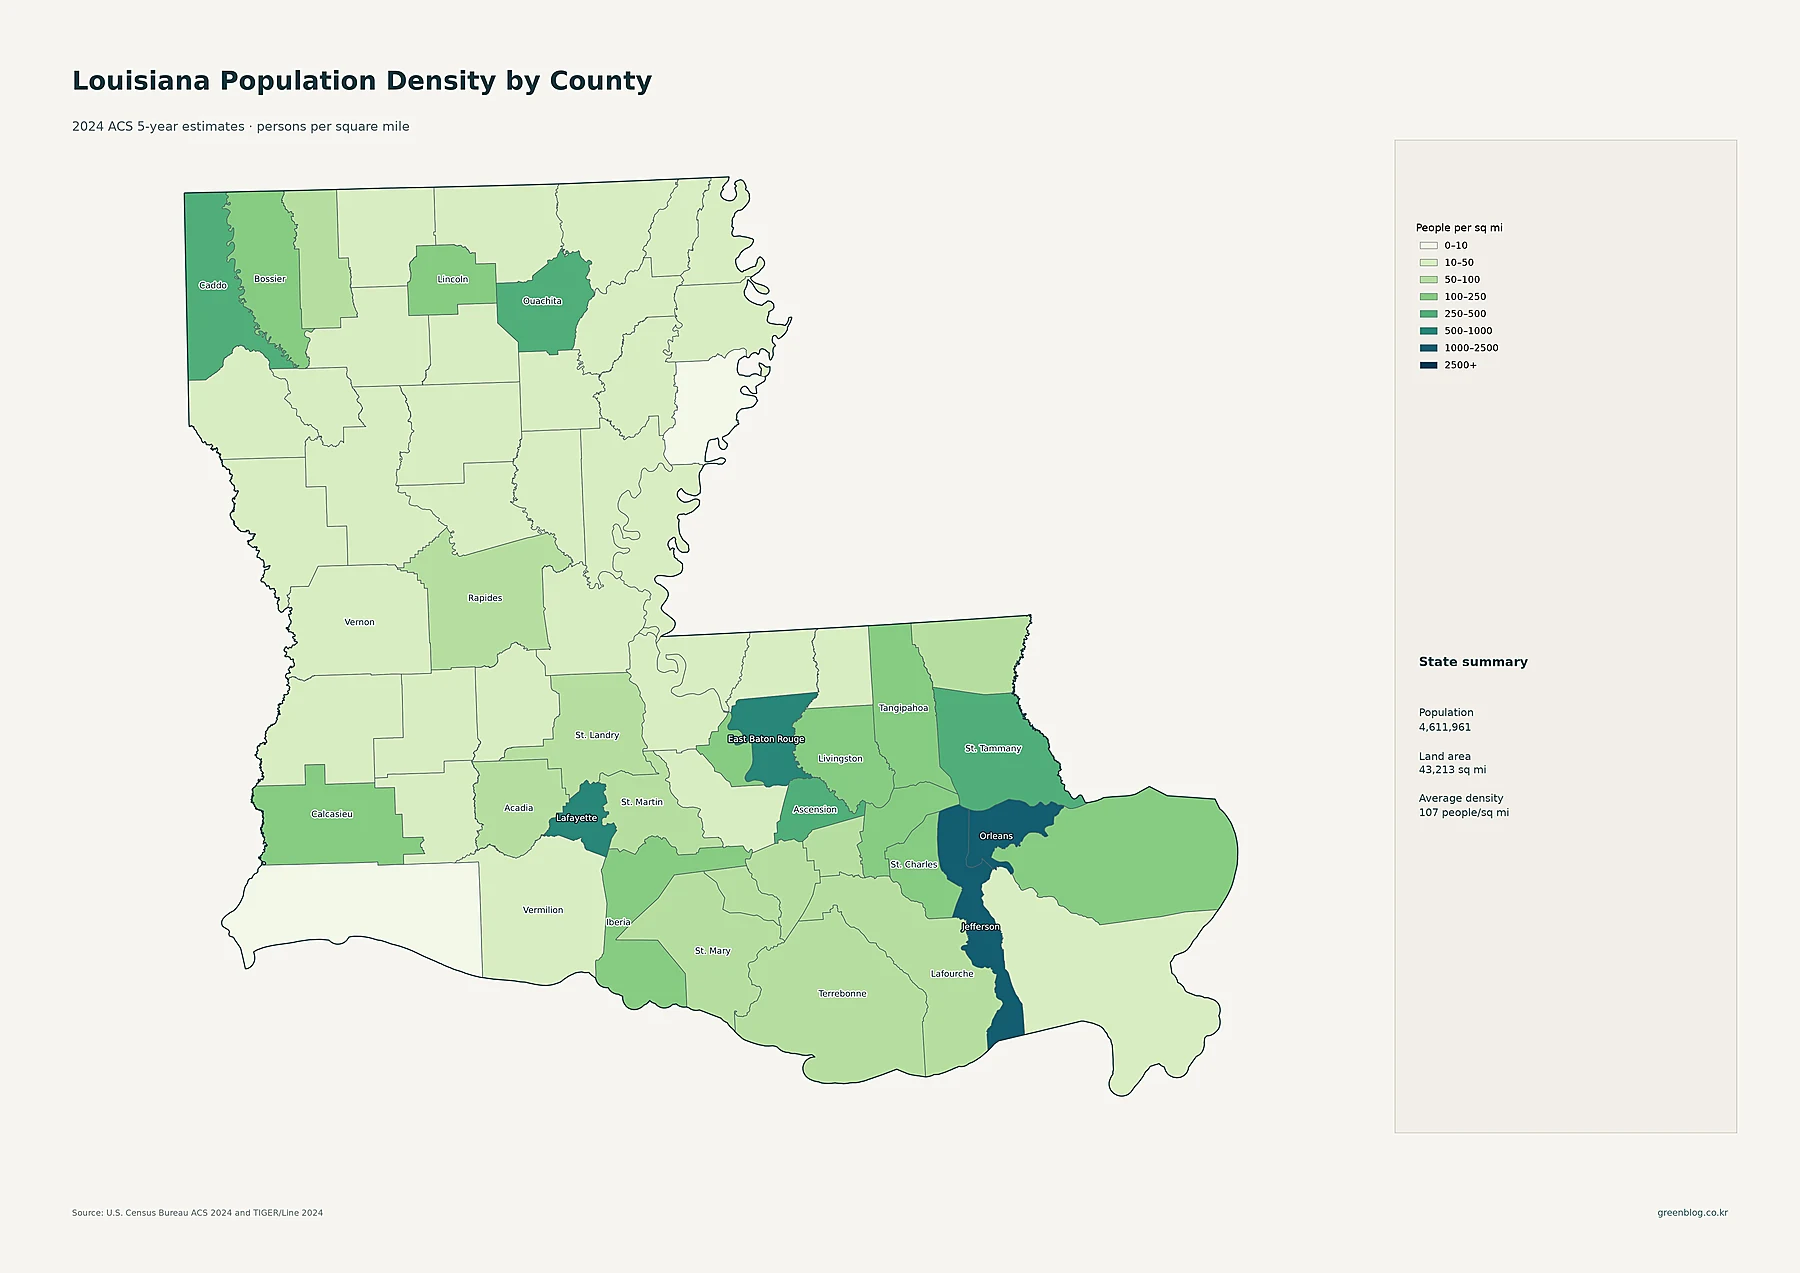
Orleans Parish ranks first at about 2,194 people per square mile. Jefferson is second at roughly 1,432. East Baton Rouge averages about 994, Lafayette 923, Ascension 449, and St. Tammany 322. Caddo is about 262, Ouachita 260, Livingston 229, and Calcasieu 195. St. John the Baptist is about 190, St. Charles 185, Tangipahoa 173, Bossier 155, and West Baton Rouge 145. The darkest county-equivalent shading is therefore concentrated in the New Orleans region, with East Baton Rouge and Lafayette also standing out strongly.
The low-density end is dramatically different. Cameron Parish averages only about 3.9 people per square mile and Tensas about 6.5. Catahoula is near 12.1, Winn 14.2, Madison 15.2, Bienville 15.6, East Carroll 16.8, Caldwell 17.9, Claiborne 18.3, and Red River 19.1. Louisiana’s statewide average of roughly 107 therefore combines places above 2,000 with places below 10. The parish map is the right tool for administrative comparisons, while the census-tract map shows how compact towns and urban neighborhoods can exist inside a parish whose overall average is much lower.
| Measure | Leading area | Value in the supplied data |
|---|---|---|
| State population | Louisiana | 4,611,961 |
| Largest parish population | East Baton Rouge | 452,938 |
| Highest parish density | Orleans | about 2,194/sq mi |
| Fastest 2010–2020 growth | St. Bernard | +21.9% |
| Largest 2010–2020 decline | Tensas | -21.0% |
St. Bernard and Ascension led 2010–2020 growth, while several northern and central parishes declined sharply
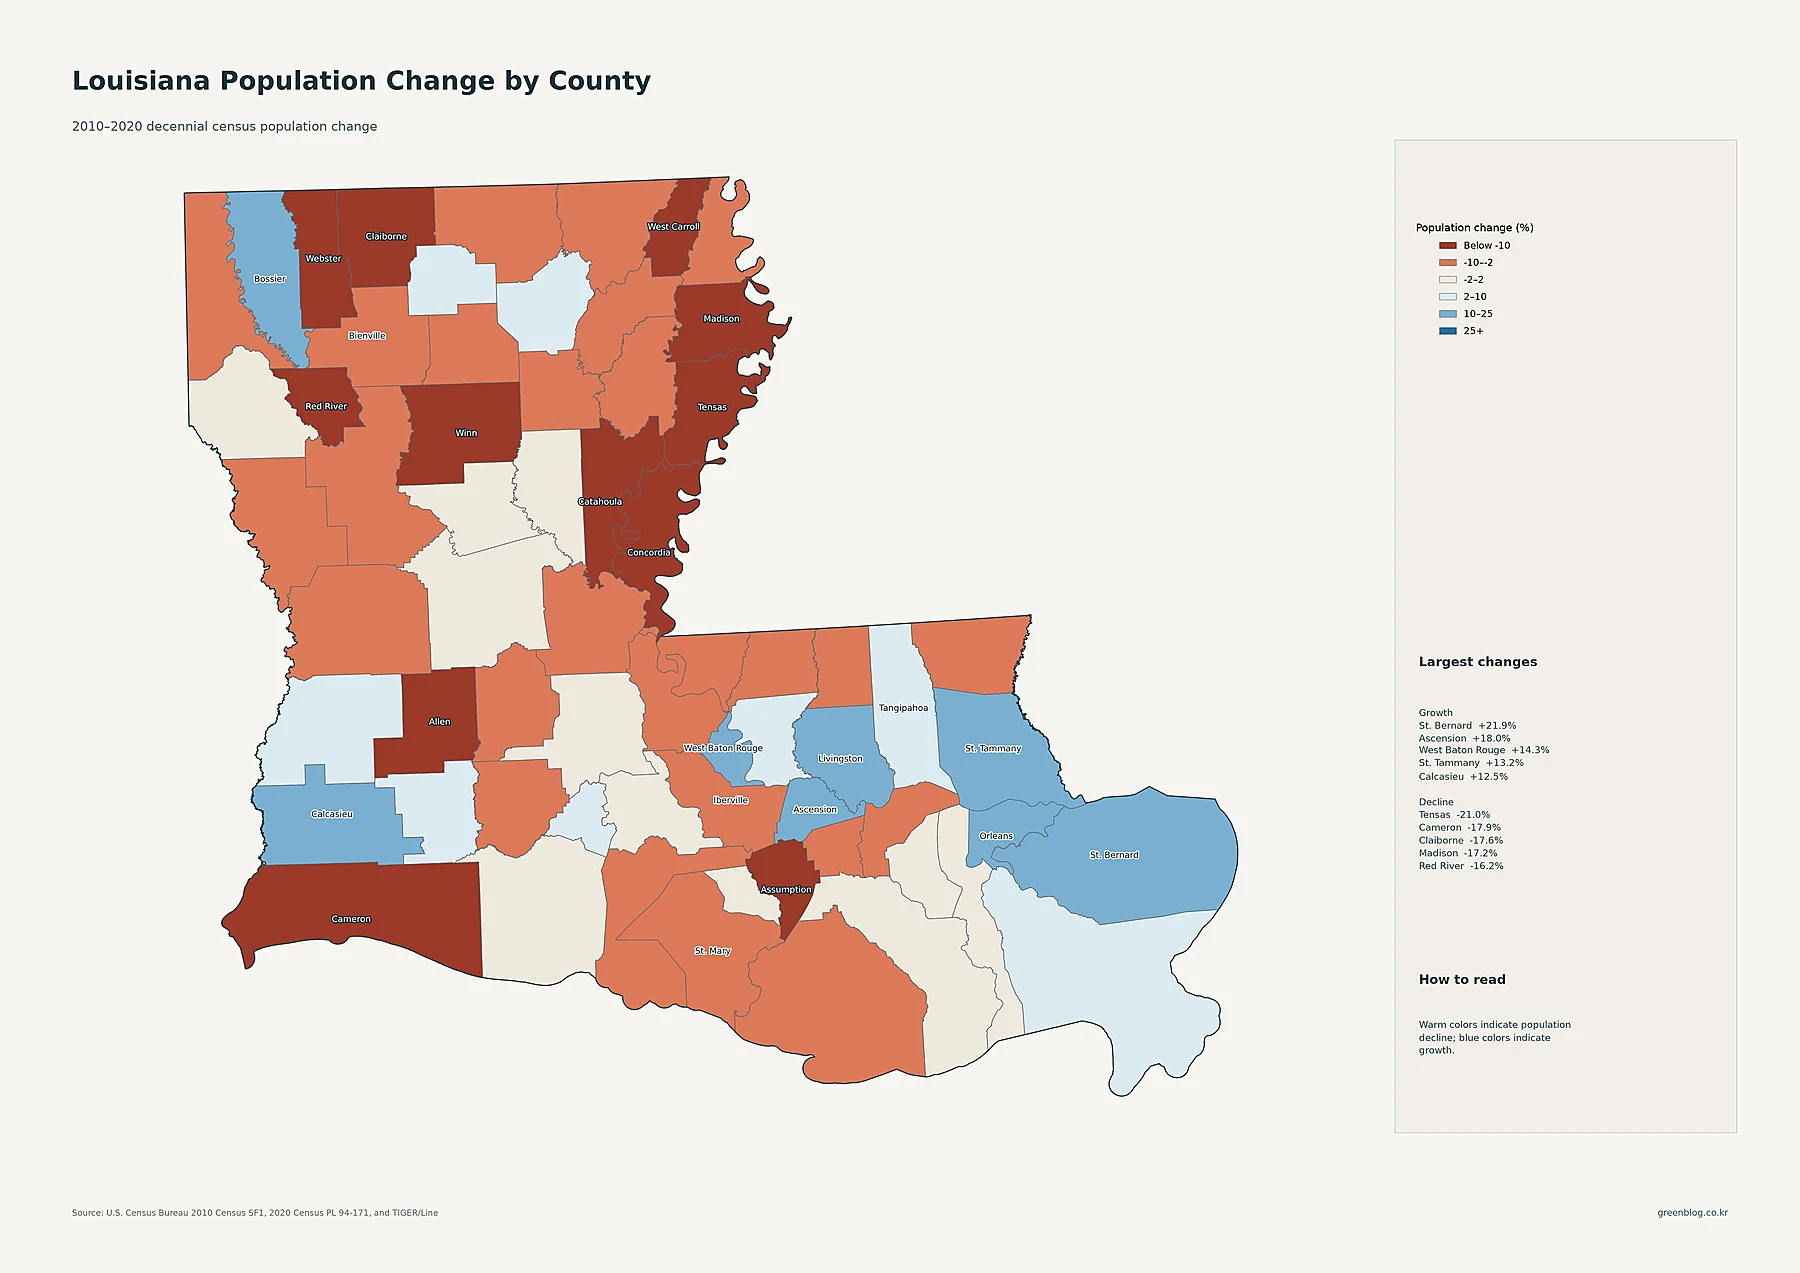
St. Bernard Parish recorded the largest percentage increase at about 21.9%. Ascension grew 18.0%, West Baton Rouge 14.3%, St. Tammany 13.2%, Calcasieu 12.5%, Orleans 11.7%, Livingston 11.1%, Bossier 10.1%, Tangipahoa 10.0%, and Lafayette 9.1%. The blue areas are not confined to one part of the state: growth appears east of New Orleans in St. Bernard, around Baton Rouge in Ascension, Livingston, and West Baton Rouge, north of Lake Pontchartrain in St. Tammany, in Calcasieu in the southwest, and in Bossier in the northwest.
Tensas Parish had the largest decline at about 21.0%. Cameron fell 17.9%, Claiborne 17.6%, Madison 17.2%, Red River 16.2%, West Carroll 16.0%, and Catahoula 14.4%. Allen declined 11.7%, Webster 10.3%, Concordia 10.3%, and both Winn and Assumption about 10.2%. Warm colors cover many northern and east-central parishes, while Cameron stands out as a major decline in the far southwest. The map establishes the direction and size of population change between two census years; it does not identify the causes of those gains or losses.
Population size, density, and decade change produce three different parish rankings
East Baton Rouge is the clearest example of why the measures should be separated. It has the largest current parish population, yet Orleans and Jefferson are denser. Orleans ranks third in total population but first in density, while Jefferson ranks second on both measures. Lafayette combines a population of nearly 248,000 with about 923 people per square mile, which is why its urban concentration remains visible on both the parish and tract maps. These current measures explain where Louisiana’s major concentrations are now.
Decade change shifts the ranking again. St. Bernard, with a current population of 44,419, is nowhere near the top of the total-population list, yet it had the fastest 2010–2020 percentage growth. Ascension combines a current population of 130,314, density near 449 per square mile, and growth of about 18.0%, making it notable on all three dimensions without leading any current size ranking. Tensas, by contrast, has only 3,935 residents, density near 6.5, and a 21.0% decade decline. For practical use, the city map locates major population centers, the parish-circle map compares resident totals, the tract and parish-density maps show concentration, and the change map adds the time dimension. Together, they show a state dominated by southeastern and regional urban clusters but marked by wide differences in both current density and past population direction.
Download the Louisiana population map collection
The ZIP collection includes detailed census-tract density, major cities and urban areas, parish population totals, 2010–2020 parish change, and parish population density.
FAQ
Is Louisiana’s most populous parish also its most densely populated?
No. East Baton Rouge has the largest population in the supplied 2024 ACS data at 452,938, while Orleans has the highest average density at about 2,194 people per square mile. Jefferson ranks second in both population and density.
Which Louisiana parish grew fastest from 2010 to 2020?
St. Bernard Parish had the largest percentage increase at about 21.9%. Ascension grew 18.0%, West Baton Rouge 14.3%, St. Tammany 13.2%, and Calcasieu 12.5%. These percentages compare the 2010 and 2020 Decennial Census.
Why is Louisiana’s statewide average density not enough to describe where people live?
The statewide average is about 107 people per square mile, but Orleans is near 2,194 while Cameron is about 3.9 and Tensas about 6.5. Parish averages and census-tract detail reveal a much wider urban-rural contrast than a single statewide number can show.
Related Maps
Sources
- U.S. Census Bureau — American Community Survey (ACS): 2024 ACS 5-year population estimates.
- U.S. Census Bureau — TIGER/Line Shapefiles: 2024 parish, census tract, and place geography used in the maps.
- U.S. Census Bureau — Decennial Census: 2010 and 2020 parish population counts used for the change comparison.
Green Map creates custom-edited map images using open geographic data sources such as geoBoundaries, Natural Earth, OpenStreetMap, and government open data.
These maps are edited visual materials, not raw data files, and are provided for education, documents, presentations, and graphic reference.