Kansas has a statewide average population density of only about 36 people per square mile, but that number hides one of the clearest urban-rural contrasts in the supplied map set. The 2024 ACS 5-year estimate gives the state a population of 2,947,197 across about 81,759 square miles of land. Much of western and west-central Kansas is lightly settled, while the Kansas City side of the state and the Wichita area form strong concentrations. Johnson and Wyandotte counties stand out in the east, Sedgwick County anchors south-central Kansas, and smaller urban clusters appear around Topeka, Lawrence, Manhattan, Junction City, Salina, Hutchinson, Garden City, and Dodge City.
The five maps measure different things and should not be read as interchangeable. The census-tract map shows how tightly residents are concentrated within small statistical areas. The major-cities map uses proportional circles for census-place population. The county population map also uses circle area, but there the circles compare total county residents. The county density map instead measures residents per square mile, while the 2010–2020 change map compares Decennial Census counts over a decade. A large circle therefore does not automatically mean high density, and a county with a large current population is not necessarily the county that grew fastest from 2010 to 2020.
Table of Contents
The tract map reveals two dominant concentrations: the Kansas City side and Wichita
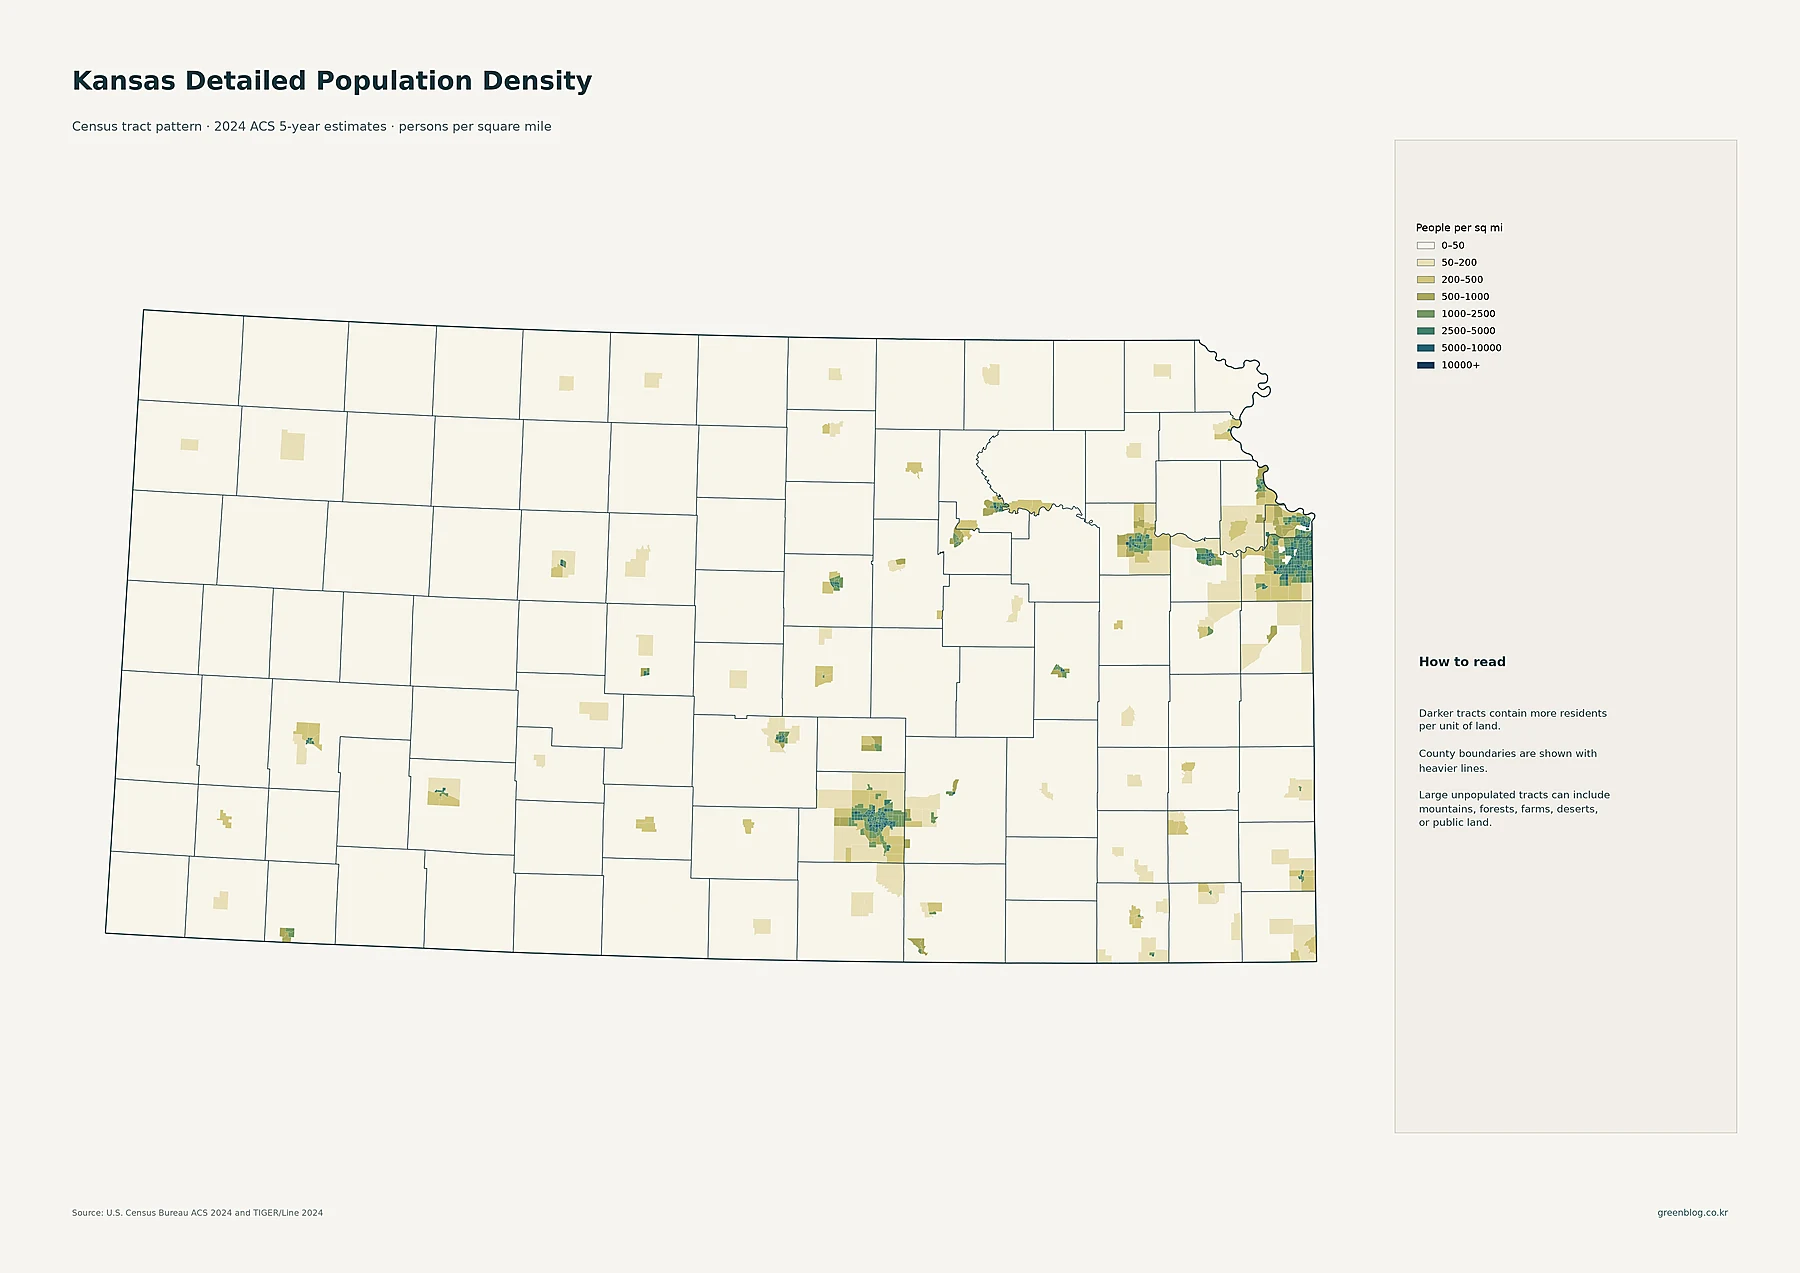
The detailed density legend ranges from fewer than 50 residents per square mile to 10,000 or more. The largest continuous concentration is along the eastern edge of Kansas in the Kansas City metropolitan area. Dense tracts in Johnson County cover communities such as Overland Park, Olathe, Shawnee, and Lenexa, while Wyandotte County adds the Kansas City core on the state line. Nearby Lawrence in Douglas County is visible as a separate dense cluster, and Leavenworth County adds another urbanized pocket to the north. At tract scale, this part of the state looks much more continuously settled than the broad rural areas farther west.
Wichita forms the other major concentration. A broad group of darker tracts spreads across Sedgwick County, with nearby suburban places adding to the south-central cluster. Topeka in Shawnee County is clearly visible, as are Manhattan and Junction City farther west along the northeastern part of the state. Salina, Hutchinson, and Emporia appear as smaller stand-alone density islands. In western Kansas, Garden City and Dodge City are visible population centers, but their dense tracts occupy relatively compact areas surrounded by large expanses in the lowest density classes. This is why the tract map is especially useful: it shows where settlement is concentrated inside counties rather than reducing each county to a single average.
Wichita is the largest census place, while several large cities cluster near Kansas City
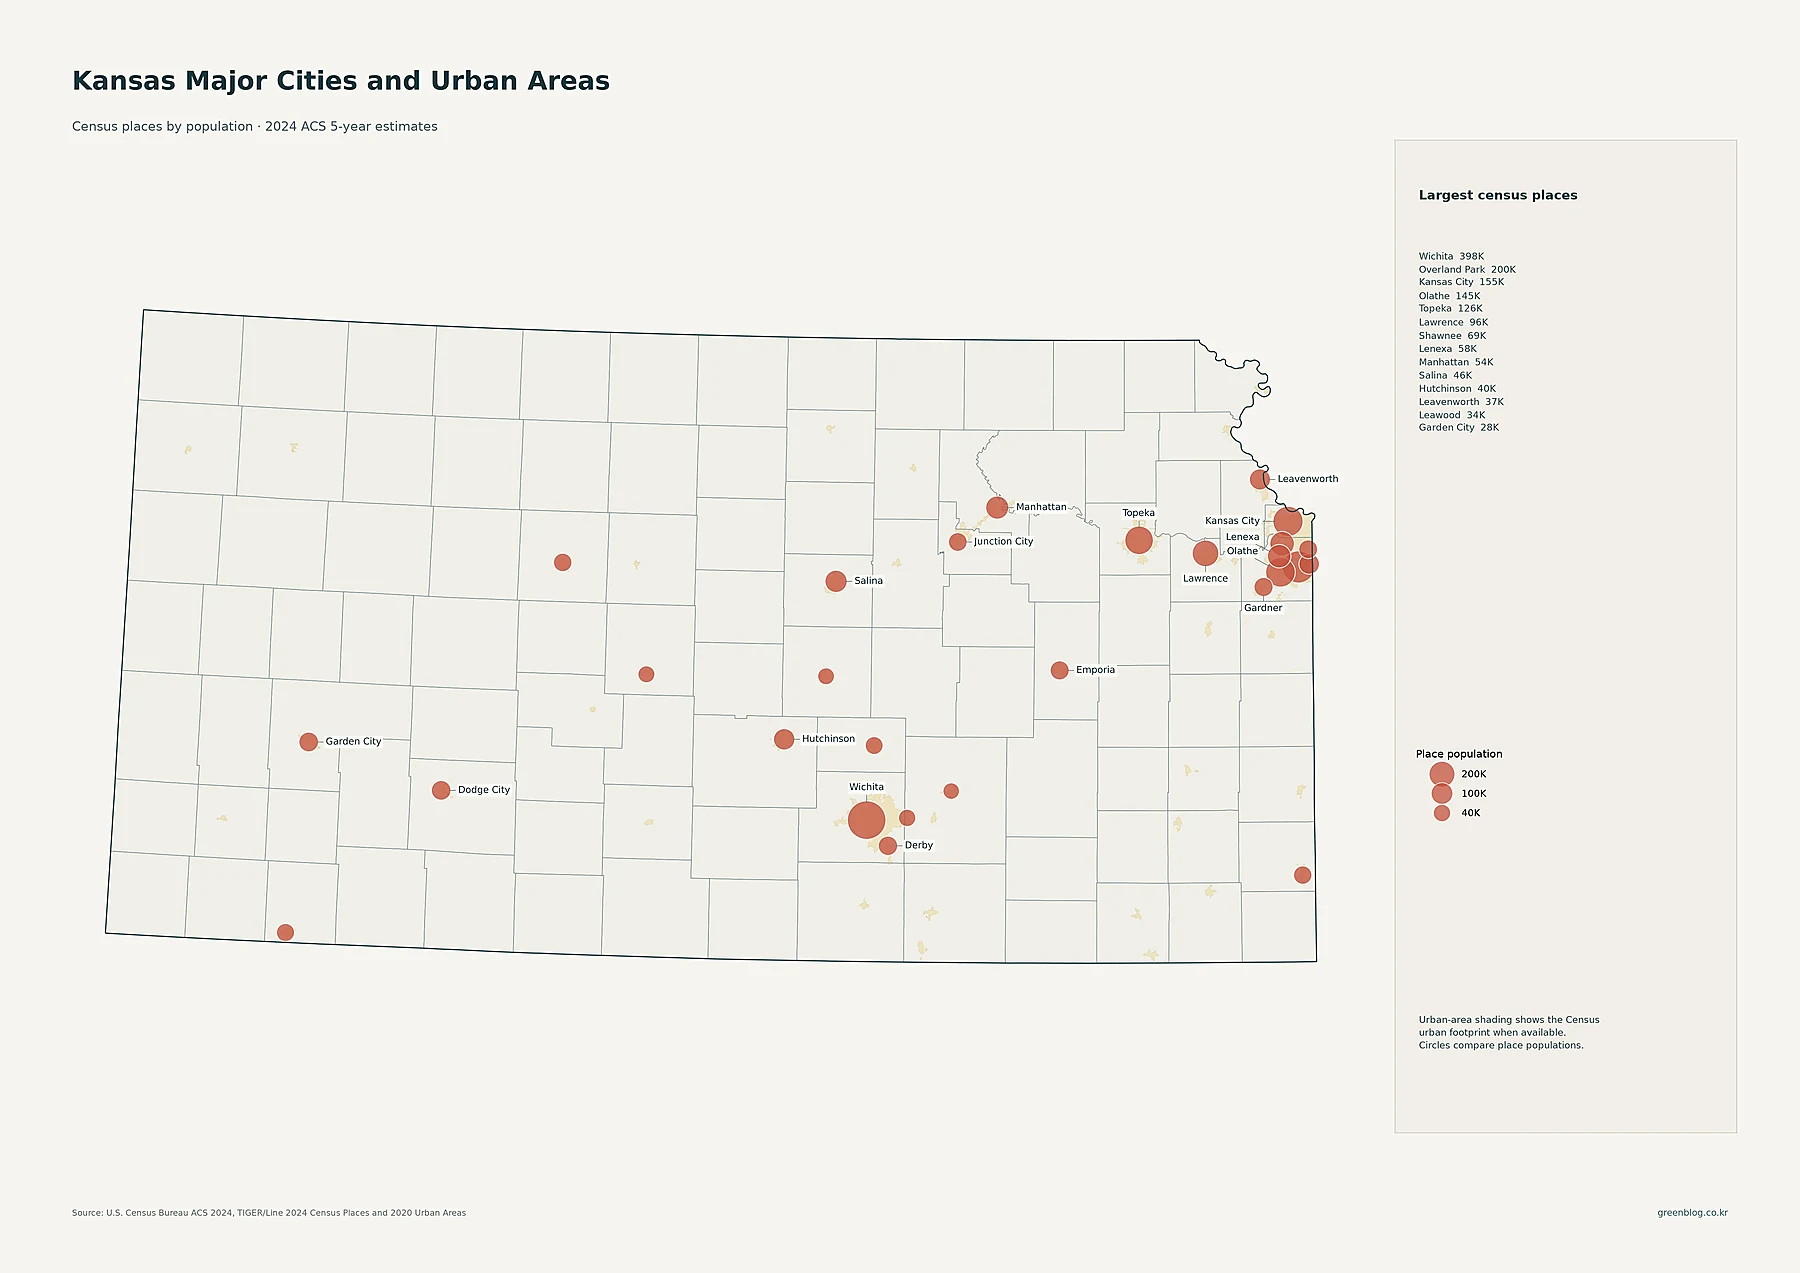
Wichita is the largest census place in the supplied data at 397,945 residents. Overland Park follows at 200,306, Kansas City at 155,135, Olathe at 145,057, and Topeka at 125,786. Lawrence has 96,051 residents, Shawnee 68,542, Lenexa 58,384, Manhattan 54,239, Salina 46,307, Hutchinson 39,709, Leavenworth 37,195, Leawood 33,809, and Garden City 27,819. Dodge City, Derby, Gardner, Emporia, and Junction City are also clearly visible on the map as regional centers.
The spatial arrangement matters as much as the rankings. Wichita is the single largest city, but the eastern edge contains several large places packed close together: Overland Park, Kansas City, Olathe, Shawnee, Lenexa, Leawood, and other suburbs all occupy the same broad metropolitan side of the state. That creates a different population pattern from western Kansas, where Garden City and Dodge City stand out as more isolated centers. The circles represent total place population, not the number of residents per square mile. To compare how concentrated those residents are within land area, the tract and county-density maps are the better measures.
Johnson and Sedgwick dominate county population totals
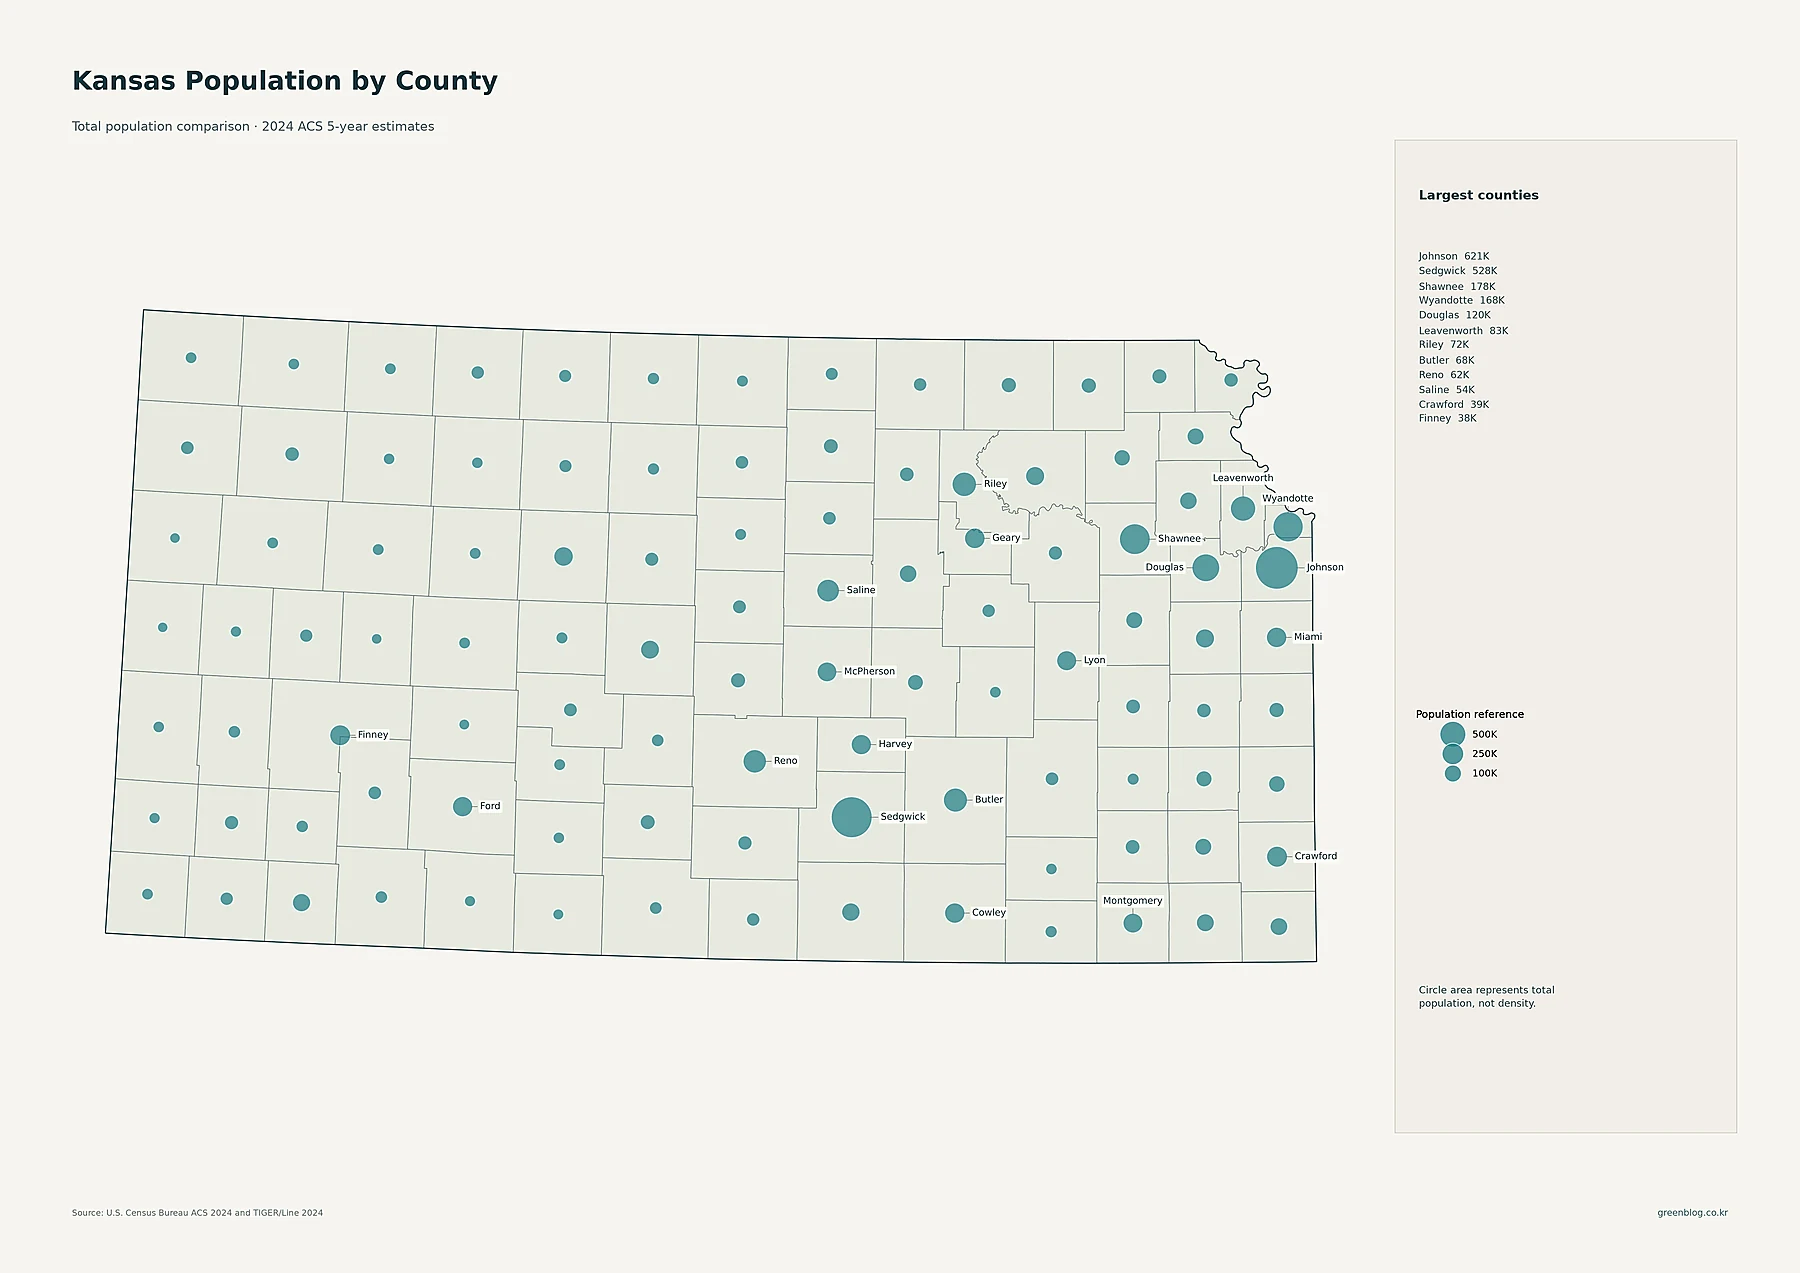
Johnson County has the largest 2024 ACS population at 620,631. Sedgwick County is second at 528,226. Those two are the only Kansas counties above half a million residents in the supplied dataset. Shawnee County has 178,025 residents, Wyandotte 167,654, and Douglas 120,302. Leavenworth has 83,123, Riley 71,946, Butler 68,287, Reno 61,553, and Saline 53,668. Crawford County has 39,008 residents, Finney 38,084, Geary 35,815, Miami 34,938, and Cowley 34,411.
The largest circles create a clear east-and-south-central structure. Johnson and Wyandotte sit on the Kansas City side, with Douglas and Leavenworth nearby. Shawnee County marks Topeka, while Riley and Geary identify the Manhattan-Junction City area. Sedgwick is the dominant circle in south-central Kansas, and Butler and Reno are substantial neighboring counties. Farther west, Finney County is one of the few circles that stands out clearly. These circles answer a simple question—where do the most people live by county—but they do not account for county land area. That is why the ranking changes once the measure switches from population totals to density.
Johnson and Wyandotte exceed 1,000 people per square mile, while many western counties remain below 10
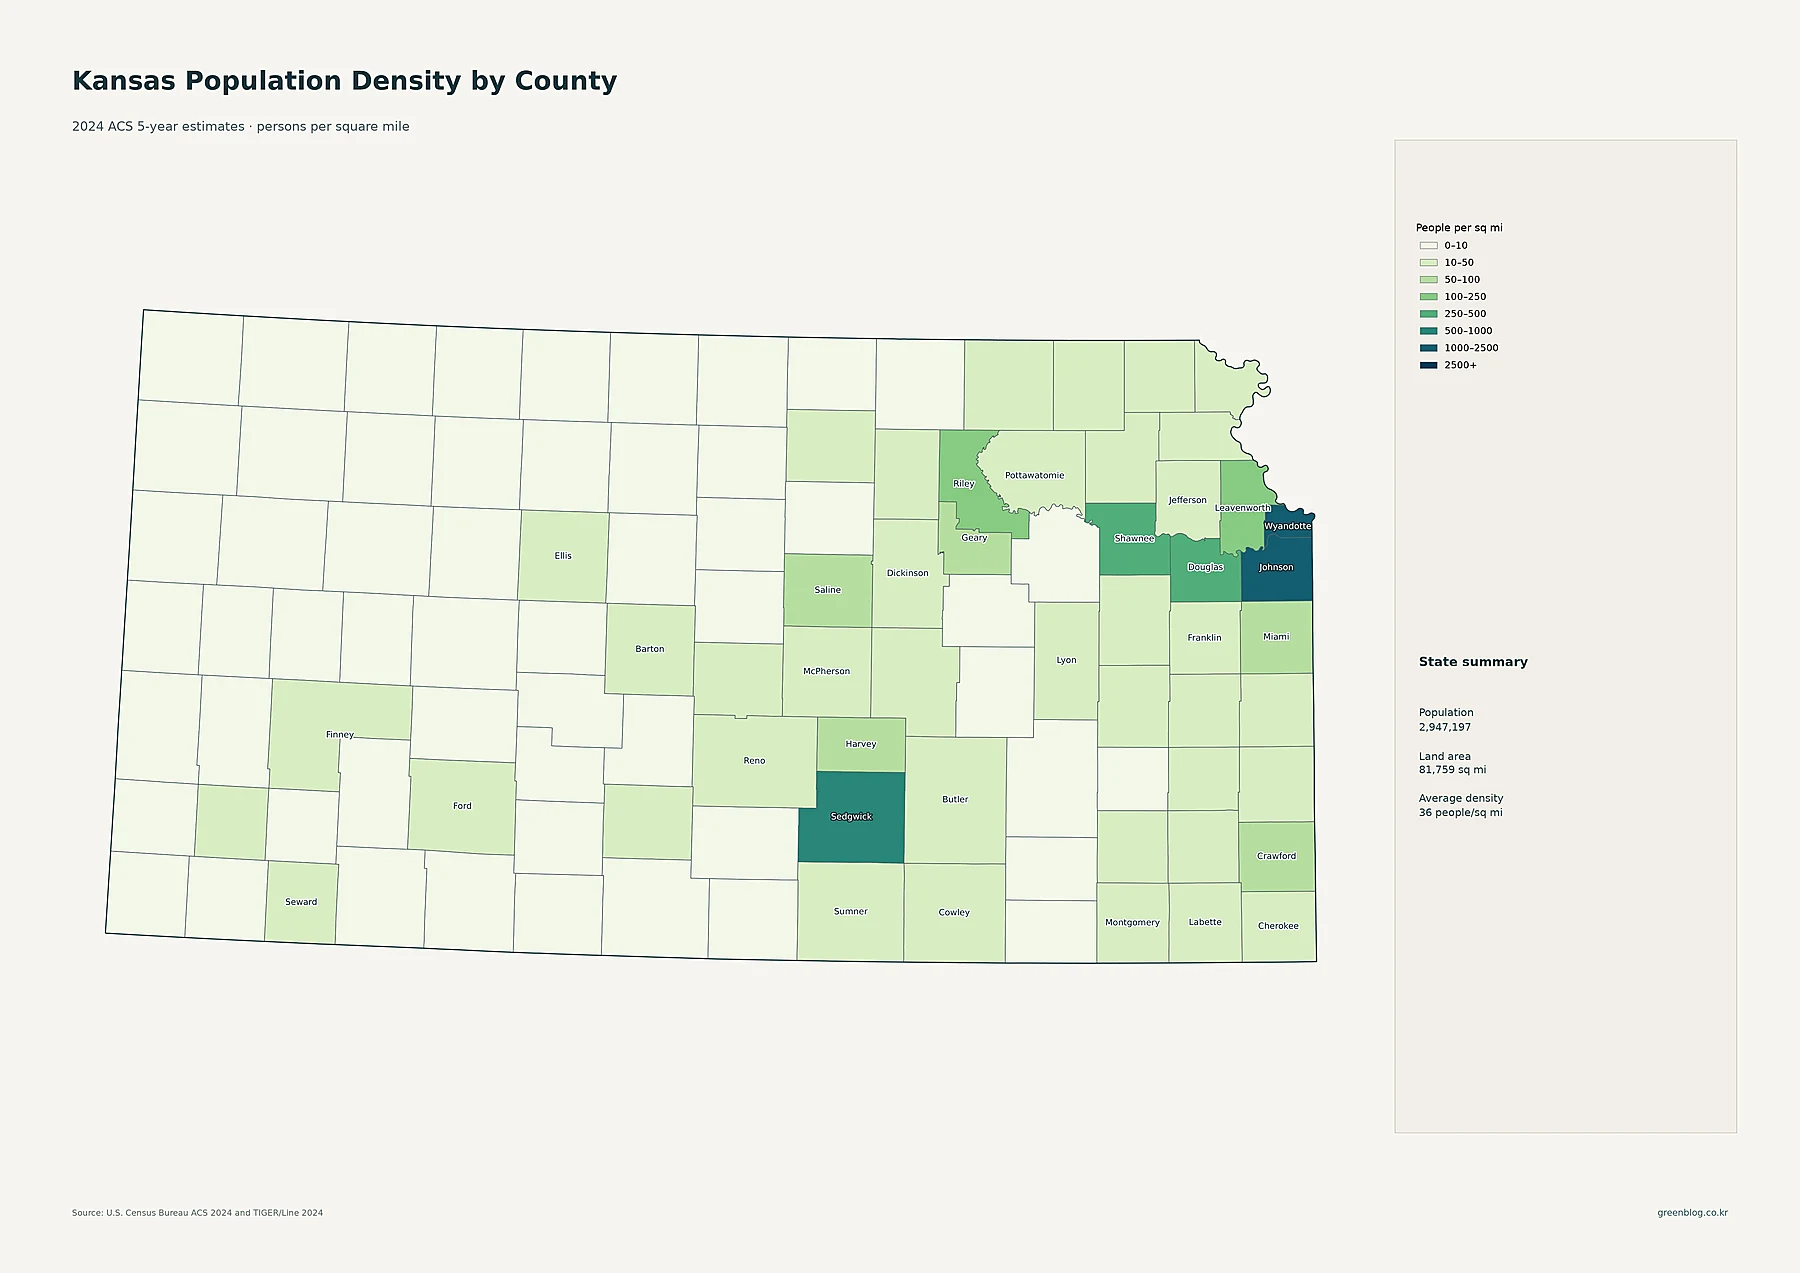
Johnson County also ranks first in county density at about 1,310 people per square mile. Wyandotte County is close behind at roughly 1,106. Sedgwick County is about 530, Shawnee 327, Douglas 264, and Leavenworth 179. Riley County is about 118 people per square mile, Geary 93, Saline 75, Crawford 66, Harvey 63, and Miami 61. The darker classes are therefore concentrated heavily in eastern Kansas and around Wichita, matching the broad pattern visible on the tract map.
The low-density end is dramatically different. Wallace County averages only about 1.6 people per square mile and Greeley about 1.7. Hodgeman is roughly 1.9, while Clark and Lane are close to 2.0. Comanche, Rawlins, Ness, Hamilton, Logan, Cheyenne, Gove, Graham, and Sheridan are all below three people per square mile or only slightly above that threshold. A statewide average of about 36 people per square mile therefore combines counties above 1,000 with large parts of western Kansas where density is in the low single digits. The county map makes that contrast visible at a glance, while the tract map shows the small towns that a county-wide average can hide.
| Measure | Leading area | Value in the supplied data |
|---|---|---|
| State population | Kansas | 2,947,197 |
| Largest county population | Johnson | 620,631 |
| Highest county density | Johnson | about 1,310/sq mi |
| Fastest 2010–2020 growth | Pottawatomie | +17.3% |
| Largest 2010–2020 decline | Morton | -16.5% |
Pottawatomie led 2010–2020 growth, while many western and southern counties declined
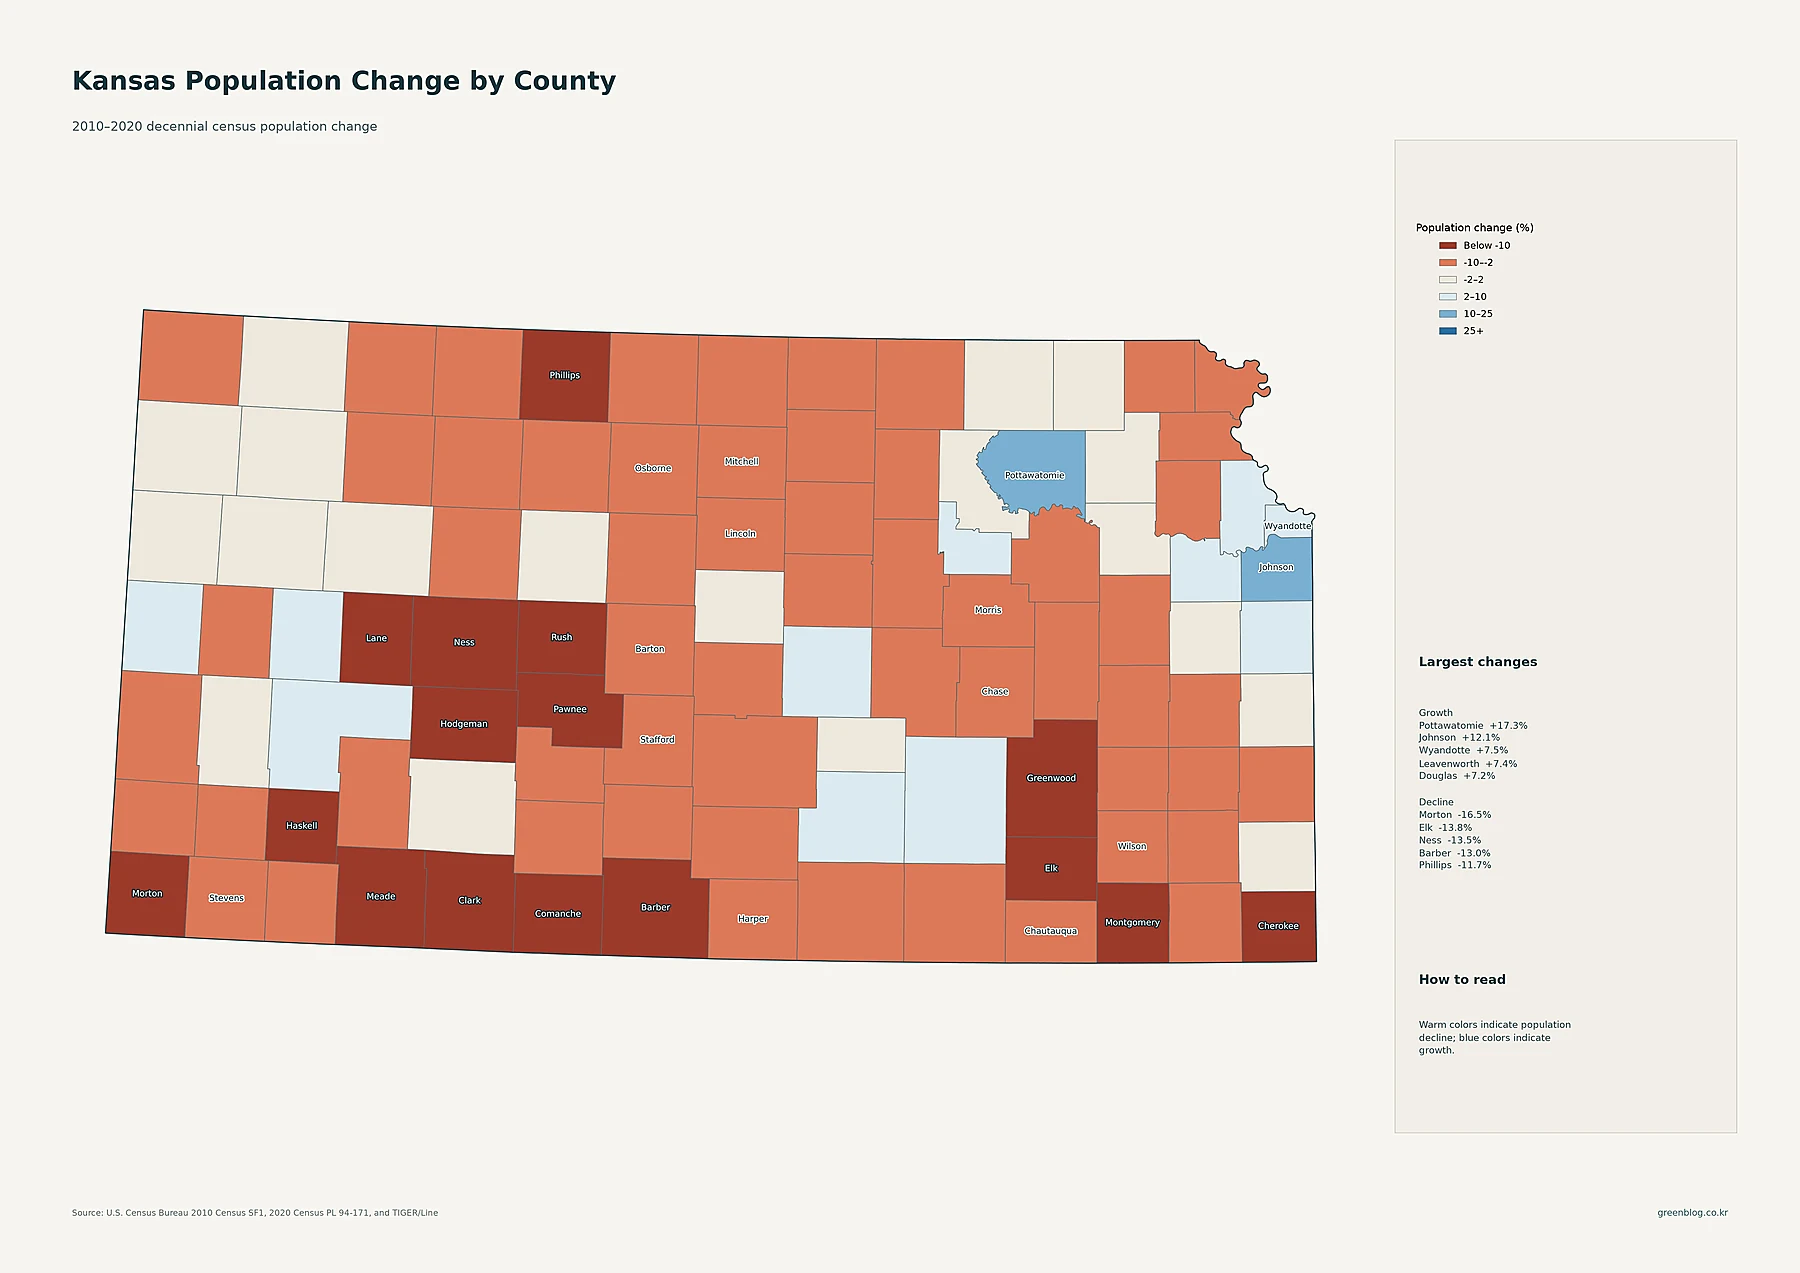
The decade-change map uses 2010 and 2020 Decennial Census counts rather than the 2024 ACS estimates used for the current-population maps. Pottawatomie County had the largest percentage gain at about 17.3%. Johnson County grew 12.1%, Wyandotte 7.5%, Leavenworth 7.4%, Douglas 7.2%, and Geary 6.9%. Sedgwick increased 5.1%, Finney 4.6%, Scott 4.4%, and Miami 4.3%. Much of the strongest growth appears in eastern and northeastern Kansas, although there are also growing counties in south-central and western parts of the state.
The decline pattern is broad. Morton County had the largest percentage loss at about 16.5%. Elk fell 13.8%, Ness 13.5%, Barber 13.0%, and Phillips 11.7%. Meade declined 11.4%, Montgomery 11.2%, and Haskell 11.2%. Comanche, Rush, Cherokee, Pawnee, Clark, Hodgeman, and Greenwood also lost around 10% or more. Warm colors cover many counties across western and southern Kansas and appear in parts of the north as well. The map tells us where populations rose or fell during the decade, but it does not by itself establish why those changes occurred.
Current size, concentration, and growth tell three different stories
Johnson County is the clearest example of a place that ranks high on more than one measure. It has the largest county population and the highest county density, and its tract map contains a broad set of dense suburban communities. Sedgwick County is second in population and contains Wichita, the state’s largest census place, but its county density of about 530 people per square mile is far below Johnson’s. Wyandotte County has a much smaller total population than Johnson or Sedgwick, yet its density exceeds 1,100 people per square mile. These differences show why a county circle map and a density map should never be treated as substitutes.
Adding the 2010–2020 trend introduces a third dimension. Pottawatomie County grew faster in percentage terms than Johnson, even though its current population is far smaller. Several already large eastern counties also grew, while many sparse counties declined over the same decade. For practical use, choose the major-cities map to locate population centers, the county-circle map to compare resident totals, the tract and county-density maps to understand concentration, and the change map to see where population moved up or down over time. Together, the five maps show Kansas not as uniformly sparse, but as a state with a handful of substantial urban concentrations surrounded by extensive low-density territory.
Download the Kansas population map collection
The ZIP collection includes the detailed census-tract density map, major cities and urban areas, county population totals, 2010–2020 county change, and county population density.
FAQ
Which Kansas county has the largest population and the highest density?
Johnson County leads both measures in the supplied 2024 ACS data. It has 620,631 residents and an average density of about 1,310 people per square mile. Total population and density are still separate measures, so other counties can rank very differently depending on which one is being compared.
Which Kansas county grew fastest from 2010 to 2020?
Pottawatomie County had the largest percentage increase at about 17.3%. Johnson grew 12.1%, Wyandotte 7.5%, Leavenworth 7.4%, and Douglas 7.2%. These percentages compare the 2010 and 2020 Decennial Census counts.
Why does Kansas’s statewide average density hide so much variation?
The statewide average is about 36 people per square mile, but Johnson County is near 1,310 and Wyandotte near 1,106, while Wallace and Greeley are below two. County and census-tract maps reveal a much wider urban-rural range than one statewide average can show.
Related Maps
Sources
- U.S. Census Bureau — American Community Survey (ACS): 2024 ACS 5-year population estimates.
- U.S. Census Bureau — TIGER/Line Shapefiles: 2024 county, census tract, and place geography used in the maps.
- U.S. Census Bureau — Decennial Census: 2010 and 2020 county population counts used for the change comparison.
Green Map creates custom-edited map images using open geographic data sources such as geoBoundaries, Natural Earth, OpenStreetMap, and government open data.
These maps are edited visual materials, not raw data files, and are provided for education, documents, presentations, and graphic reference.