Georgia’s population pattern is dominated by one large concentration in and around Atlanta, but the state is not simply a story of one big city and a sparsely settled remainder. The detailed tract map shows a broad high-density footprint across the Atlanta metropolitan area, while smaller clusters appear around Augusta, Savannah, Columbus, Macon, Athens, and other regional centers. County totals tell a related but different story: Fulton has the largest 2024 population, yet DeKalb has the highest countywide density. The 2010–2020 change map adds another dimension, showing that the fastest percentage growth occurred in Bryan and Forsyth rather than in the county with the largest population.
Table of Contents
Georgia population at a glance
| Measure | Value shown in the supplied data | What it means |
|---|---|---|
| 2024 state population | 10,940,407 | ACS 2024 five-year estimate |
| Average state density | About 190 people per sq mi | A statewide average that hides large local differences |
| Largest county population | Fulton — 1,076,561 | Total residents, not density |
| Highest county density | DeKalb — about 2,859 people per sq mi | Residents per unit of land area |
| Largest 2010–2020 gain | Bryan — +48.0% | Decennial Census change, not a 2024 estimate |
| Largest listed decline | Dooly — -24.9% | Percentage change, not current population size |
Keeping these measures separate is essential. A county can have many residents because it covers a large area, while another can place fewer residents into a smaller area and therefore have a higher density. A fast growth rate is different again: it compares two points in time and does not indicate that a county is currently the largest or most crowded. The five maps in this set are most useful when they are read as complementary views rather than interchangeable rankings.
The tract map reveals Atlanta’s broad high-density footprint
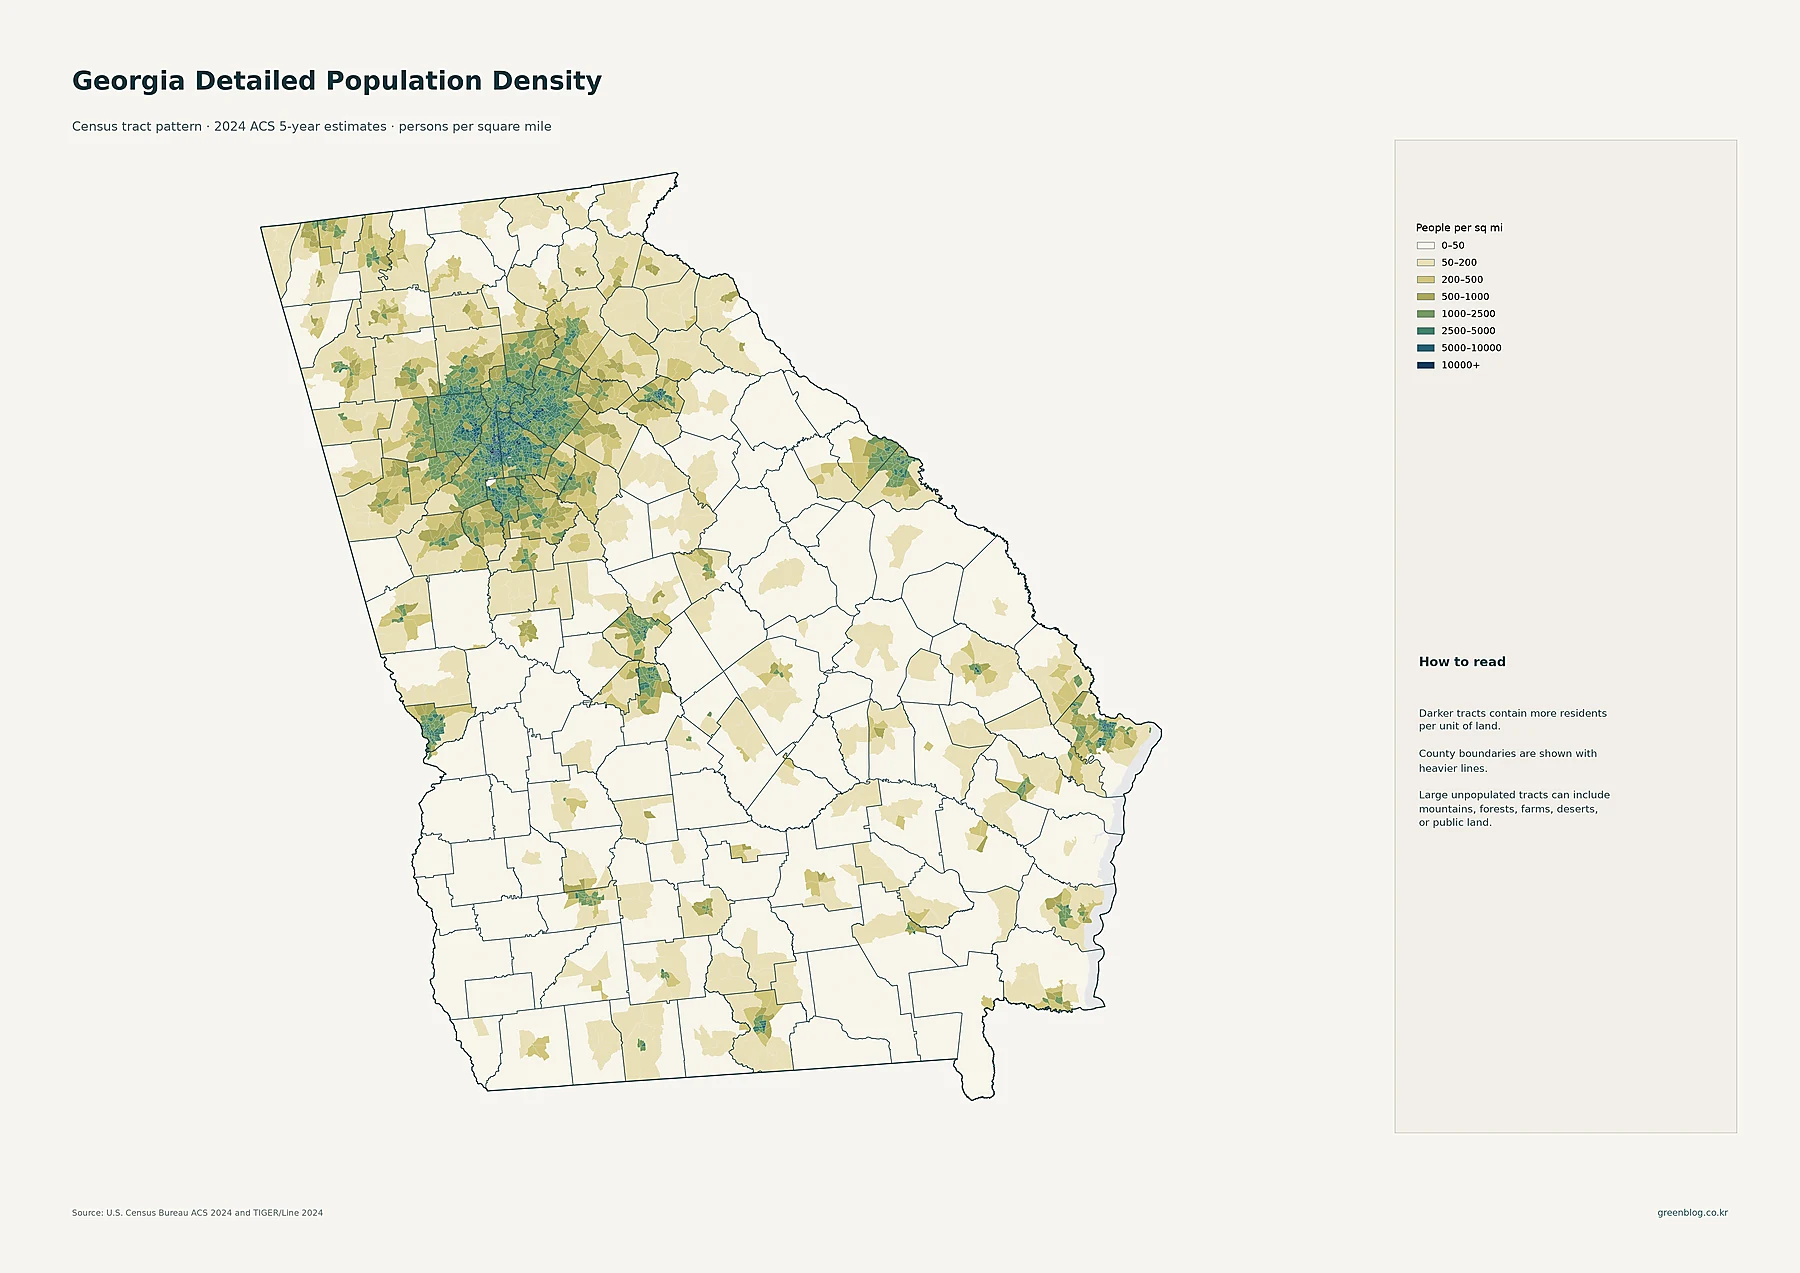
The detailed map uses census tracts, which are much smaller than counties. Its legend runs from 0–50 people per square mile through 50–200, 200–500, 500–1,000, 1,000–2,500, 2,500–5,000, 5,000–10,000, and 10,000 or more. Darker tracts therefore indicate more residents per unit of land. The most extensive dark cluster lies in north-central Georgia around Atlanta, and it stretches across multiple county boundaries rather than stopping at a single city or county line.
Outside metropolitan Atlanta, smaller dense clusters are visible around Augusta in the east, Savannah on the coast, Columbus on the western border, Macon in central Georgia, and Athens to the northeast. Much of southern and eastern Georgia is covered by lighter tracts, with denser patches concentrated around individual population centers. This is why the tract map is valuable even when a county-density map is also available. A county average can look modest while still containing a compact city or suburban zone with much higher local density.
Major places show a network of urban centers beyond Atlanta
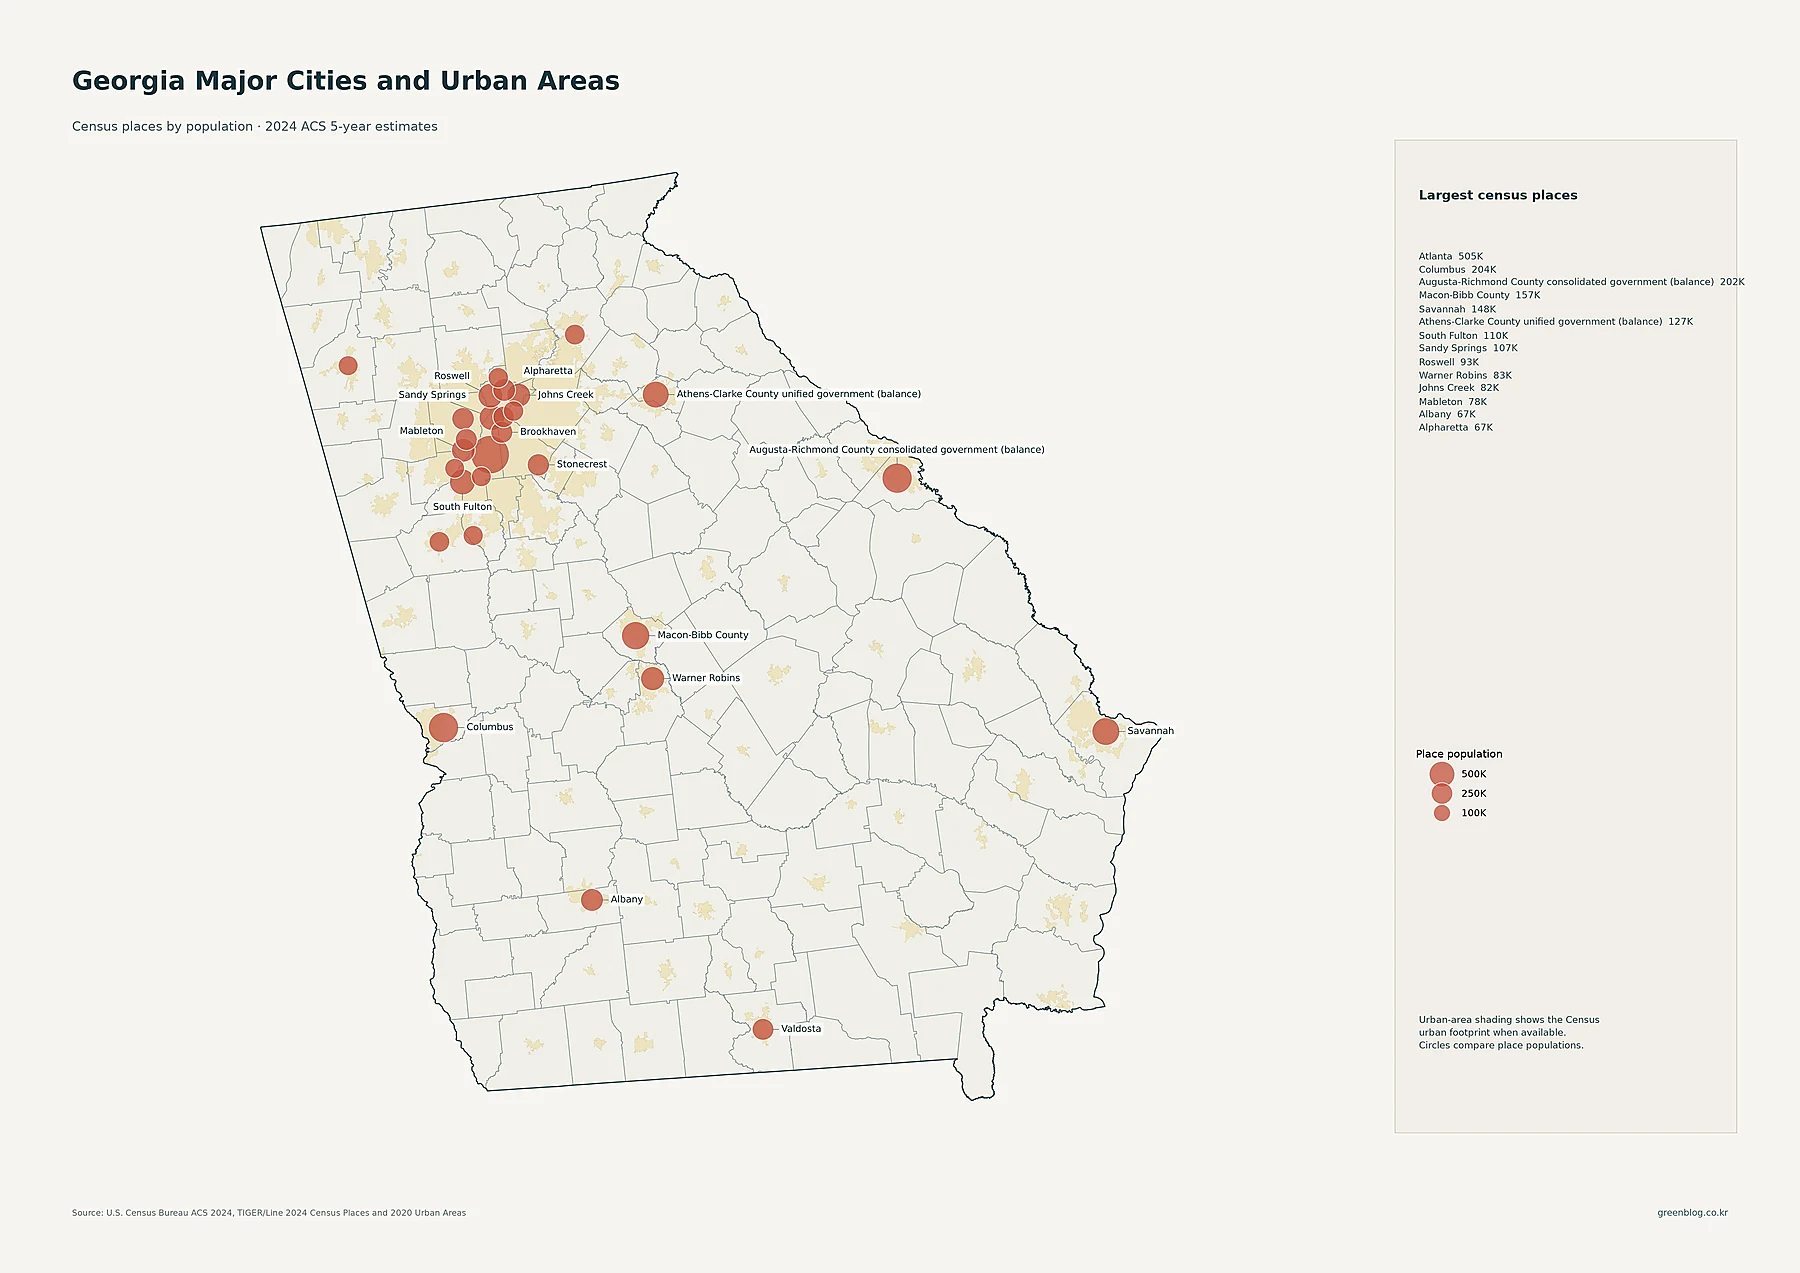
Atlanta is the largest census place on the supplied map at 505,268 residents. Columbus follows at 203,711. Augusta-Richmond County consolidated government (balance) is shown at 201,528, Macon-Bibb County at 156,578, Savannah at 147,898, and Athens-Clarke County unified government (balance) at 127,345. South Fulton has 110,471 residents and Sandy Springs 107,087. Roswell, Warner Robins, Johns Creek, Mableton, Albany, Alpharetta, and other places add a second tier of sizable centers.
The spatial arrangement matters as much as the ranking. Around Atlanta, several large circles and urban-area patches sit close together, reinforcing the continuous density seen on the tract map. Augusta, Columbus, Macon, and Savannah appear as more separated regional centers. The circles on this map represent place populations; they do not measure county population or density. That distinction prevents a common mistake in reading thematic maps: a large circle means a larger place population, not necessarily a more densely populated county.
County totals are heavily weighted toward metropolitan Atlanta
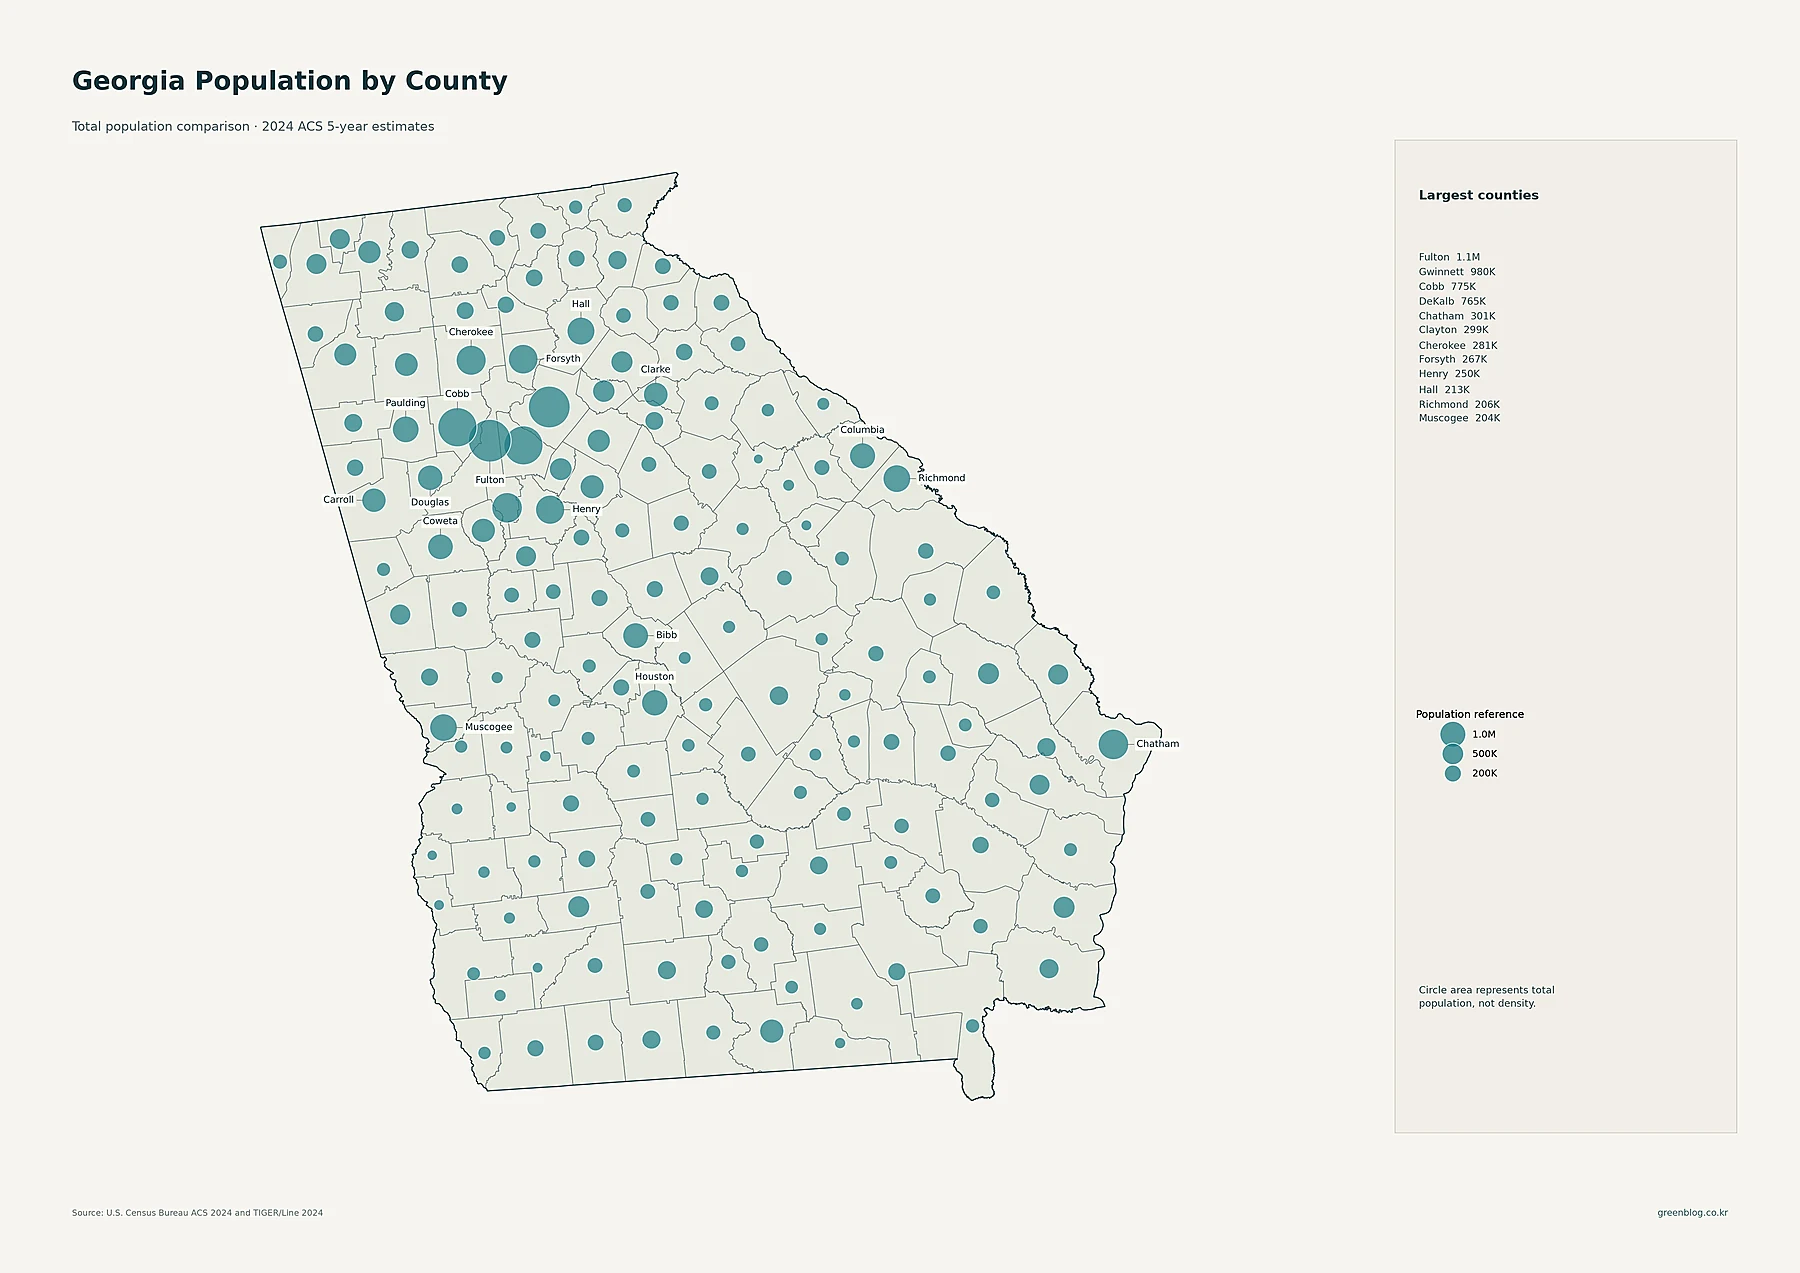
Fulton is the largest county in the 2024 ACS data at 1,076,561 residents. Gwinnett follows with 979,864, Cobb with 775,208, and DeKalb with 765,351. Those four very large circles are all in metropolitan Atlanta. Other sizable counties in and around the same broad region include Clayton at 298,924, Cherokee at 281,032, Forsyth at 267,287, Henry at 249,960, Hall at 212,705, and Paulding at 178,909. The result is a clear concentration of county population in north-central Georgia.
Large populations also appear outside the Atlanta region. Chatham, home to the Savannah area, has 300,879 residents. Richmond has 206,069 and Muscogee 203,711, corresponding to major population centers around Augusta and Columbus. Houston has 169,649, while Columbia has 162,434. Because Georgia has 159 counties, the statewide map contains many small circles, but the largest symbols cluster around a relatively limited number of metropolitan and regional centers.
County density changes the ranking: DeKalb moves to the top
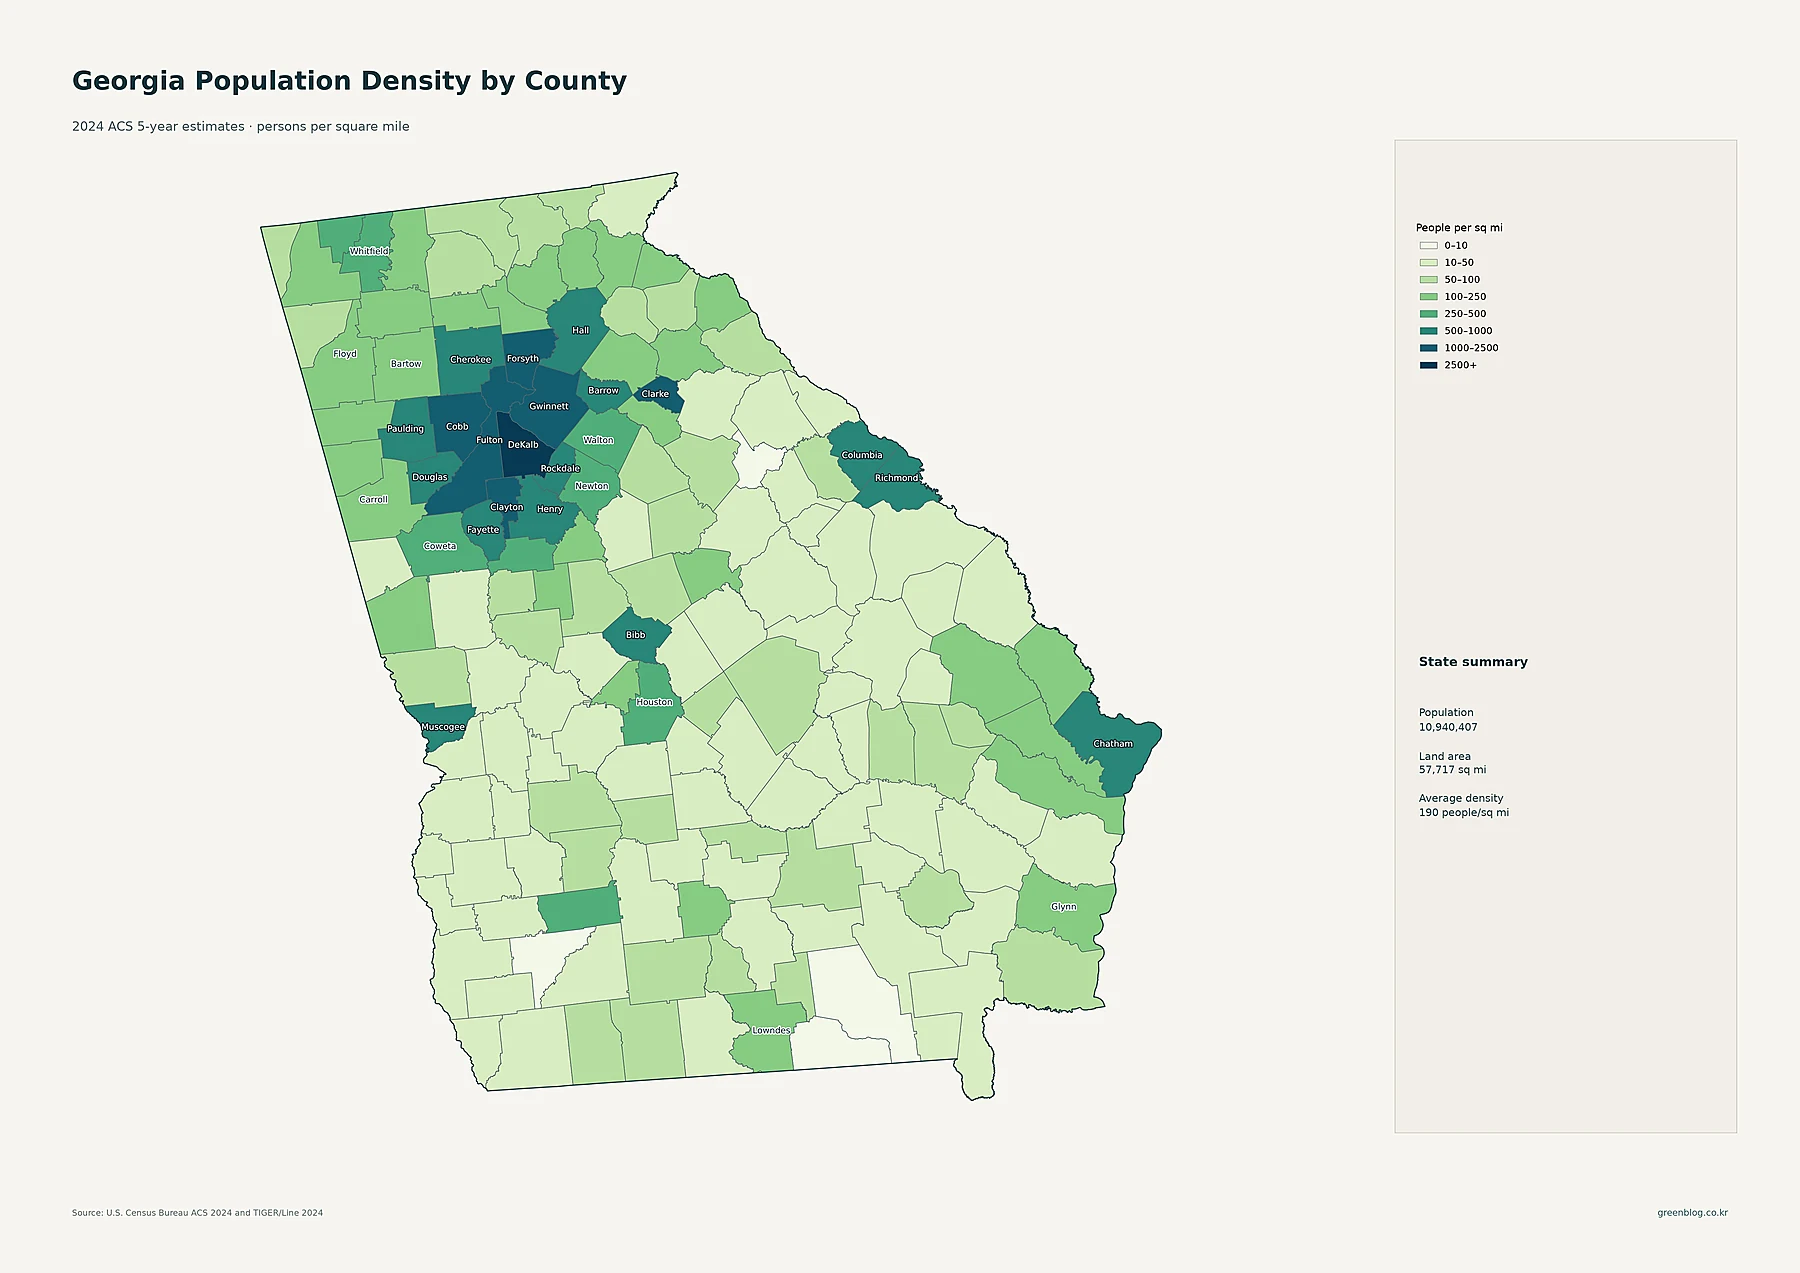
The county-density map uses classes of 0–10, 10–50, 50–100, 100–250, 250–500, 500–1,000, 1,000–2,500, and 2,500 or more people per square mile. DeKalb ranks highest in the supplied data at about 2,859 people per square mile. Cobb is about 2,282, Gwinnett about 2,273, Clayton about 2,110, and Fulton about 2,044. All five are part of the Atlanta-area concentration, but their order differs from the total-population ranking.
Other relatively dense counties include Forsyth at about 1,190 people per square mile, Clarke at about 1,086, Muscogee at about 941, Henry at about 784, Chatham at about 695, Richmond at about 635, and Cherokee at about 668. Many counties across southern Georgia and parts of the central and eastern sections fall into much lighter categories. The map’s state summary reports a population of 10,940,407, land area of 57,717 square miles, and average density of roughly 190 people per square mile. That single statewide average is useful for context, but it cannot capture the gap between metro Atlanta and sparsely settled counties.
The 2010–2020 map separates fast-growth counties from declining areas
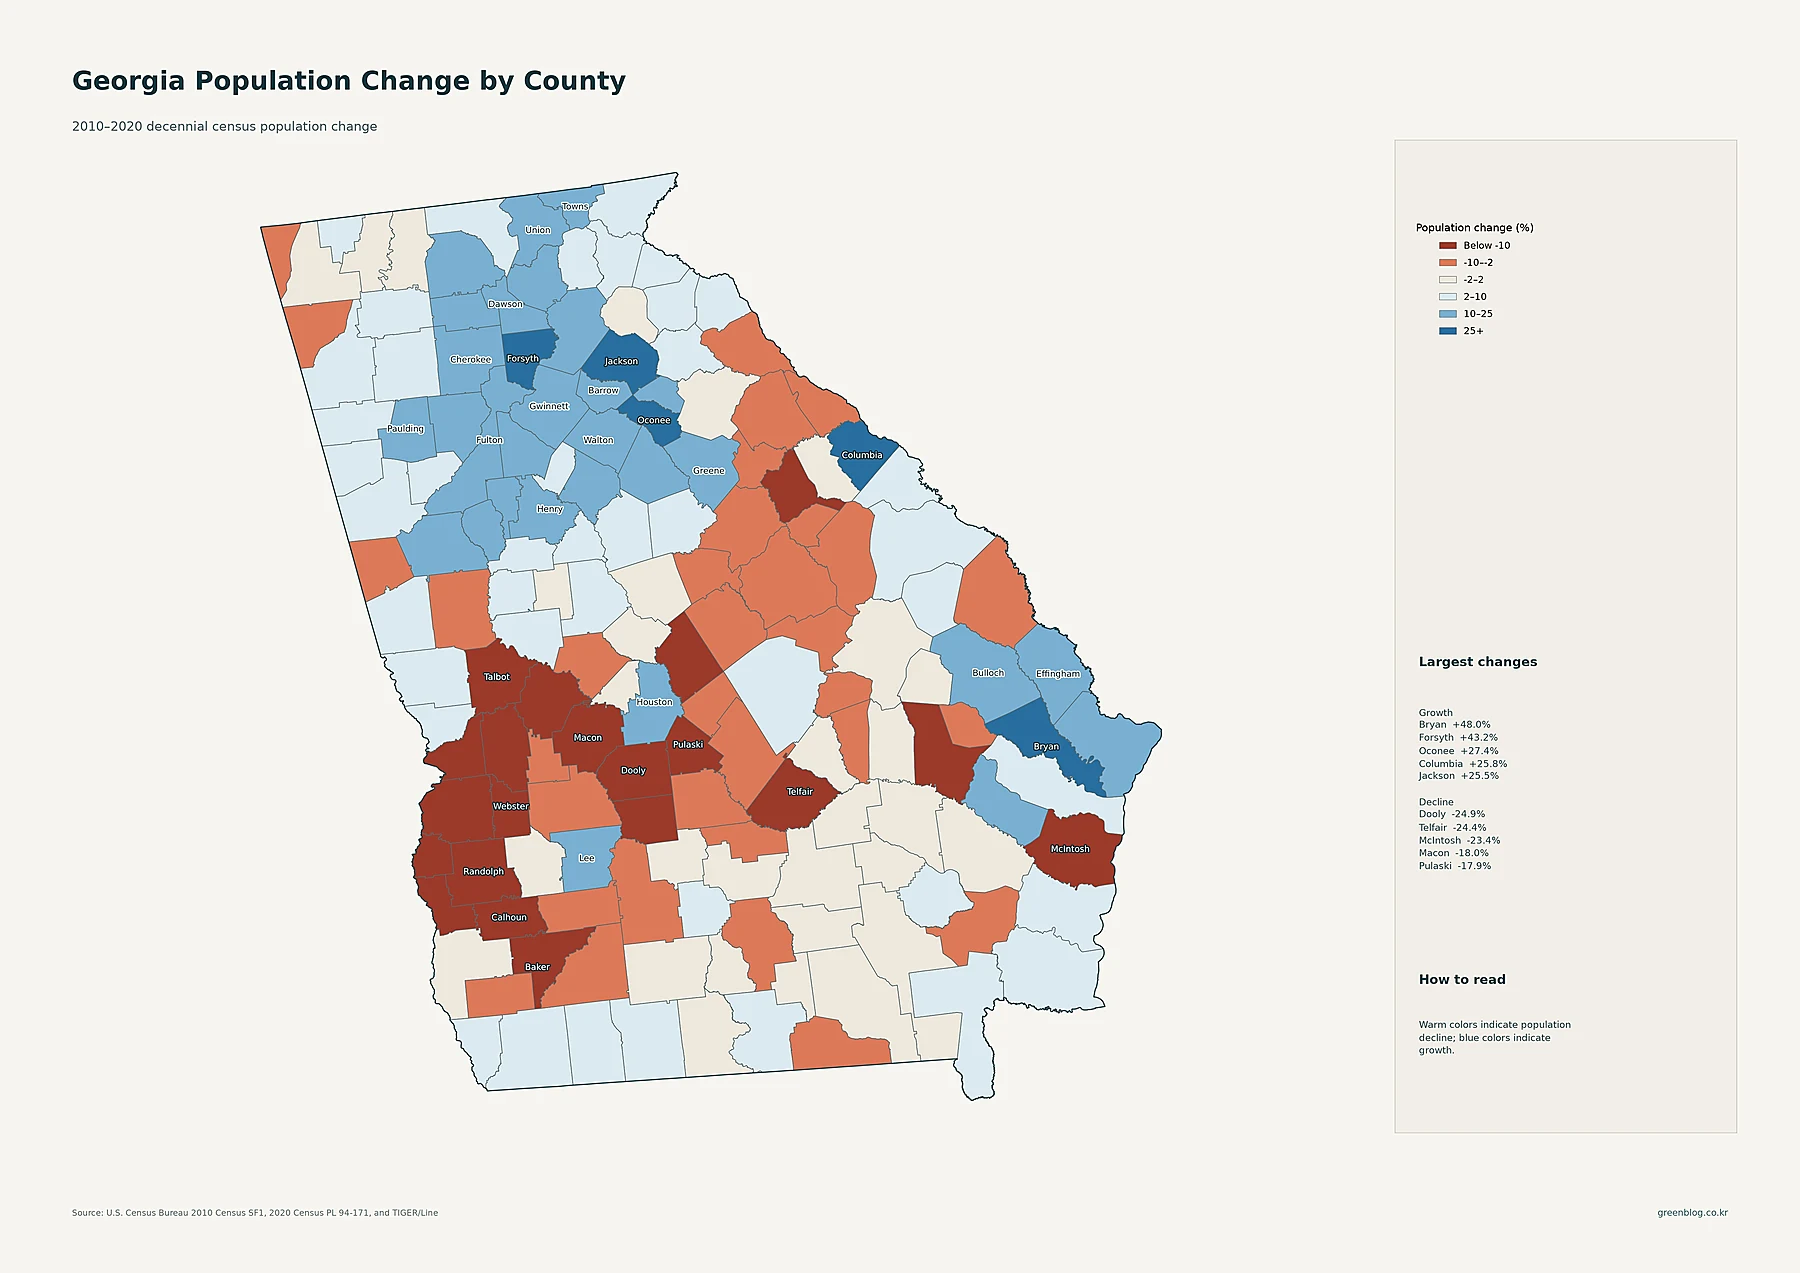
This map uses a different period and data concept. It compares the 2010 and 2020 decennial censuses rather than presenting a 2024 ACS estimate. The legend groups counties into below -10%, -10% to -2%, -2% to 2%, 2% to 10%, 10% to 25%, and 25% or more. Bryan records the largest increase at +48.0%, followed by Forsyth at +43.2%, Oconee at +27.4%, Columbia at +25.8%, and Jackson at +25.5%. Cherokee also grew by +24.4%, and Effingham by +24.0%.
The strongest growth colors appear in several counties around and beyond metropolitan Atlanta and in parts of the southeast near the coast. Decline is prominent across a broad set of counties in the southwest, south-central region, and portions of central and eastern Georgia. Dooly fell by -24.9%, Telfair by -24.4%, McIntosh by -23.4%, Macon by -18.0%, and Pulaski by -17.9%. These numbers identify where population changed and by how much. They do not, by themselves, establish why a county grew or declined; answering that question would require separate evidence about migration, housing, employment, age structure, or other factors.
Reading totals, density, and growth together
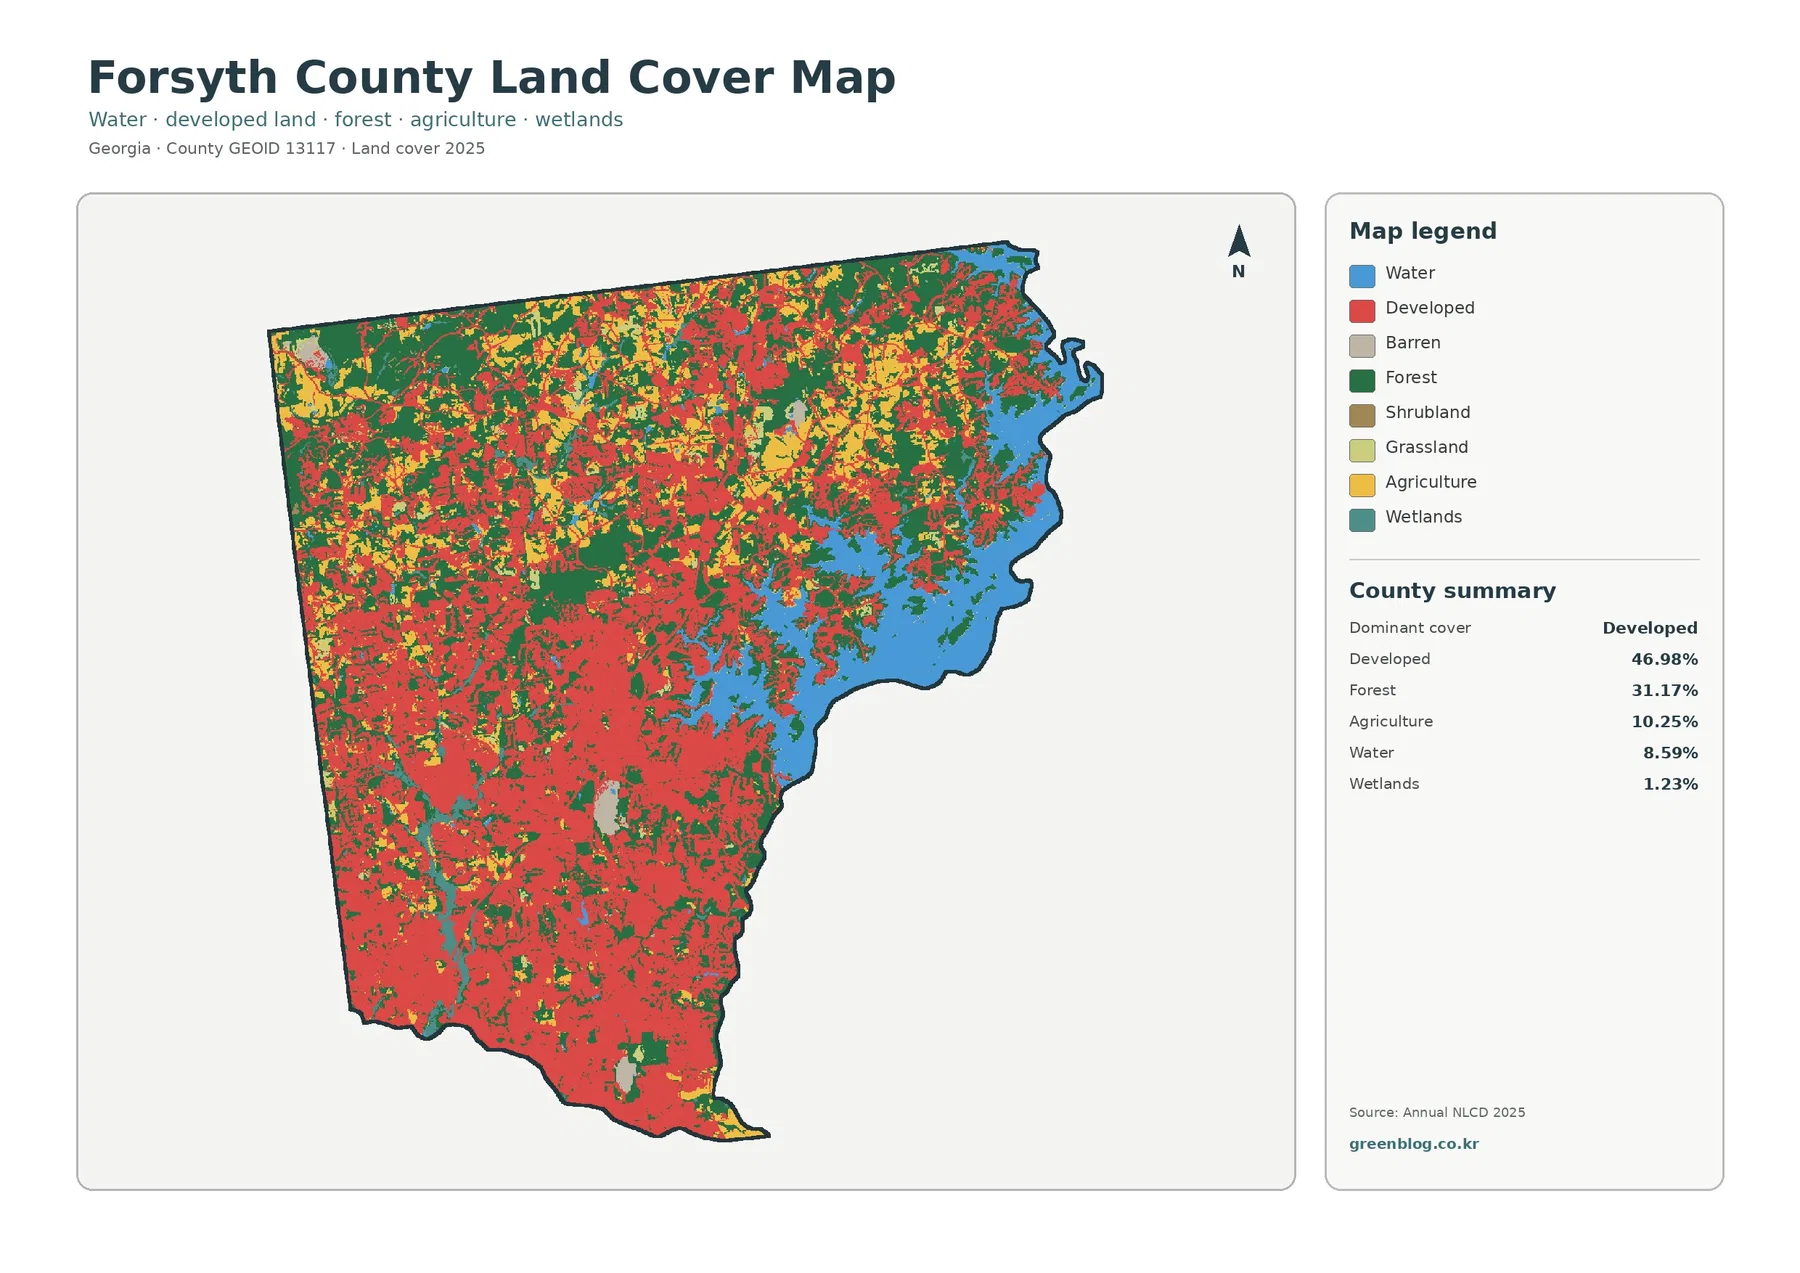
The combined maps make several contrasts easy to see. Fulton is Georgia’s most populous county in the supplied 2024 data and is also very dense, but DeKalb has the highest countywide density. Forsyth stands out in a different way: it has 267,287 residents in 2024, density of roughly 1,190 people per square mile, and a 2010–2020 increase of +43.2%. Bryan had an even faster decade-long growth rate of +48.0%, but its 2024 population is 48,263 and its density is about 110 people per square mile. Growth rate therefore should not be treated as a proxy for current size or crowding.
Chatham provides another useful example. Its 300,879 residents and density of about 695 people per square mile make it a substantial coastal population center, and Savannah is one of the state’s largest census places. Muscogee and Richmond similarly stand out around Columbus and Augusta. The lesson is practical: use the total-population map when the question is “how many people,” the density maps when the question is “how concentrated,” the city map when comparing named places, and the change map when asking “where did population rise or fall between 2010 and 2020?”
Download the Georgia population map collection
The collection provides separate high-resolution maps for tract density, major cities and urban areas, county population totals, 2010–2020 county change, and 2024 county density. For a presentation about current settlement patterns, the tract and county-density maps are the most direct choices. For county size comparisons, use the population-total map. For a historical comparison, use the change map and keep its 2010–2020 period visible in the caption or surrounding text.
Georgia population map collection
The ZIP package contains the high-resolution JPG versions of the population maps shown above.
FAQ
Which Georgia county has the highest population density?
In the supplied 2024 ACS five-year data, DeKalb County is highest at about 2,859 people per square mile. Cobb, Gwinnett, Clayton, and Fulton are also above 2,000 people per square mile.
Is Fulton County also the densest because it has the most people?
No. Fulton has the largest 2024 total population at 1,076,561, but density also depends on land area. DeKalb places its population into a smaller land area and therefore has a higher countywide density.
Which Georgia county grew fastest from 2010 to 2020?
Bryan County had the largest percentage increase in the supplied decennial Census comparison at +48.0%, followed by Forsyth County at +43.2%. Those percentages describe 2010–2020 change and should not be read as 2024 population estimates.
Related Maps
Official data sources
- U.S. Census Bureau — American Community Survey (ACS): source framework for the 2024 five-year population and density estimates.
- U.S. Census Bureau — TIGER/Line Shapefiles: geographic boundaries used for counties, tracts, and related mapping.
- U.S. Census Bureau — Decennial Census: basis for the 2010 and 2020 population-change comparison.
Green Map creates custom-edited map images using open geographic data sources such as geoBoundaries, Natural Earth, OpenStreetMap, and government open data.
These maps are edited visual materials, not raw data files, and are provided for education, documents, presentations, and graphic reference.