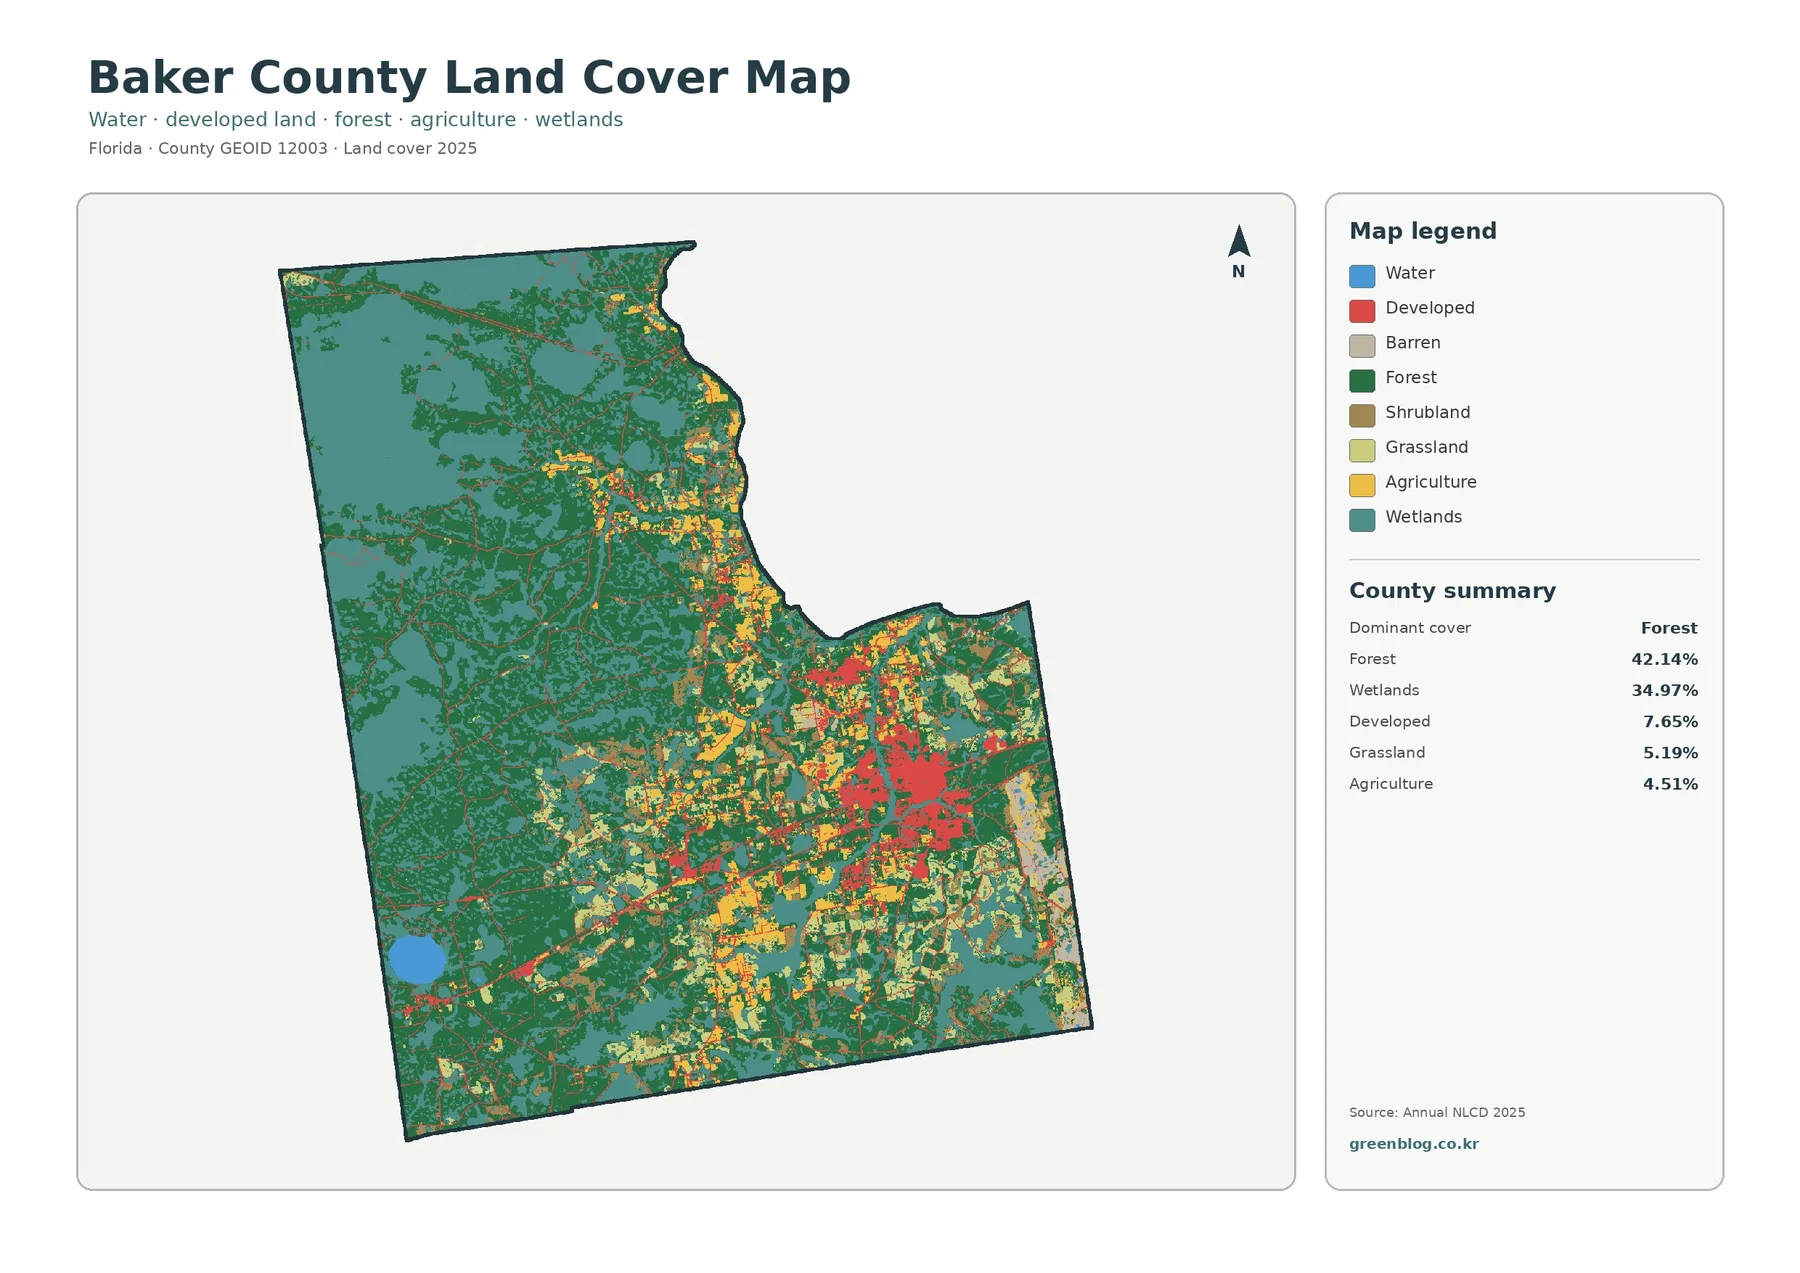
The Baker County Georgia Land Cover Map is dominated by working land and forest rather than developed cover. Agriculture accounts for 40.16% of the supplied 2025 summary, forest for 32.36%, and wetlands for 16.29%. Developed land is only 4.61%, followed by shrubland at 3.78%, grassland at 1.98%, and open water at 0.78%. The western and southern parts of the county are especially agricultural, while forest and wetlands become more prominent toward the north and east.
Four related views are included here: the 2025 land-cover overview, a forest-and-farmland map, an impervious-surface map, and a 1985–2025 class comparison. The WebP images make the patterns easy to compare on the page, while the four original JPG maps are available together in one ZIP download below. The set is useful for county profiles, agriculture and natural-resource discussions, presentations, and comparison with other southwest Georgia counties.
Table of Contents
Baker County’s agricultural footprint is clearer on the forest-and-farmland view
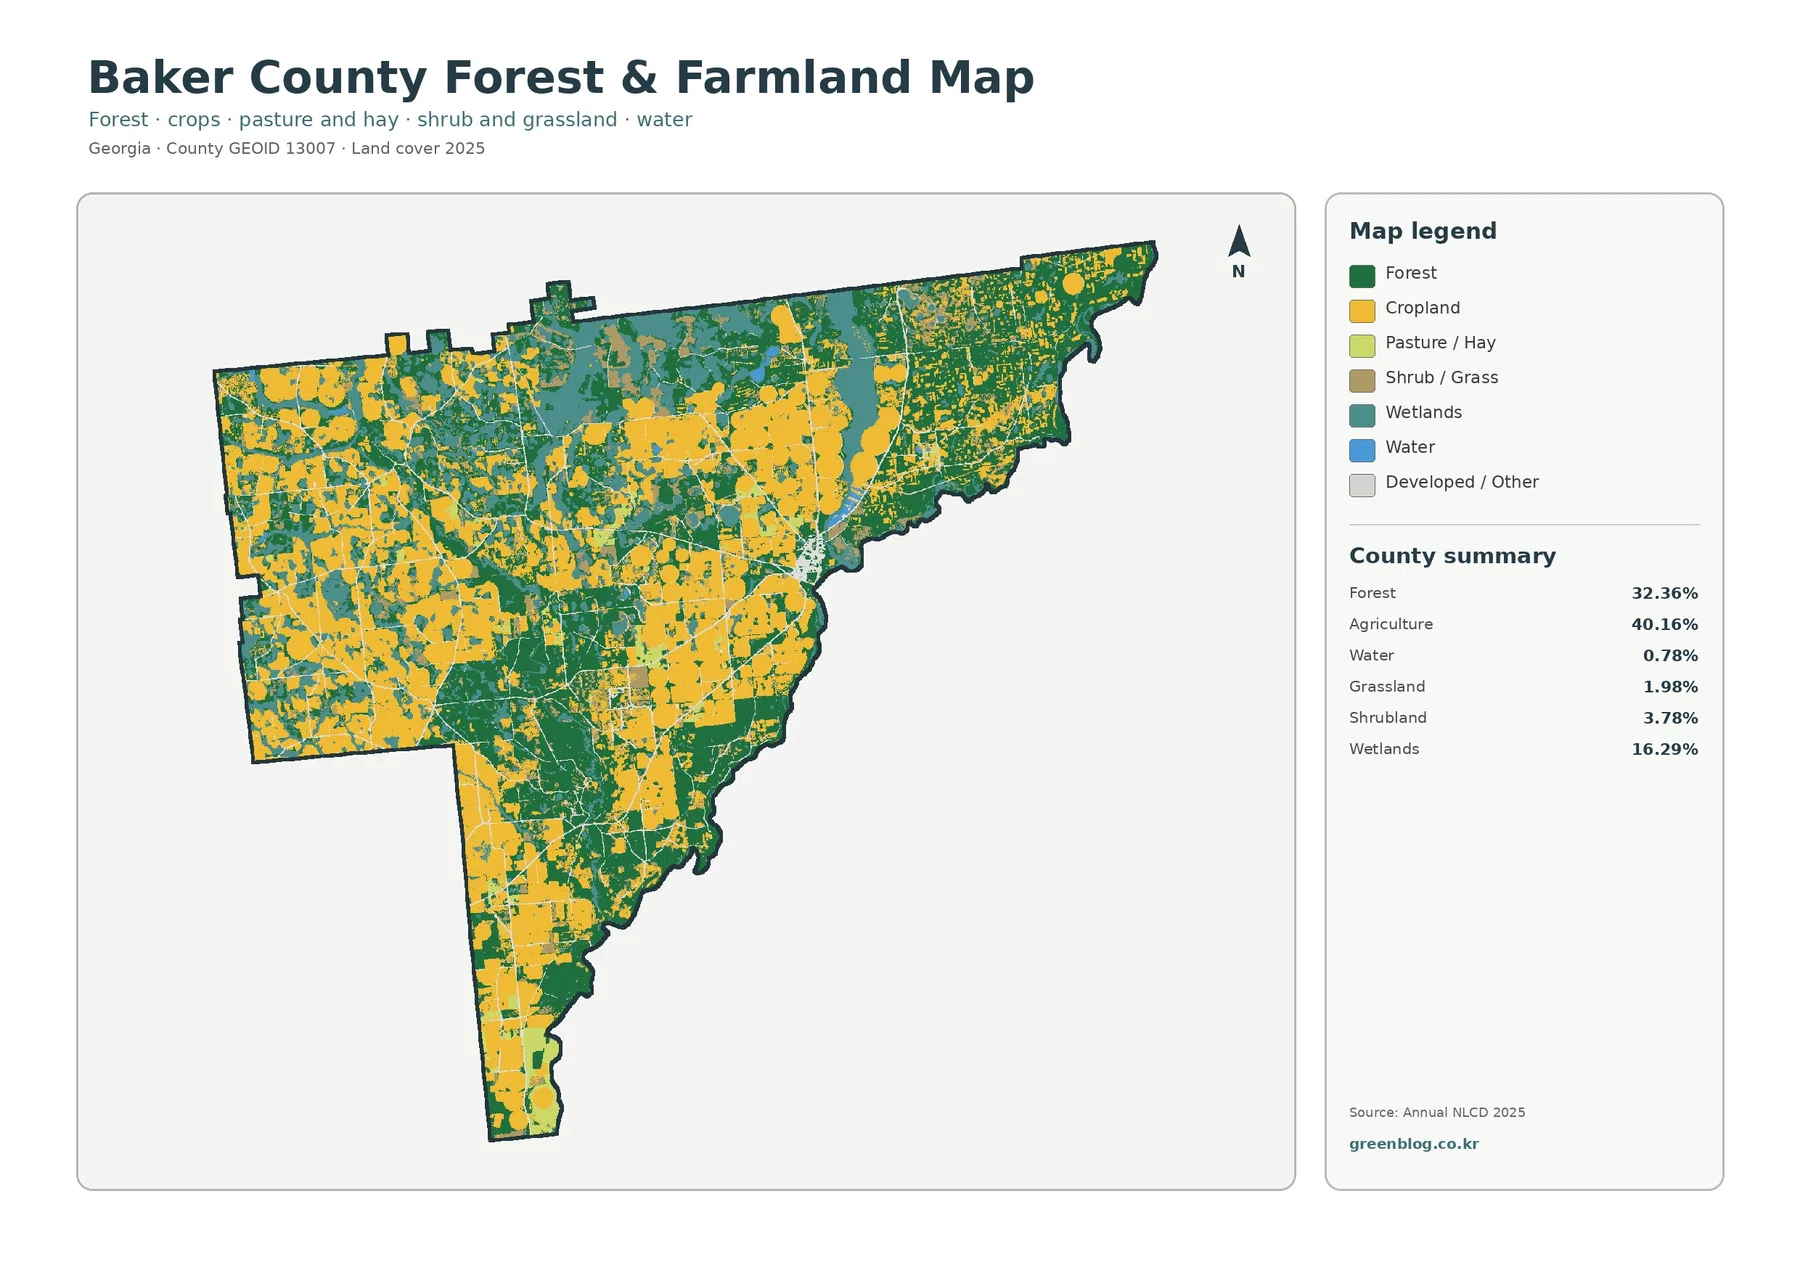
Cropland is extensive across the west and southwest and continues down the long southern portion of the county. Additional agricultural blocks appear through the center and north. The focused map makes those areas easier to see because most developed surfaces are faded into the background. Forest and wetlands interrupt the agricultural blocks frequently, so the county does not look like one continuous field district.
The verified agriculture total is 40.16%. Cropland and pasture or hay are separated in the legend, but the package does not provide exact percentages for those subtypes. Their locations can be compared visually, yet counting map pixels to create a new crop or pasture share would go beyond the supplied evidence.
UGA Extension Baker County provides agriculture and natural-resources information for local producers and residents. Historical Extension impact material for the county has also highlighted cotton and peanut production as important parts of the local farm economy. That context helps explain why agriculture is the largest 2025 class, but it does not allow an individual yellow cell to be identified as cotton, peanuts, corn, or any other crop.
The agricultural map also shows why the 40.16% total should not be read as one uniform surface. Forest blocks, wetland strips, grassland, shrubland, and small developed areas break the working landscape into many pieces. Field edges on a raster map are generalized, and the real ground can include roads, tree lines, drainage features, buildings, and mixed vegetation within or beside an agricultural cell.
Forest and wetlands become more prominent toward the north and east
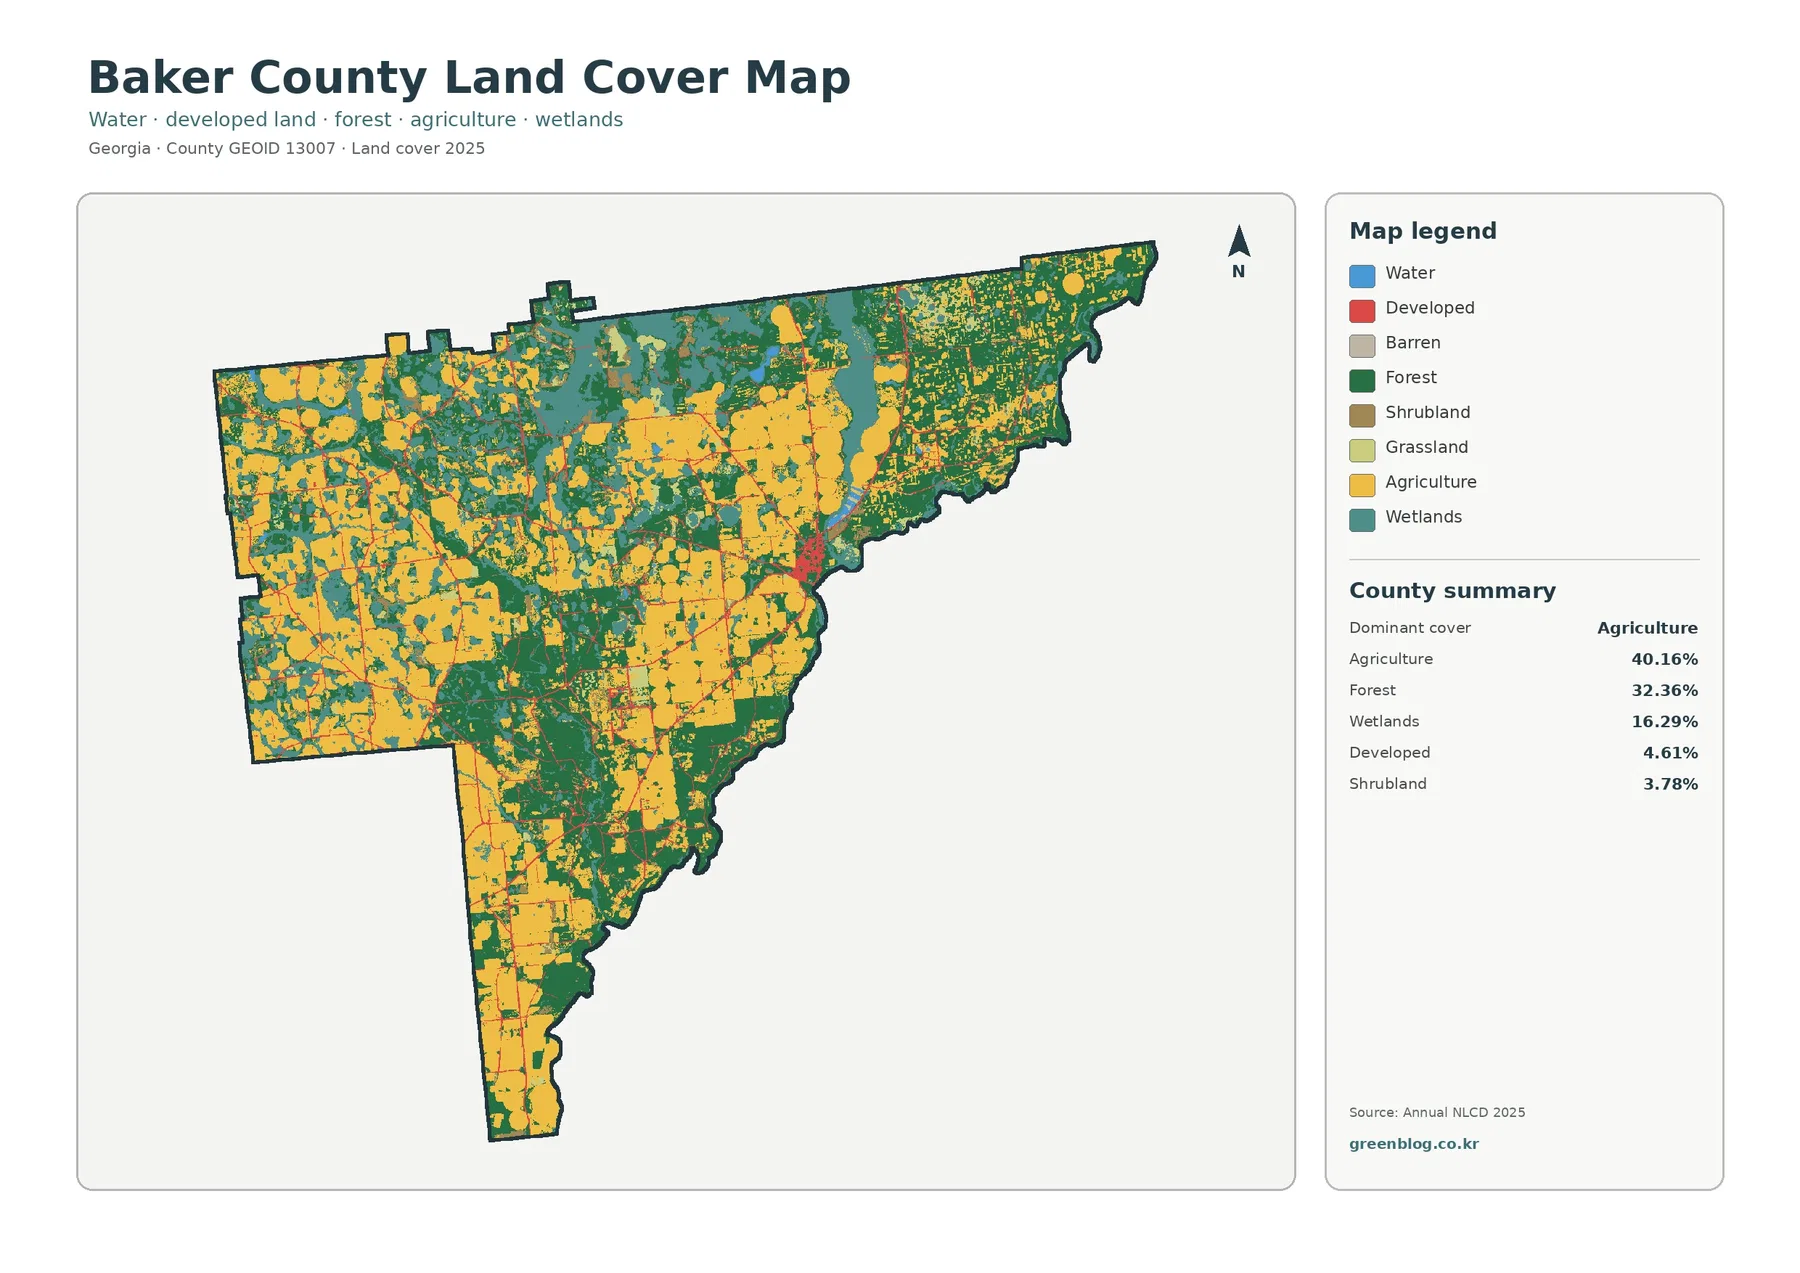
Forest is the second-largest class at 32.36%. Dark green is especially widespread across the north and eastern side, but wooded areas also remain between fields in the west and south. The pattern is not a simple straight boundary between farm country and forest. Instead, the two classes interlock across much of the county.
Wetlands account for 16.29%. Teal areas are common through the north and east and recur in central and western agricultural areas. They often meet forest directly, which is consistent with a landscape that contains both wooded and wet environments. Open water is only 0.78%, so the large wetland share should not be described as if a similar percentage of Baker County were covered by lakes or rivers.
Georgia’s official comprehensive plan identifies Newton as the county seat and describes the Flint River as an important natural resource for Baker County and Newton. Those facts provide useful local context for the map, especially because the county’s eastern outline is irregular and the eastern half contains substantial forest and wetland cover. The land-cover layer itself does not label the river or municipal boundaries, so those features should be verified with separate geographic sources when exact location matters.
Shrubland at 3.78% and grassland at 1.98% fill smaller spaces between the dominant classes. Those open-vegetation areas are scattered rather than concentrated in one large block. They are useful reminders that land between fields and forest is not automatically agricultural and that county-scale land cover simplifies a wide range of real vegetation into a few representative classes.
Ichauway adds a county-specific example of longleaf pine, wetlands, farms, and river habitat
The Jones Center at Ichauway is located in Baker County and describes a nearly 30,000-acre property that includes longleaf pine forests, wetlands, agricultural fields, streams, and the Flint River. Its research program focuses on longleaf pine ecology as well as water resources, wetlands, and aquatic ecosystems. That makes Ichauway a useful local example of the same broad cover types that appear throughout the county map.
The connection should not be pushed too far. The map on this page does not include an Ichauway boundary, so a green or teal block cannot be labeled as part of the research center from land cover alone. The value of the source is local context: it confirms that forest, wetlands, agriculture, and river environments all occur together within Baker County and are important enough to support long-term research and conservation work.
The Newton-area built footprint is small when measured by hard surface
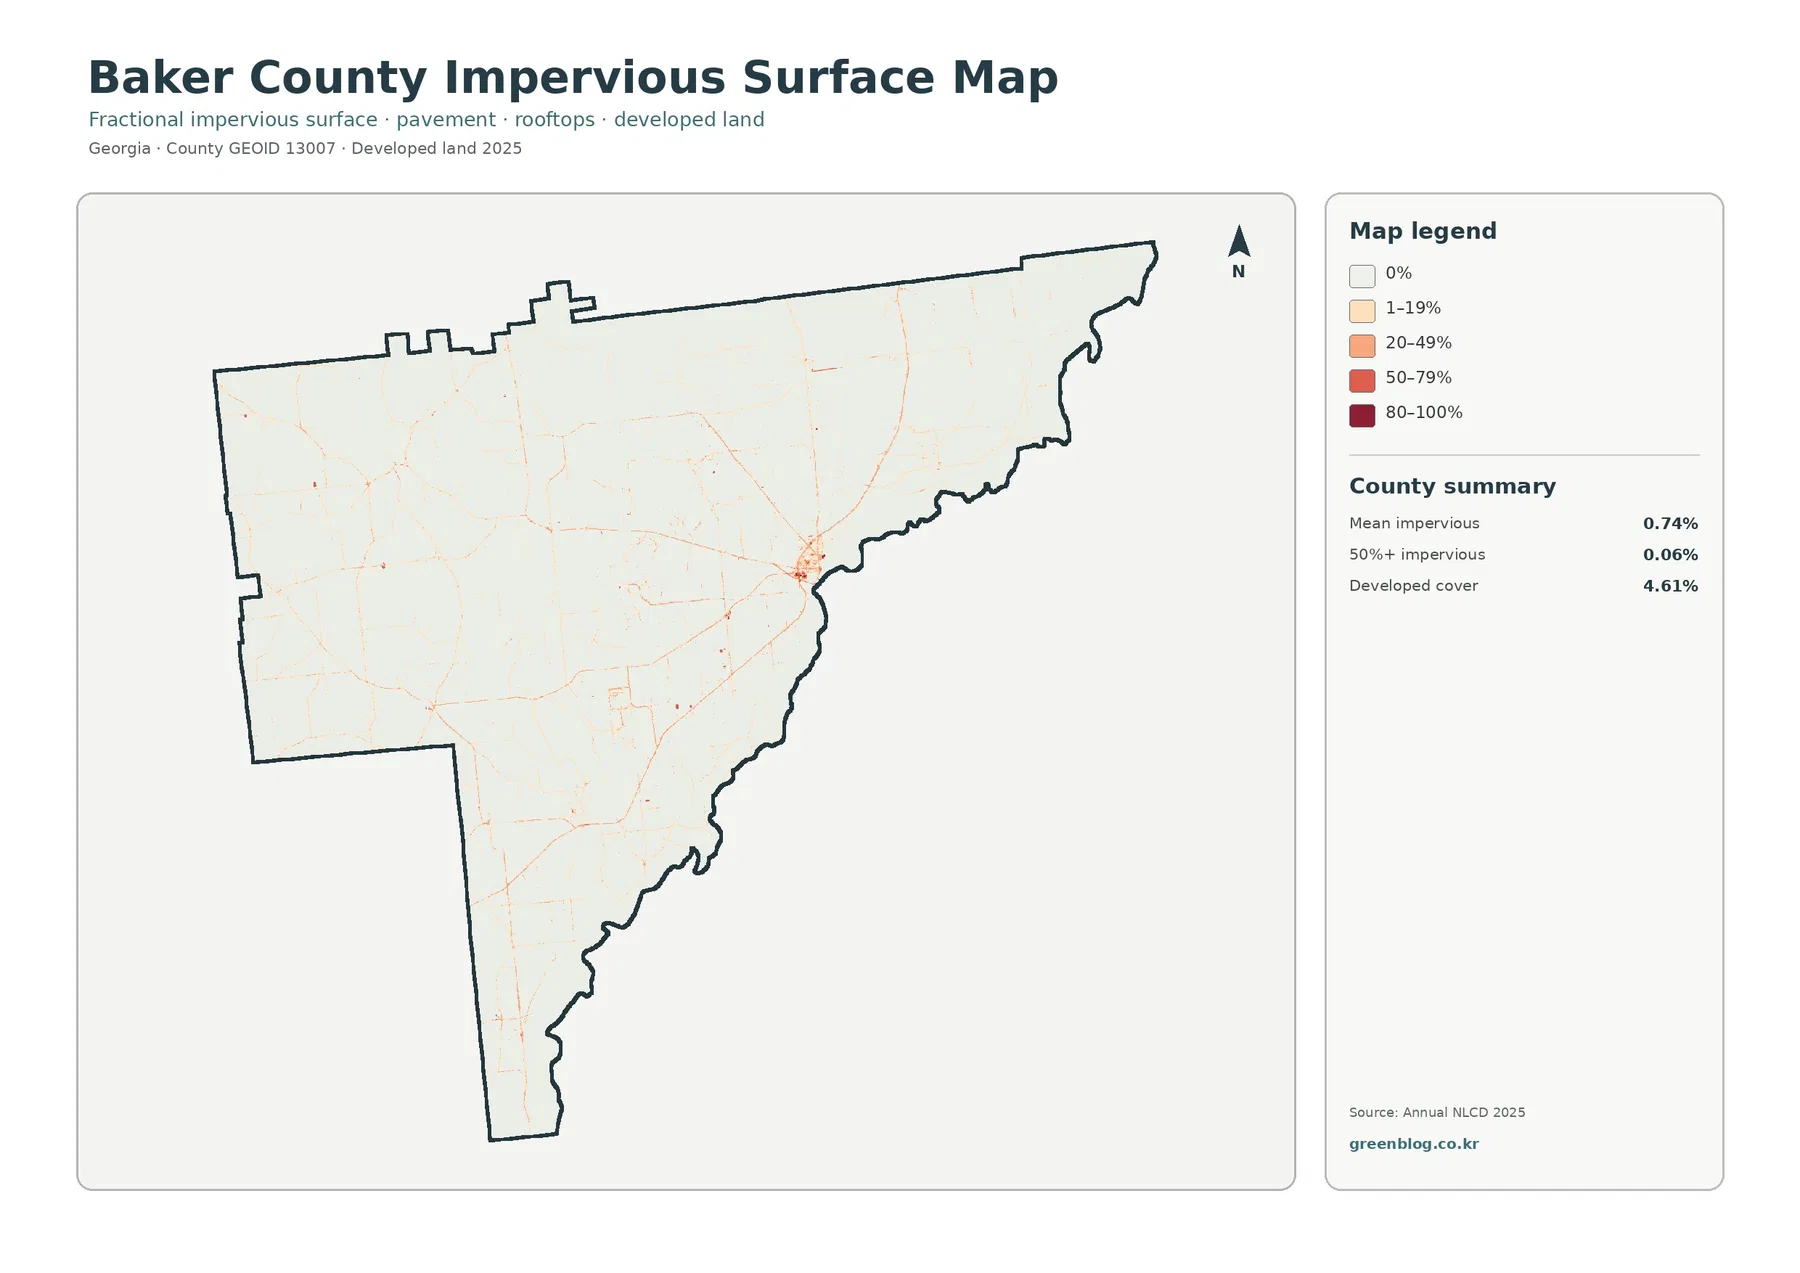
Mean impervious cover is only 0.74%, and just 0.06% of the county is mapped at 50% or greater impervious surface. Those figures are far below the 4.61% developed-land share. A developed cell can include lawns, trees, bare soil, and other permeable ground along with roads and buildings. Impervious data isolate the hard fraction such as rooftops, pavement, and parking areas.
The darkest values are tightly concentrated near the eastern-central developed area, with a few thin traces extending outward. Smaller marks occur elsewhere, but most of the county is almost white on the impervious map. This contrast is useful because the developed class can look more prominent on the general map than the actual countywide area of hard surface would suggest.
Narrow colored traces should not be treated as a labeled road network. Route names, traffic counts, lane numbers, and pavement condition are outside the scope of the layer. A low impervious percentage also does not establish low flood risk. River conditions, wetlands, soils, rainfall, topography, and drainage all influence water movement in ways that this map does not measure.
The 1985–2025 comparison shows fewer differences than many heavily changing counties
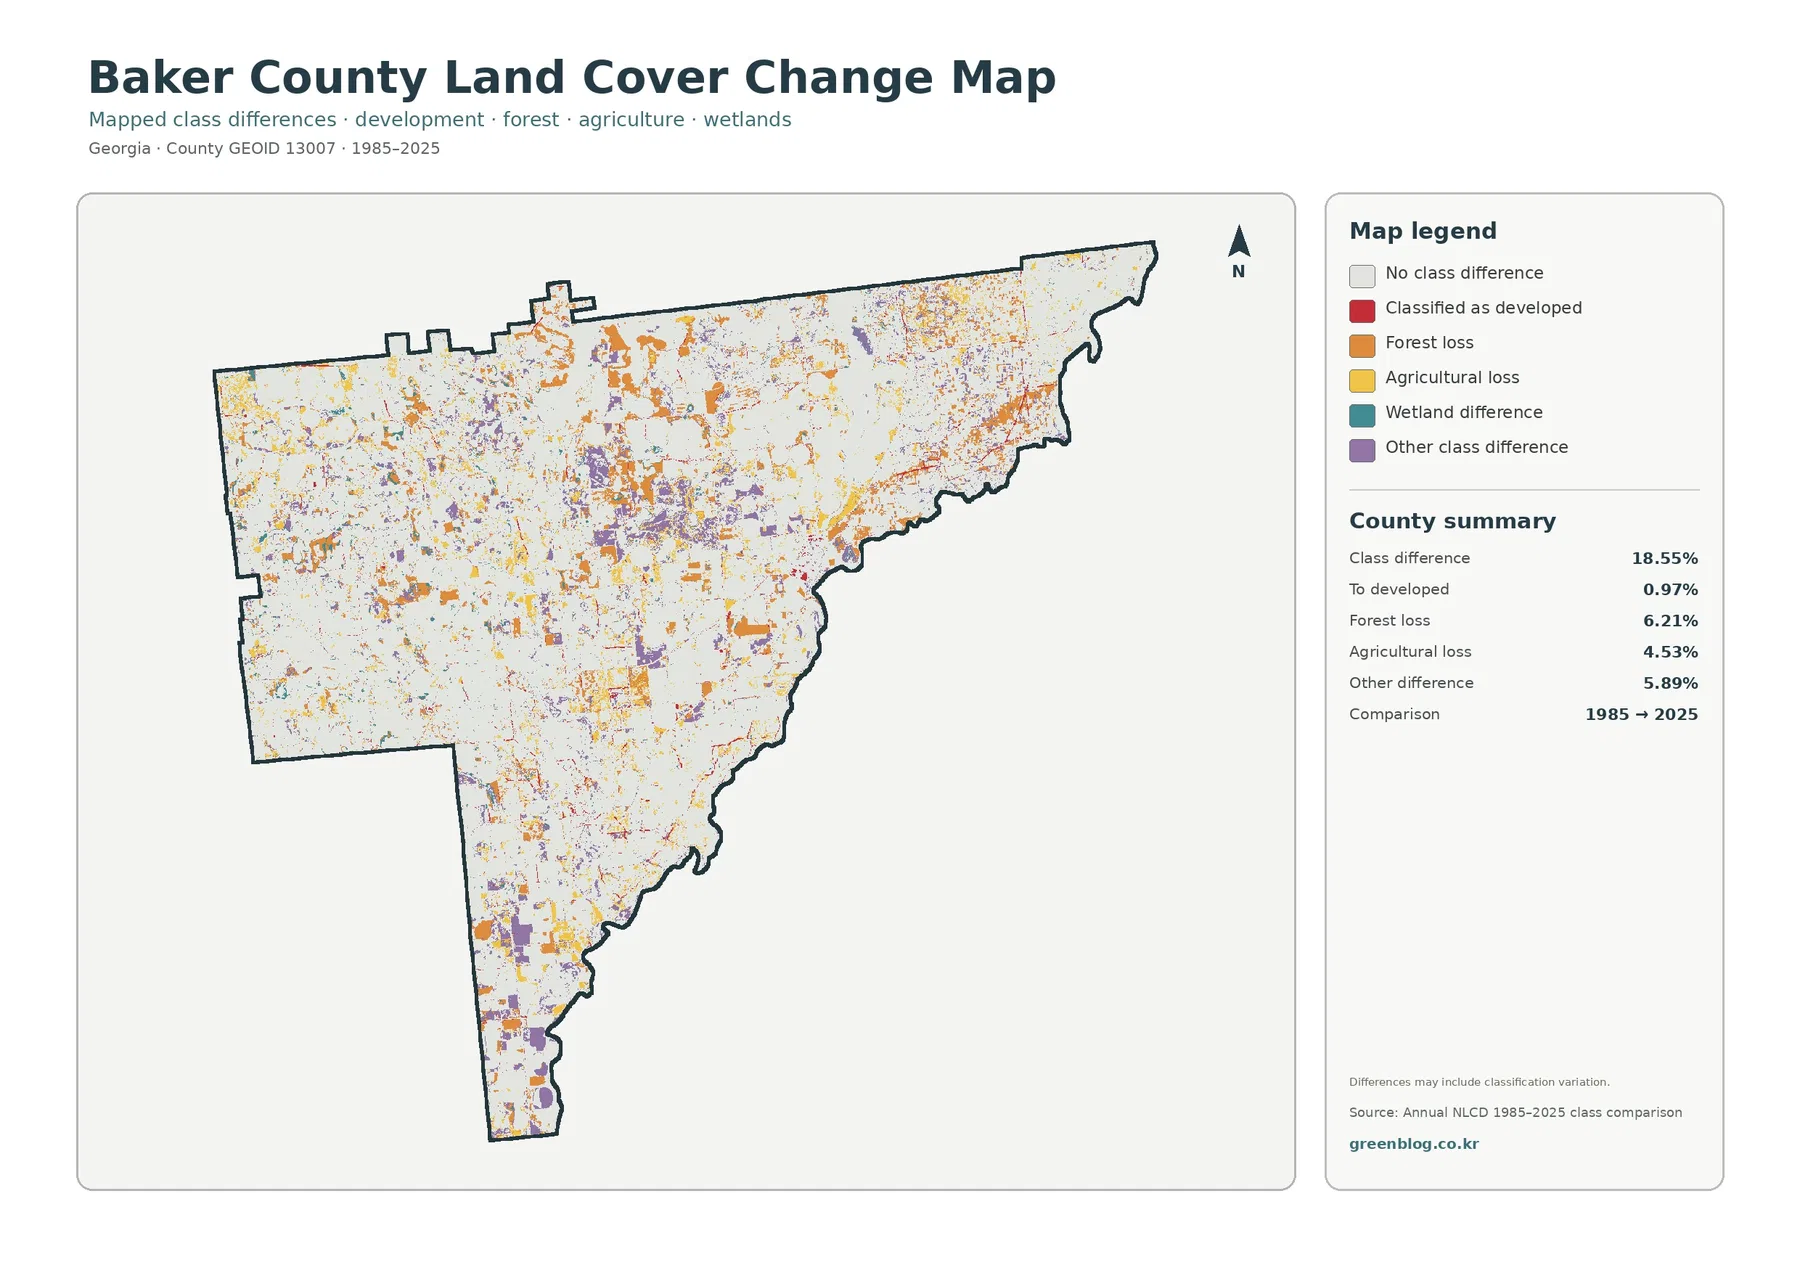
The total class difference is 18.55%. That should not be rewritten as if 18.55% of Baker County was physically transformed. The map identifies raster cells assigned different classes in 1985 and 2025. Real land-cover change can contribute, but imagery conditions, seasonal differences, mixed cells, and classification methods may also influence whether the two endpoints match.
Forest loss is the largest named difference category at 6.21%. Orange cells appear through the north, east, center, and parts of the south. The current forest share of 32.36% and the 6.21% forest-loss value answer different questions. One describes the 2025 surface; the other identifies a two-date comparison category.
Agricultural loss is 4.53%, cells classified as developed account for 0.97%, and other class difference is 5.89%. Yellow agricultural-loss and purple other-difference cells are scattered widely, while red developed differences are limited. Wetland difference is present in the legend but does not have a separate verified percentage in the supplied county summary, so an exact value should not be estimated from the image.
Nearby change colors do not prove cause. A forest-loss cell beside agricultural-loss or developed-difference cells does not establish which land process occurred or why. Timber activity, farm rotation, land conversion, vegetation recovery, wetness, storms, or classification variation may contribute. Intermediate imagery or local land-use records are needed for a site-specific explanation.
Three comparisons make the percentages easier to interpret correctly
The first comparison is agriculture versus agricultural loss. Agriculture is 40.16% in 2025, while agricultural loss is 4.53% in the two-date map. The loss value cannot simply be added to the current share to reconstruct the 1985 percentage. Current cover and change category are different measurements.
The second comparison is developed land versus impervious surface. Developed cover is 4.61%, but mean impervious cover is only 0.74% and the area at 50% or greater impervious surface is 0.06%. The broader developed class therefore contains substantial permeable ground, and the hardest surfaces occupy a very small countywide share.
The third comparison is wetlands versus open water. Wetlands cover 16.29%, while open water is only 0.78%. Teal wetland cells represent wet ground and wetland vegetation, not simply visible blue water. This distinction is especially useful in Baker County because wetlands are a meaningful part of the landscape even though large open-water areas are limited.
Use the four maps as complementary views rather than interchangeable illustrations
For a general county profile, start with the 2025 overview. It shows the balance among agriculture, forest, wetlands, development, and open vegetation. If the focus is farming or woodland, the forest-and-farmland map is easier to read because the developed class is visually reduced. For questions about how built-up the county actually is, the impervious map is more informative than the developed percentage alone.
The change map belongs after the current maps because its colors represent differences between 1985 and 2025, not current land cover. When comparing Baker County with another Georgia county, use the same observation year and classification system whenever possible. A comparison that mixes years can blur the difference between geography and change over time.
Land cover is not zoning, ownership, or a parcel survey
Land cover describes what physically covers the ground as classified from remote sensing. An agricultural cell is not a zoning designation, a forest cell does not identify public ownership, and a developed cell does not establish development rights. Baker County and Newton planning documents should be used separately for land-use and policy questions.
Annual NLCD is raster data. The landscape is divided into grid cells, and each cell receives one representative class even though the real ground may contain crops, trees, grass, pavement, water, and buildings together. Small field edges, wetland boundaries, roads, and forest openings should therefore be treated as generalized rather than survey-accurate.
The original JPG files in this package are 2480×1754 pixels each. Enlarging them can make small colored areas easier to see, but it cannot create new source detail. The asset manifest does not mark the files as meeting the package’s A3 high-resolution reference. They remain useful for screen viewing, presentations, ordinary handouts, and county-scale comparison, while very large printing should be checked at the intended output size.
Frequently Asked Questions
Why does Baker County look more agricultural in the west and south?
The supplied 2025 map places many of the largest agricultural blocks in the west, southwest, and long southern portion of the county. Forest and wetlands are more prominent toward the north and east, although all three classes overlap in many locations. Agriculture is the largest countywide class at 40.16%.
Why is developed land 4.61% while mean impervious cover is only 0.74%?
Developed land can contain lawns, trees, soil, and other permeable surfaces together with roads and buildings. Impervious cover isolates hard surfaces such as rooftops and pavement. Only 0.06% of the county is mapped at 50% or greater impervious surface, showing that very hard surfaces are highly concentrated.
Does the 18.55% class difference mean that much of the county physically changed?
No. It is the share of cells classified differently in the 1985 and 2025 comparison. Supplied components include 0.97% to developed, 6.21% forest loss, 4.53% agricultural loss, and 5.89% other difference. Classification variation may be included, so specific causes require additional evidence.
Sources and Reference Data
- MRLC Annual NLCD Data – annual land-cover data used for the 2025 and two-date comparison views.
- USGS Annual NLCD Land Cover Classification – definitions for agricultural, forest, wetland, developed, and other mapped classes.
- U.S. Census Bureau TIGER/Line Shapefiles – official county-boundary reference for Baker County.
- UGA Extension Baker County – Agriculture & Natural Resources – official local agriculture and natural-resource information.
- Georgia DCA – Baker County & Newton Comprehensive Plan – official planning resources for Baker County and the City of Newton.
- The Jones Center at Ichauway – About Us – local information on longleaf pine, wetlands, agricultural fields, streams, and Flint River environments in Baker County.
Map File Information
This ZIP contains the four original JPG maps used to compare 2025 land cover and related themes across Baker County.
- Included Files: Use only the versions confirmed in the article and supplied images
- File Type: Use the confirmed download contents
- Intended Use: Printing, education, presentations, and map-based projects
Related Maps
- Appling County Georgia Land Cover Map
- Atkinson County Georgia Land Cover Map
- Bacon County Georgia Land Cover Map
Green Map creates custom-edited map images using open geographic data sources such as geoBoundaries, Natural Earth, OpenStreetMap, and government open data.
These maps are edited visual materials, not raw data files, and are provided for education, documents, presentations, and graphic reference.