The Baldwin County Georgia Land Cover Map is primarily a forest map with a sizable urban center embedded inside it. Forest accounts for 53.62% of the supplied 2025 summary, while developed land reaches 13.84% and agriculture 11.89%. Wetlands cover 7.47%, grassland 4.97%, shrubland 4.24%, and open water 3.64%. The strongest developed concentration sits near the middle of the county around Milledgeville, while large wooded areas spread west, south, and east and a major water body stands out along the northern side.
The page provides four complementary JPG-based views: current land cover, forest and farmland, impervious surface, and the 1985–2025 class comparison. WebP previews are placed in the article, and the four original JPG files can be downloaded together in one ZIP below. The set is most useful when the reader separates present-day cover from development intensity and then treats the change map as a two-date comparison rather than a picture of current conditions.
Table of Contents
Milledgeville forms a strong developed center inside a mostly wooded county
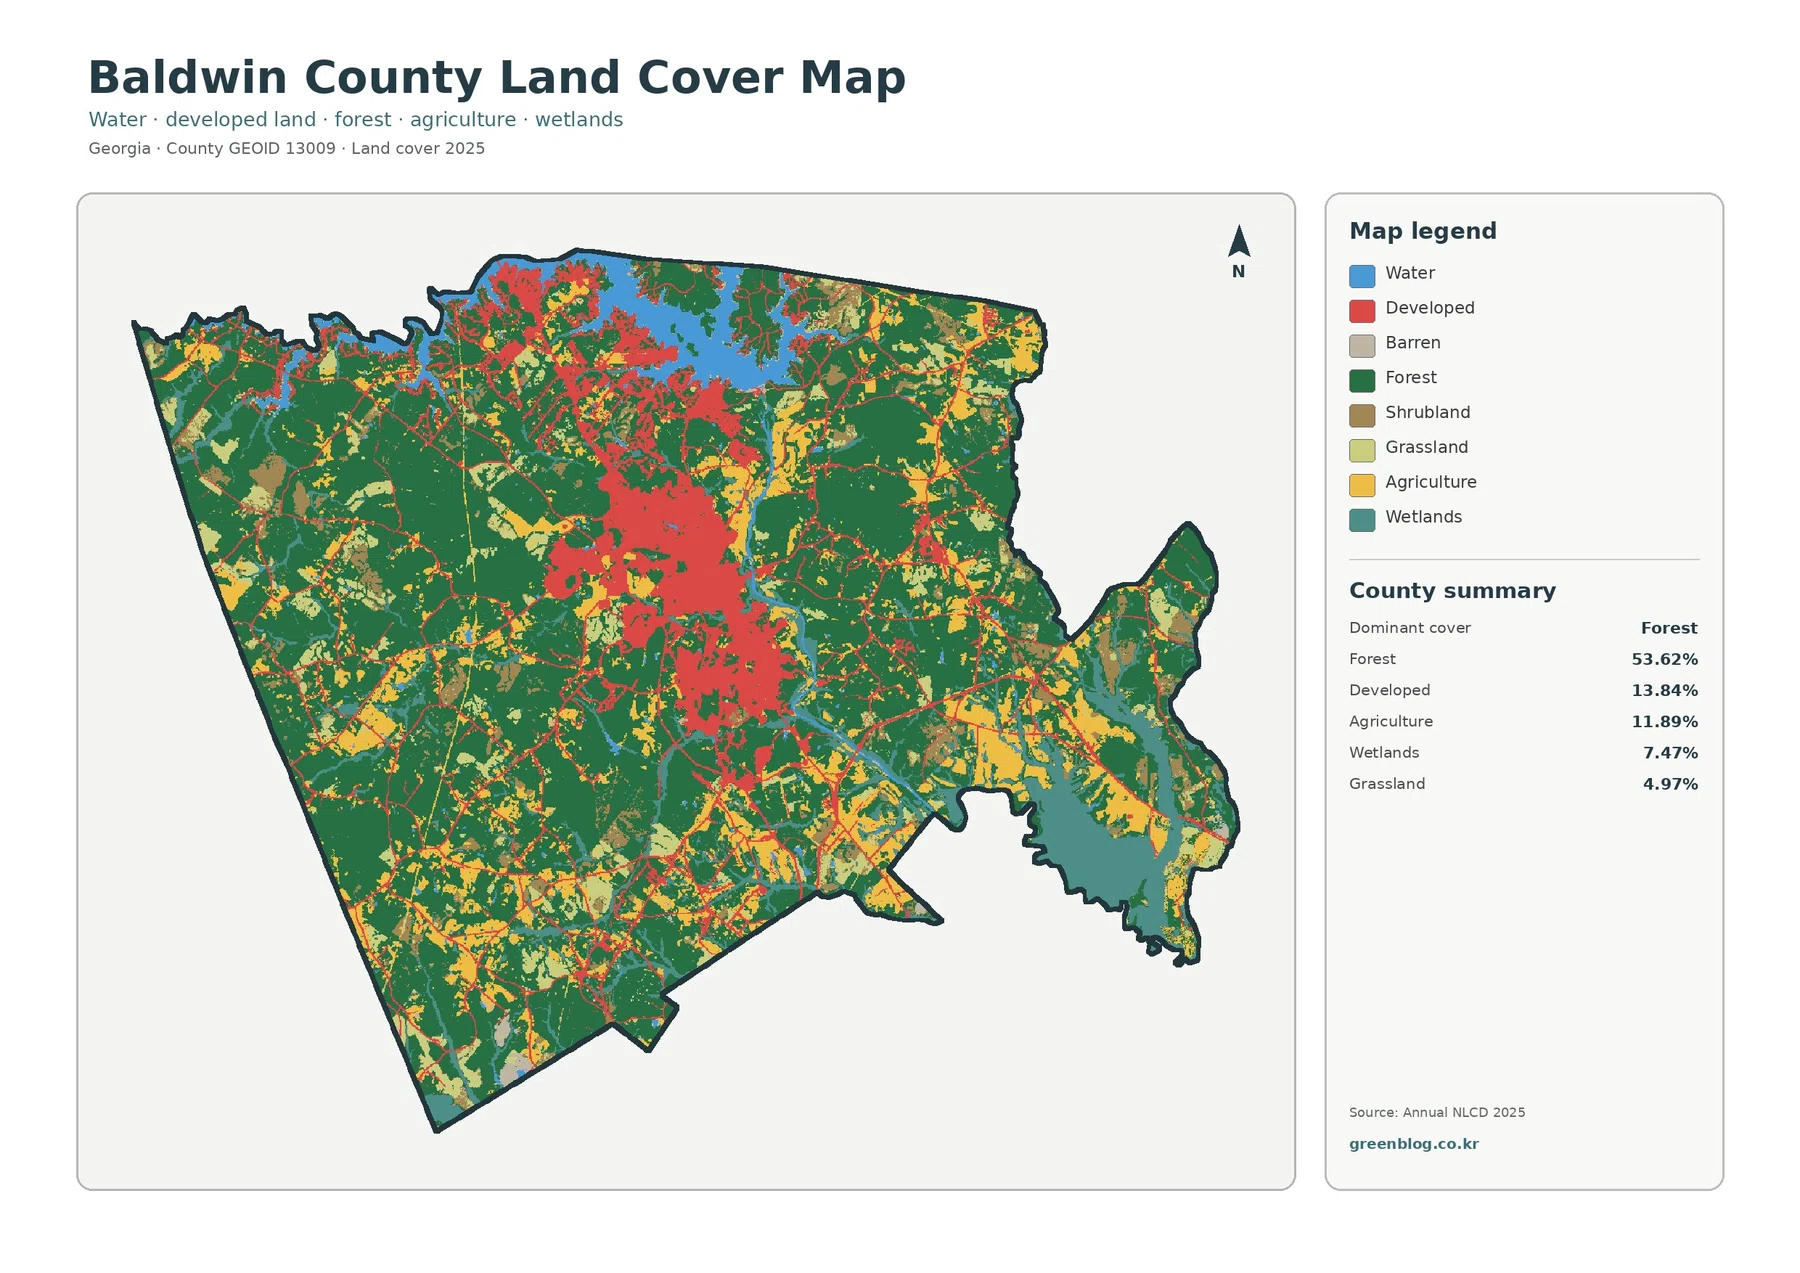
Dark green covers large portions of western and southwestern Baldwin County and remains extensive across the east and south. Forest also surrounds much of the developed center instead of disappearing near it. With 53.62% of the county classified as forest, wooded cover is not just the largest category on paper; it is the surface that visually connects most parts of the county.
Developed land is the second-largest class at 13.84%. Red cover is concentrated near the center and extends northward, with smaller branches and patches reaching toward the east, west, and south. The Georgia Department of Community Affairs maintains a joint comprehensive plan for Baldwin County and the City of Milledgeville, providing official local planning context for this central urban concentration. The red raster class should still not be mistaken for Milledgeville’s exact municipal boundary.
Agriculture accounts for 11.89% and is more visible in the east and southeast, with smaller fields distributed elsewhere. Grassland and shrubland add another set of open surfaces around farms, roads, forest edges, and developed places. That mix matters because an open-looking area is not automatically cropland, and a developed neighborhood can still contain enough trees or grass for adjacent cells to fall into other classes.
Lake Sinclair gives the northern side a water pattern that is hard to miss
Open water makes up only 3.64% of the county summary, yet the large blue area near the north is visually prominent. Georgia Environmental Protection Division documentation confirms that Lake Sinclair lies in Baldwin, Hancock, and Putnam counties. That official context helps identify why water occupies such a recognizable part of the northern Baldwin County landscape even though it remains a small percentage of total county area.
Wetlands are a separate 7.47% class. Teal cover occurs around water but also appears farther away in eastern, southeastern, and central locations. A wetland cell can represent saturated soil or wetland vegetation without being open water, so the blue and teal classes should not be combined. In practical terms, Baldwin County has more wet ground than the open-water percentage alone would suggest.
Removing the visual weight of the city reveals how continuous the forest really is
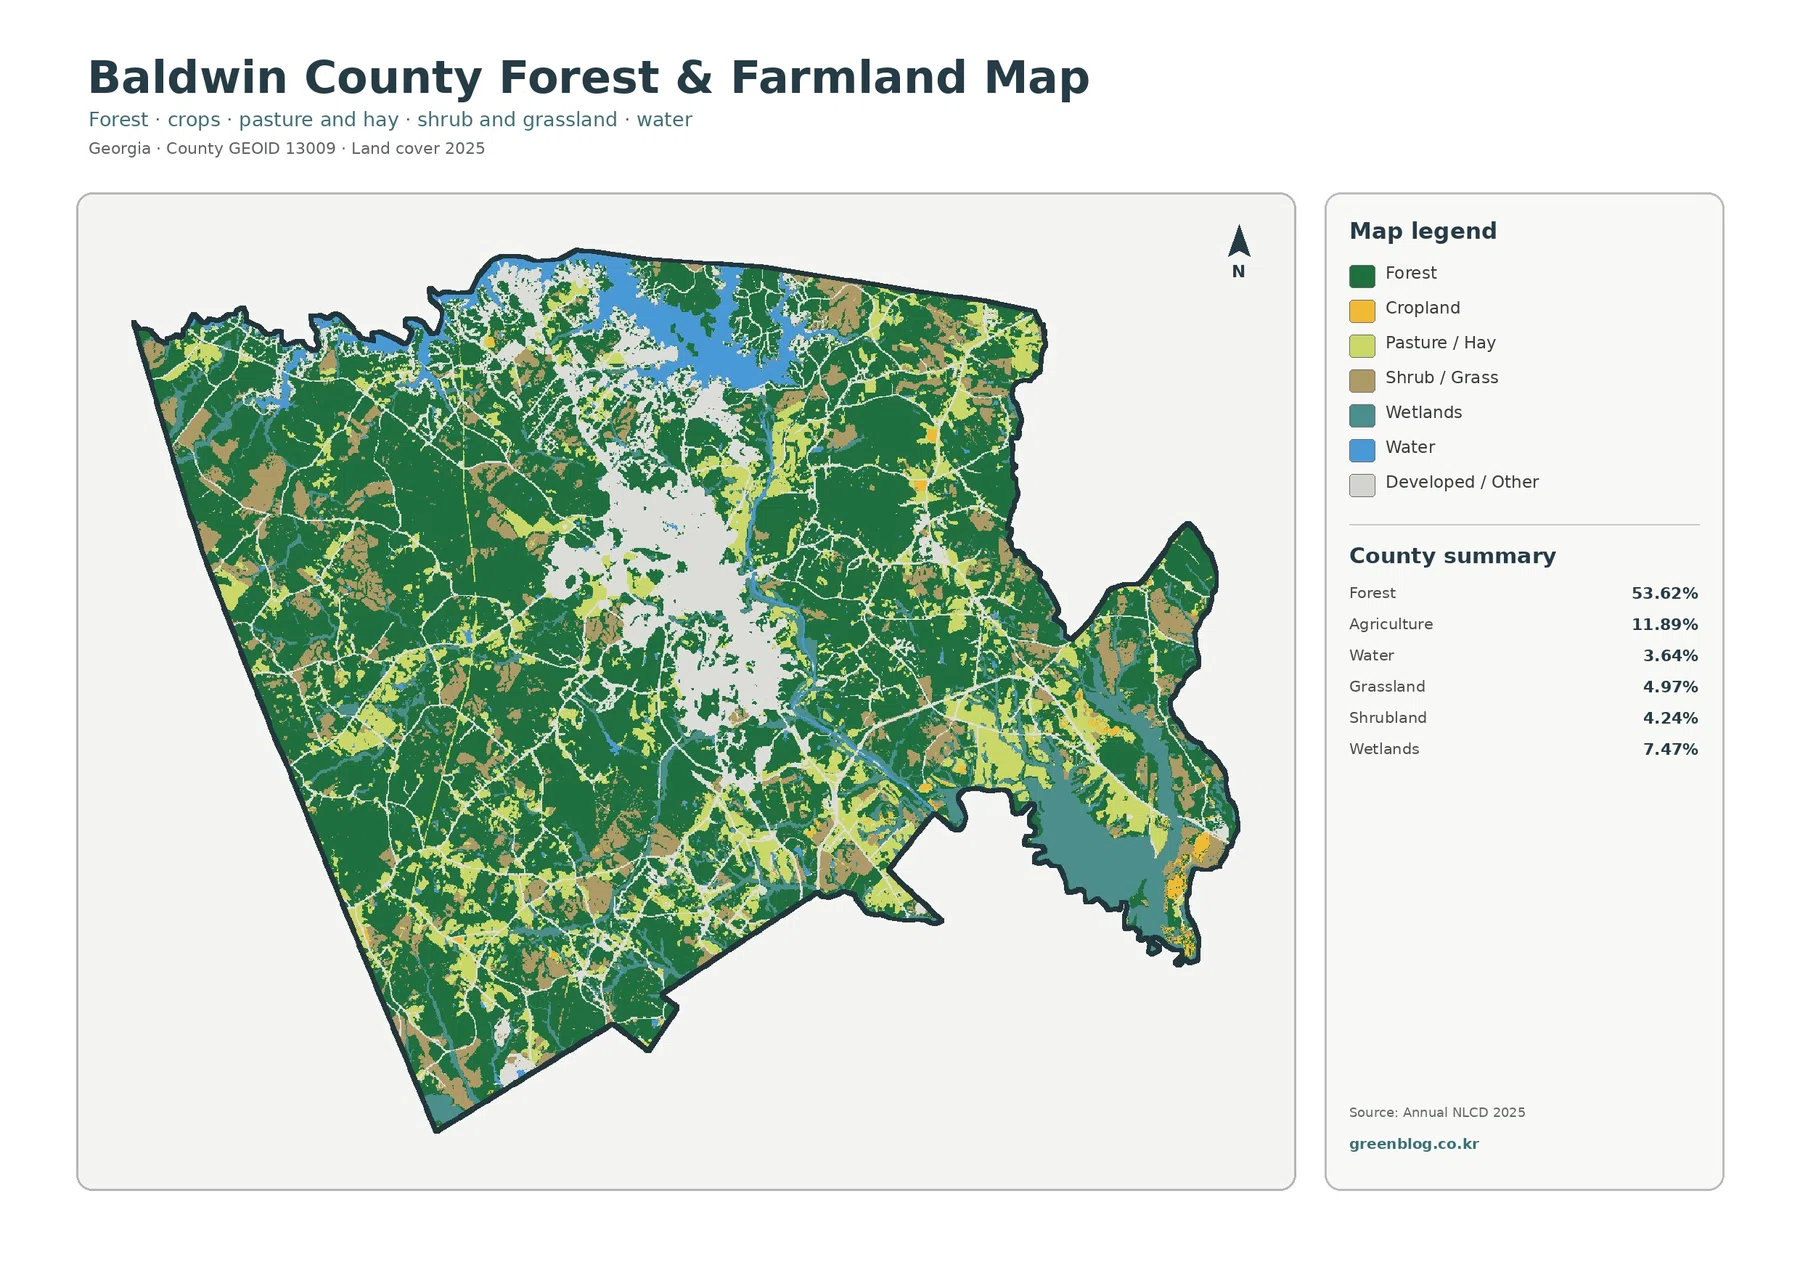
The vegetation-focused map makes the west and southwest look even more strongly forested because the central developed area is subdued. Agricultural colors become easier to pick out in the east and southeast, and smaller farm blocks can be followed through the center and west. Forest remains the dominant background around most of them, which explains why the county can support meaningful agricultural activity without agriculture being the leading land-cover class.
UGA Extension Baldwin County adds useful local detail. Its recent county impact reporting lists forestry-related products, beef cows, and timber among leading commodities and discusses pasture-management work involving alfalfa and bermudagrass. Those facts fit a county where forest, grass, and agricultural cover all matter. They do not identify the use of any individual raster cell, so a green block should not automatically be labeled timberland and a light-green area should not automatically be labeled cattle pasture.
The map legend distinguishes cropland from pasture or hay, but the package supplies one verified agriculture total of 11.89%. Exact percentages for those agricultural subtypes should not be reconstructed from the image. The stronger use of this map is positional: it shows where farm-related cover appears relative to forest, wetlands, water, and the faded developed center.
Impervious cover isolates the hard-surface core of the developed area
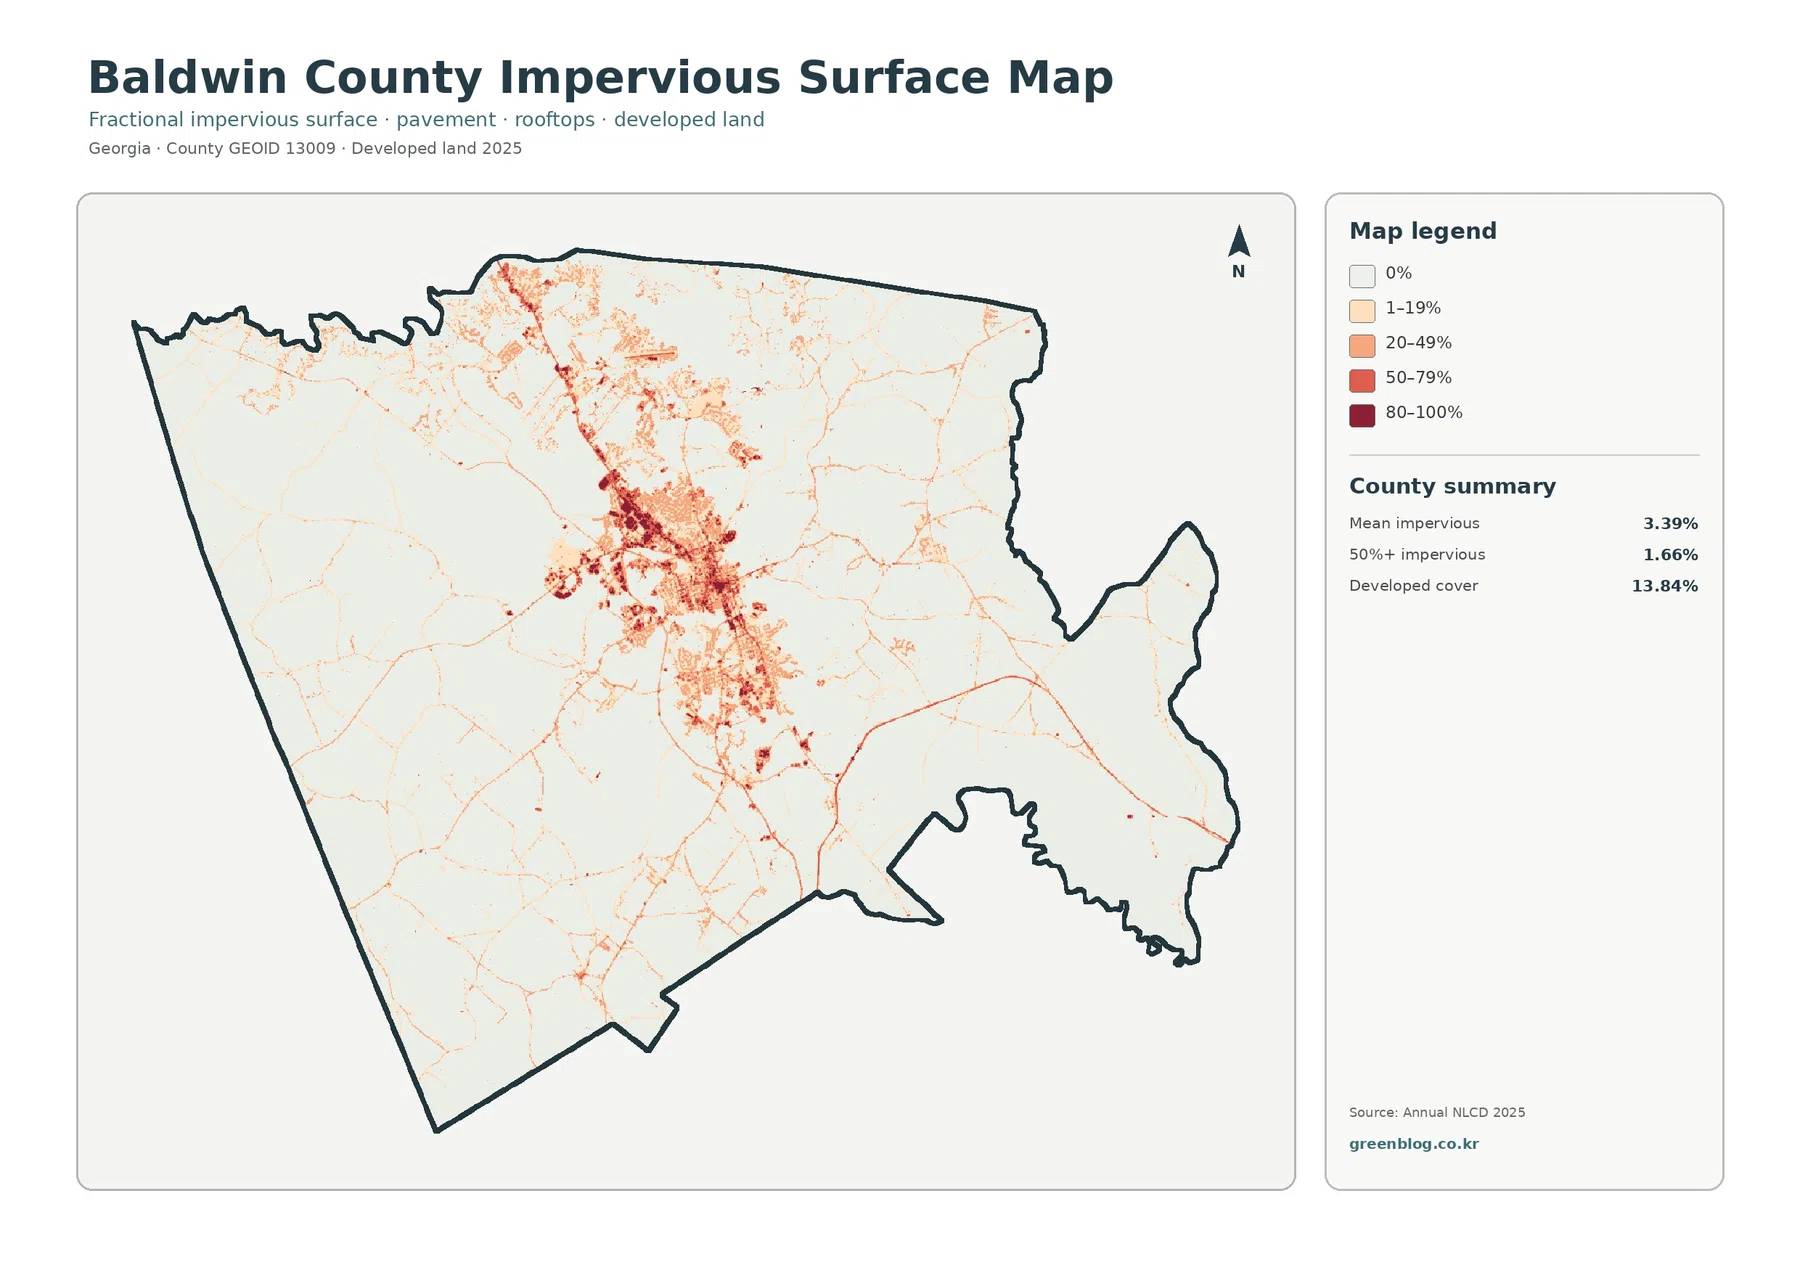
Mean impervious cover is 3.39%, while 1.66% of the county is mapped at 50% or greater impervious surface. Impervious surfaces are rooftops, pavement, parking areas, and similar hard materials that do not readily absorb rainfall. The much larger 13.84% developed-land share includes lawns, trees, soil, and other permeable ground, so it should not be read as if nearly fourteen percent of Baldwin County were paved.
The darkest values are tightly grouped in the central developed area, with narrow lines and smaller patches extending outward. Much of the western and southern forest remains close to the lightest end of the legend. This contrast gives a clearer picture of development intensity than the general map alone: Baldwin County has a visible urban core, but high concentrations of hard surface occupy only a small portion of the county.
Thin high-impervious traces may resemble roads, but the layer does not provide road names, traffic volume, lane count, or ownership. It is also not a flood-risk map. A location’s response to rainfall depends on drainage, soils, topography, streams, reservoirs, and other conditions in addition to hard-surface percentage.
The 1985–2025 comparison is broad, with “other difference” larger than any named loss category
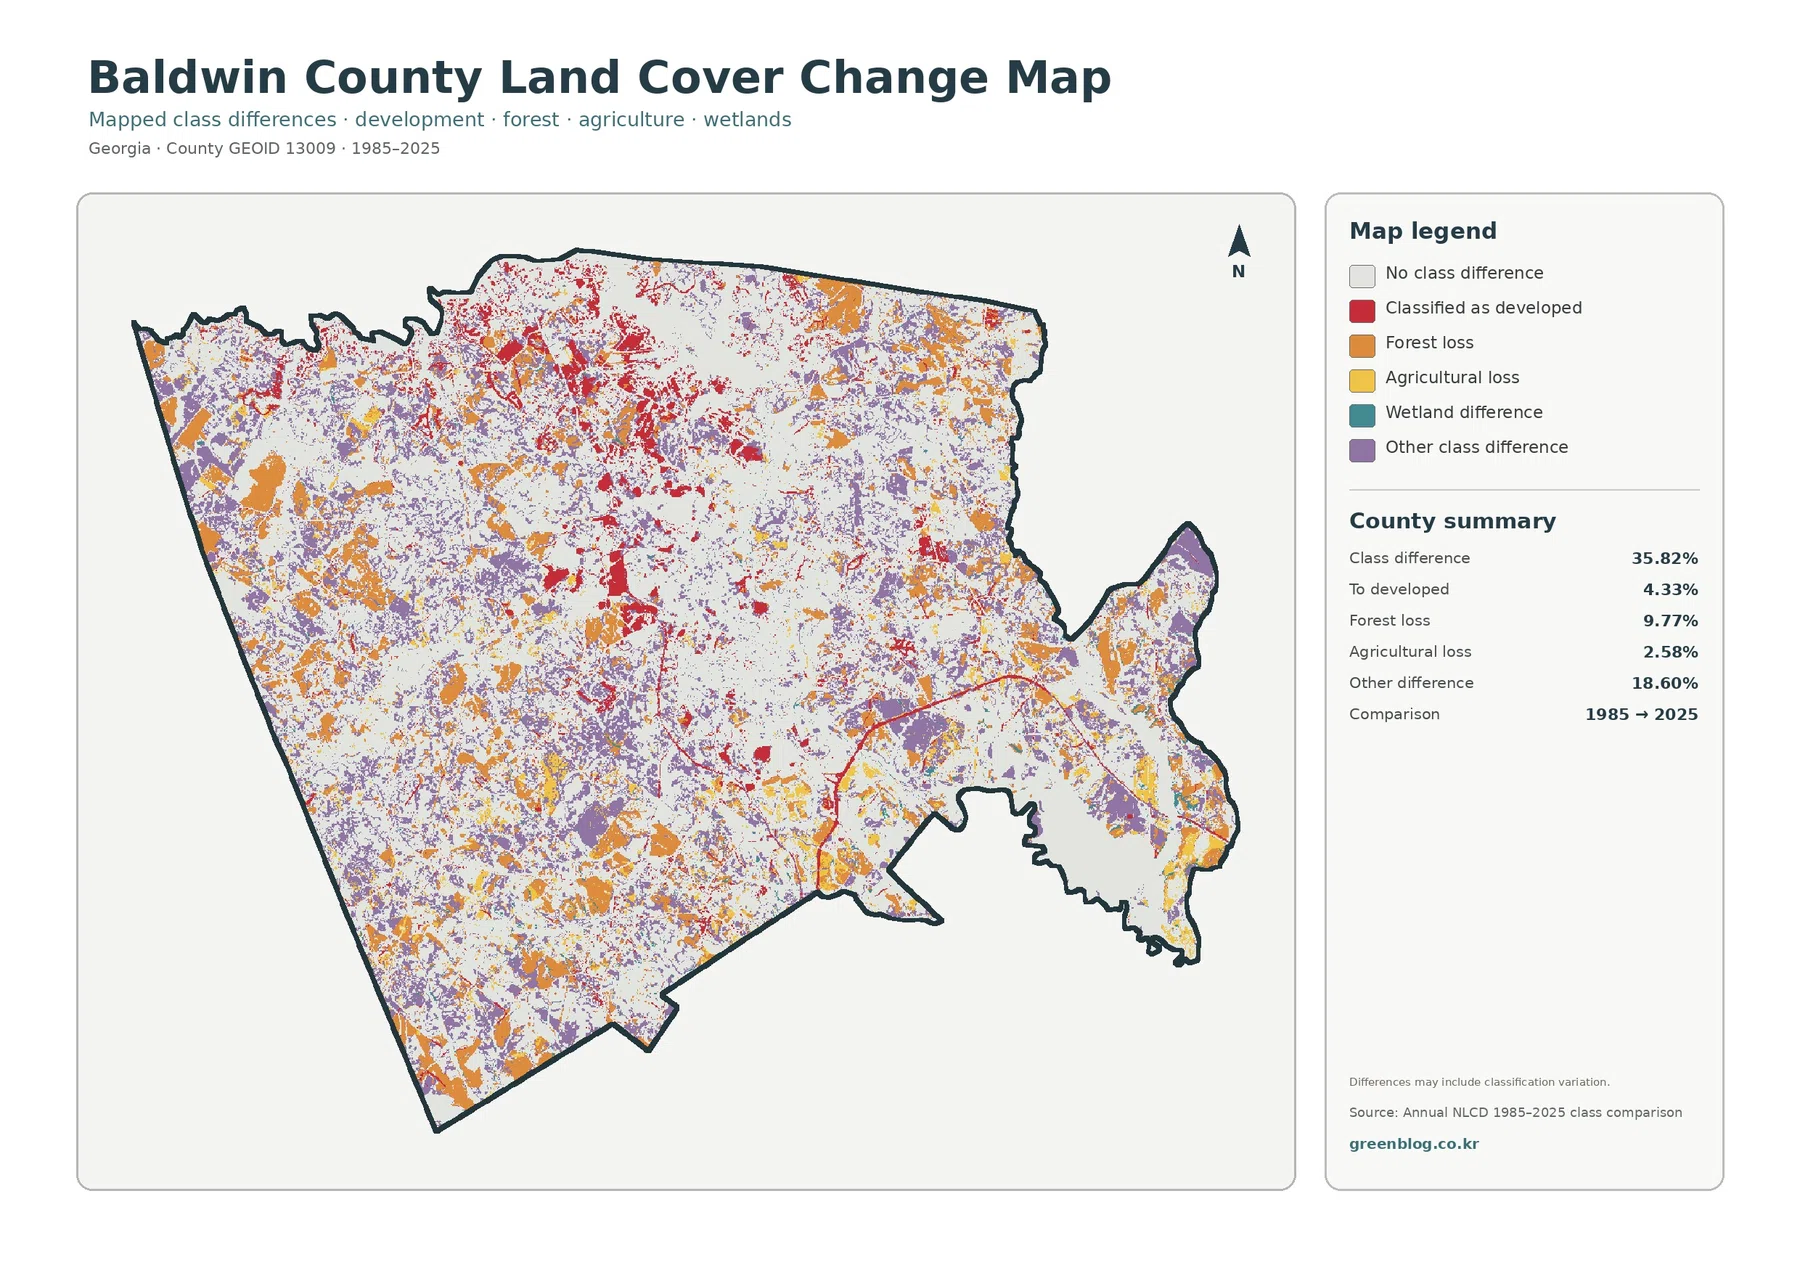
The total class difference between 1985 and 2025 is 35.82%. That number does not mean 35.82% of the county was physically converted from one land use to another. It is the share of raster cells assigned different land-cover classes at the two endpoints. Real changes can be part of that result, but imagery conditions, seasonal effects, mixed pixels, and classification methods can also produce differences.
Cells classified as developed account for 4.33% of the comparison. Forest loss is 9.77%, agricultural loss 2.58%, and other class difference 18.60%. The purple other-difference category is especially widespread, so the overall change percentage cannot reasonably be summarized as urban expansion or forest loss alone. Several kinds of difference contribute to the map.
Wetland difference is visible in the legend but has no separate verified county percentage in the supplied summary. Its locations can be described, but an exact rate should not be estimated from colored pixels. Nearby orange and red cells also do not establish cause: a forest-loss difference next to a developed difference does not prove that development caused the forest change.
Frequently Asked Questions
What is the largest 2025 land-cover class in Baldwin County?
Forest is the largest class at 53.62%. Developed land follows at 13.84%, agriculture at 11.89%, wetlands at 7.47%, grassland at 4.97%, shrubland at 4.24%, and water at 3.64%. The forest majority is especially clear outside the central Milledgeville-area developed concentration.
Why is developed land 13.84% while mean impervious cover is only 3.39%?
Developed land includes permeable surfaces such as lawns, trees, and soil along with buildings and pavement. Impervious cover isolates the hard portion. The area mapped at 50% or greater impervious surface is 1.66%, showing that the most heavily hardened surfaces are concentrated in a much smaller part of the county.
Does the 35.82% class difference equal the area that physically changed?
No. Instead, 35.82% is the portion of mapped cells whose endpoint classes do not match between 1985 and 2025. Supplied components include 4.33% to developed, 9.77% forest loss, 2.58% agricultural loss, and 18.60% other difference. Classification variation may be included, so a specific cause requires additional evidence.
A practical reading order depends on whether the topic is forest, city, water, or change
For a general county introduction, the 2025 overview works best because it places the forest majority, Milledgeville-area development, Lake Sinclair, agriculture, and wetlands in one frame. A forestry or rural-land presentation can then switch to the forest-and-farmland view, where the city fades and the extent of wooded cover becomes much more apparent.
If the question is how built-up Baldwin County really is, the impervious map is more informative than the developed percentage alone. The change map should come later because its colors refer to differences between two dates rather than current cover. When comparing Baldwin with another Georgia county, use the same year and classification system so geographic differences are not mixed with differences in data vintage.
Raster land cover is a county-scale reference, not a parcel or zoning map
Annual NLCD divides the ground into raster cells and assigns one representative land-cover class to each cell. Real locations can contain trees, pavement, buildings, grass, water, and bare soil within a small area, so the mapped class is a simplification. Shorelines, narrow roads, wetland edges, farm boundaries, and small forest openings are especially likely to look more generalized than they would in detailed local mapping.
Land cover also does not establish ownership, zoning, or development rights. A forest cell is not proof of public forest, an agricultural cell is not a legal agricultural district, and a developed cell is not a permit. Baldwin County and Milledgeville planning or parcel records are the appropriate sources when the question concerns a specific property or legal land use.
Each original JPG in this package is 2480×1754 pixels. Enlarging the image can make small patterns easier to inspect, but it cannot add detail beyond the source. The asset record does not mark these files as meeting the package’s A3 high-resolution reference. They are suitable for screen viewing, presentations, ordinary handouts, and county-scale comparisons; very large printing should be checked at the intended output size first.
Map File Information
The ZIP contains the four original JPG maps used to compare Baldwin County's 2025 cover, vegetation, hard surfaces, and two-date class differences.
- Included Files: Four original JPG maps described on this page
- File Type: JPG images packaged in a ZIP archive
- Intended Use: Printing, education, presentations, and map-based projects
Related Maps
- Appling County Georgia Land Cover Map
- Atkinson County Georgia Land Cover Map
- Bacon County Georgia Land Cover Map
Sources and Reference Data
- MRLC Annual NLCD Data – source data for Baldwin County’s 2025 cover map and the 1985–2025 endpoint comparison.
- USGS Annual NLCD Land Cover Classification – definitions for forest, developed, agricultural, wetland, and other mapped classes.
- U.S. Census Bureau TIGER/Line Shapefiles – official county-boundary reference for Baldwin County.
- UGA Extension Baldwin County – Our Impact – county-specific forestry, livestock, pasture, and land-management context.
- Georgia DCA – Baldwin County & Milledgeville Comprehensive Plan – official county and city planning resources.
- Georgia EPD – Lakes Oconee & Sinclair – state documentation for Lake Sinclair and the Oconee River system.
Green Map creates custom-edited map images using open geographic data sources such as geoBoundaries, Natural Earth, OpenStreetMap, and government open data.
These maps are edited visual materials, not raw data files, and are provided for education, documents, presentations, and graphic reference.