Florida’s population is concentrated in several large metropolitan belts rather than spread evenly across the peninsula and panhandle. On the 2024 ACS census-tract density map, the strongest continuous concentration runs through the Miami–Fort Lauderdale–West Palm Beach corridor. Other prominent clusters surround Tampa Bay, Orlando, Jacksonville, and parts of the southwest and Atlantic coasts. Broad interior and panhandle tracts remain much lighter, so the statewide pattern is a patchwork of dense urban areas separated by substantially less populated land.
County totals tell only part of that story. Miami-Dade has the largest 2024 estimated population at 2,738,356, followed by Broward at 1,977,129, Palm Beach at 1,533,806, Hillsborough at 1,522,748, and Orange at 1,471,937. Yet the county with the highest average density is Pinellas, at roughly 3,519 people per square mile. A county can therefore rank below the largest counties in total residents while still place far more people into each square mile of land.
The decade-change map introduces a third ranking. Between the 2010 and 2020 censuses, Osceola grew by about 44.7%, St. Johns by 43.9%, Sumter by 38.9%, Walton by 36.8%, and Lake by 29.3%. Several counties moved in the opposite direction, including Gulf, Hardee, Lafayette, Calhoun, and Madison. Current population, current density, and the pace of change answer different questions, and Florida is a useful example of why those measures should not be treated as interchangeable.
Table of Contents
The tract map reveals Florida’s sharpest local density contrasts
The detailed map uses 2024 ACS 5-year estimates at the census-tract level and reports people per square mile. Its legend runs from 0–50 people per square mile through 50–200, 200–500, 500–1,000, 1,000–2,500, 2,500–5,000, 5,000–10,000, and 10,000 or more. County boundaries are drawn with heavier lines, while the tract shading exposes variation inside those counties. Darker tracts represent more residents per unit of land.
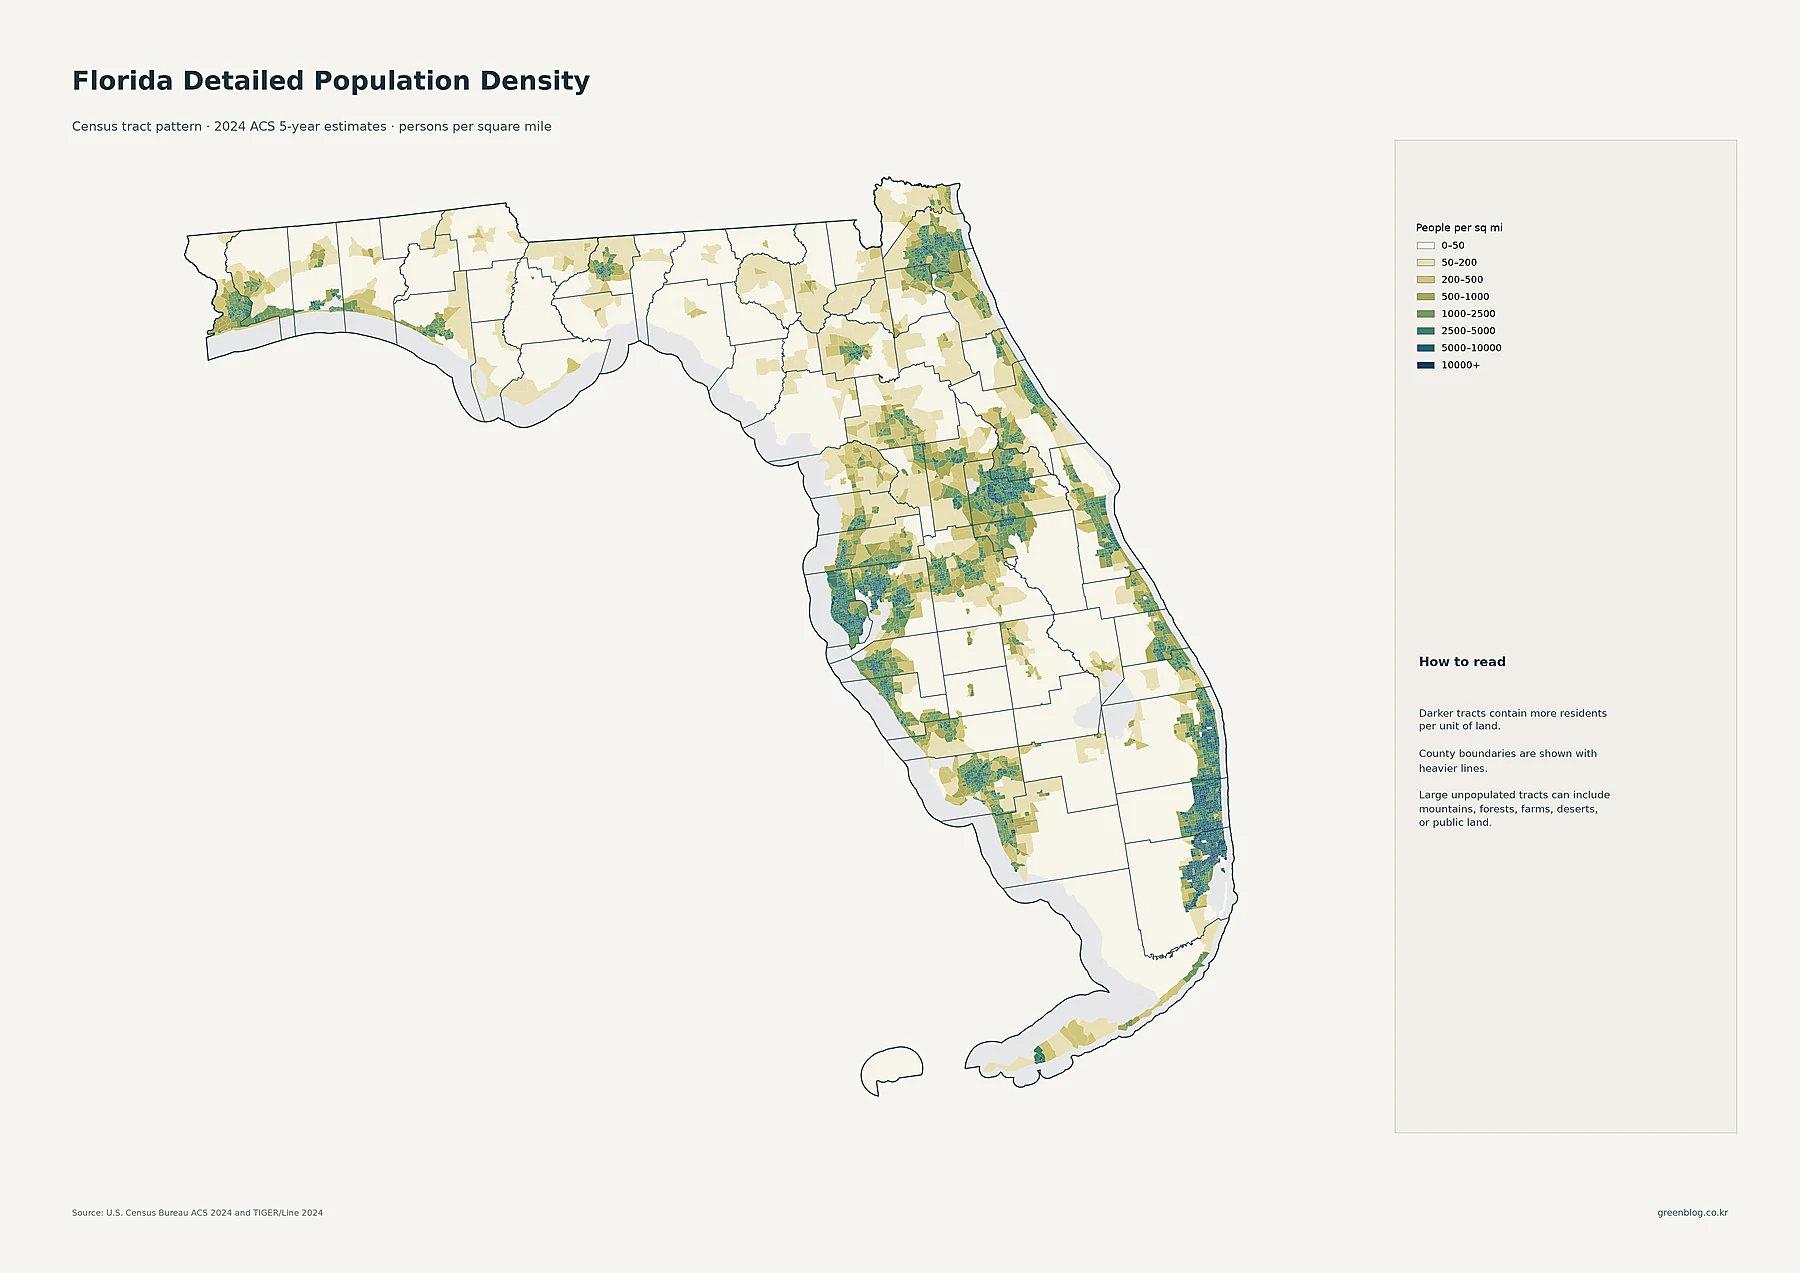
Southeast Florida stands out as the broadest connected high-density zone. Dark tracts extend through the eastern portions of Miami-Dade, Broward, and Palm Beach counties. Around Tampa Bay, Hillsborough and Pinellas show another compact concentration, while the Orlando area creates a large inland cluster across Orange and neighboring Seminole. Jacksonville forms a strong northeast node, and smaller but still visible concentrations appear around Lee and Sarasota on the Gulf side, Brevard and St. Lucie along the Atlantic side, and several panhandle cities.
The map also makes clear why a county average cannot substitute for local detail. A county may contain both very dark urban tracts and large light-colored areas. Conversely, a county with a low overall average can still contain a compact town or city cluster. When the question is “where inside the county do people actually concentrate?”, this tract map is the most informative of the set. The county map later in the article is better for broad comparisons between entire counties.
Major places show that Florida has several large population centers
The major-cities map switches from density to total population in Census places. Circle size compares the population of individual places, and pale urban-area shading shows the available 2020 Census Urban Areas. A large circle does not mean that the place has the highest density. It means the place contains more residents. That distinction matters in Florida because the largest incorporated or census-designated places are distributed among several different metro regions.
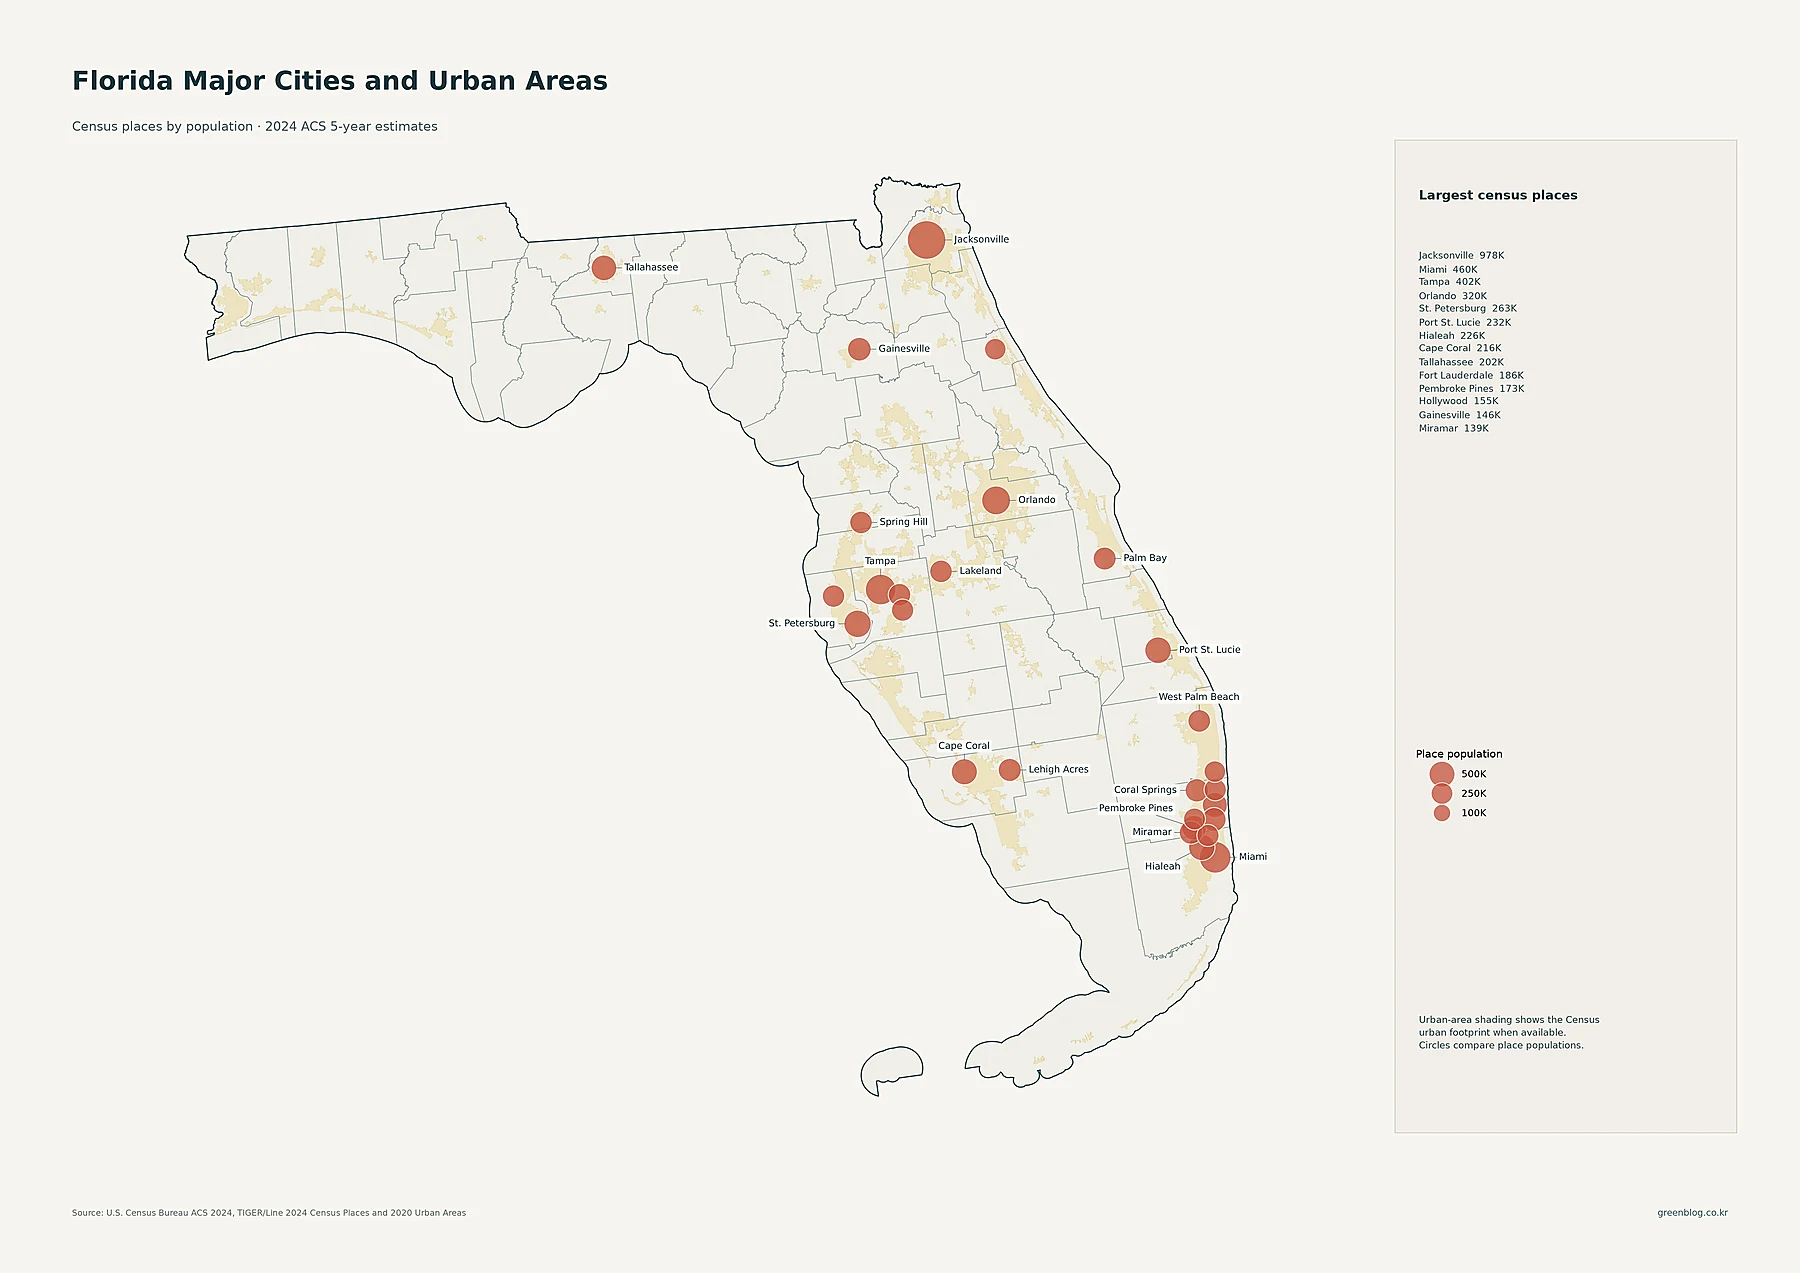
Jacksonville is the largest place in the supplied dataset at 977,670 residents. Miami follows at 459,745, Tampa at 401,618, Orlando at 319,758, and St. Petersburg at 262,732. Port St. Lucie has 232,491, Hialeah 226,165, Cape Coral 215,536, Tallahassee 201,875, and Fort Lauderdale 185,604. Jacksonville appears as one very large northeast circle, while southeast Florida contains a tight group of substantial places—Miami, Hialeah, Fort Lauderdale, Pembroke Pines, Hollywood, Miramar, and others—within the same broader dense corridor.
| Major Census place | 2024 ACS population |
|---|---|
| Jacksonville | 977,670 |
| Miami | 459,745 |
| Tampa | 401,618 |
| Orlando | 319,758 |
| St. Petersburg | 262,732 |
| Port St. Lucie | 232,491 |
| Hialeah | 226,165 |
| Cape Coral | 215,536 |
| Tallahassee | 201,875 |
| Fort Lauderdale | 185,604 |
Tampa and St. Petersburg show the two-sided scale of the Tampa Bay region, Orlando marks a large inland center, and Cape Coral is a major southwest-Florida place. Tallahassee is prominent in the panhandle, while Gainesville appears as a smaller but clearly visible north-central node. Reading the place map beside the tract map helps connect dark local density patterns to the named communities that make up those clusters.
Miami-Dade leads county population, but totals are not density
The county population map uses proportional circles to compare the total number of residents in all 67 counties. The legend and annotation explicitly state that circle area represents total population, not density. Miami-Dade’s circle is the largest because its 2024 ACS estimate is 2,738,356. Broward is next at 1,977,129, followed by Palm Beach at 1,533,806, Hillsborough at 1,522,748, and Orange at 1,471,937. These figures put the largest absolute population concentrations in southeast Florida and the Tampa and Orlando regions.
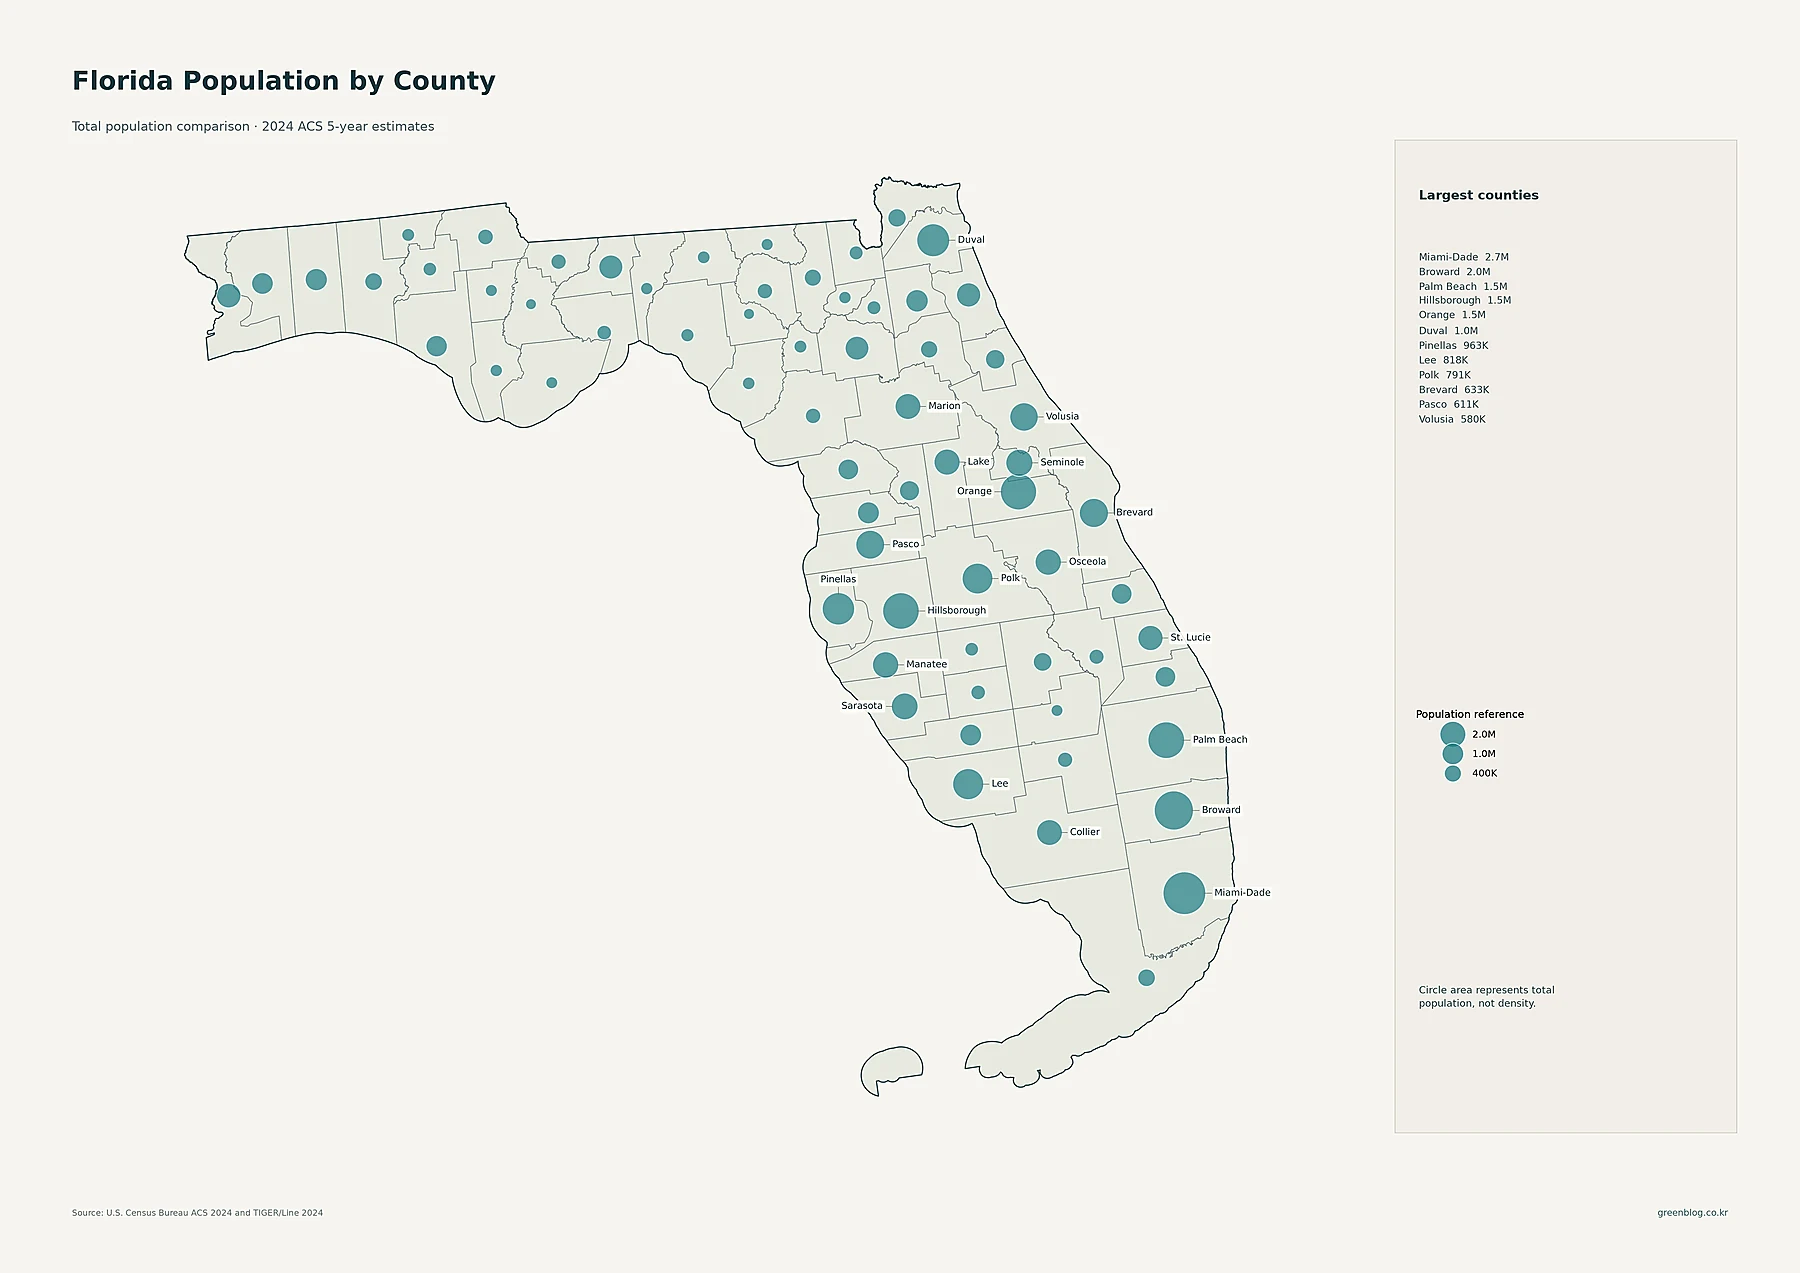
Duval also exceeds one million residents at 1,023,153. Pinellas has 963,481, Lee 817,666, and Polk 790,694. Pinellas is particularly useful for separating population from density: it does not have one of the five largest county populations, yet it becomes the statewide density leader once land area is included. The proportional-circle map is therefore best for questions about absolute population size, not how crowded or spatially concentrated a county is.
| County | 2024 population | People per sq. mi. | 2010–2020 change |
|---|---|---|---|
| Miami-Dade | 2,738,356 | 1,441.3 | +8.2% |
| Broward | 1,977,129 | 1,643.6 | +11.2% |
| Palm Beach | 1,533,806 | 780.8 | +13.0% |
| Hillsborough | 1,522,748 | 1,489.2 | +18.8% |
| Orange | 1,471,937 | 1,630.0 | +24.8% |
| Pinellas | 963,481 | 3,519.1 | +4.6% |
Pinellas has the highest countywide population density
The county-density map divides the current ACS population by land area. Its legend ranges from fewer than 10 people per square mile to 2,500 or more. The statewide summary printed on the map lists 22,416,077 residents, 53,655 square miles of land, and an average density of about 418 people per square mile. Pinellas stands alone in the top density class at roughly 3,519.1 people per square mile.
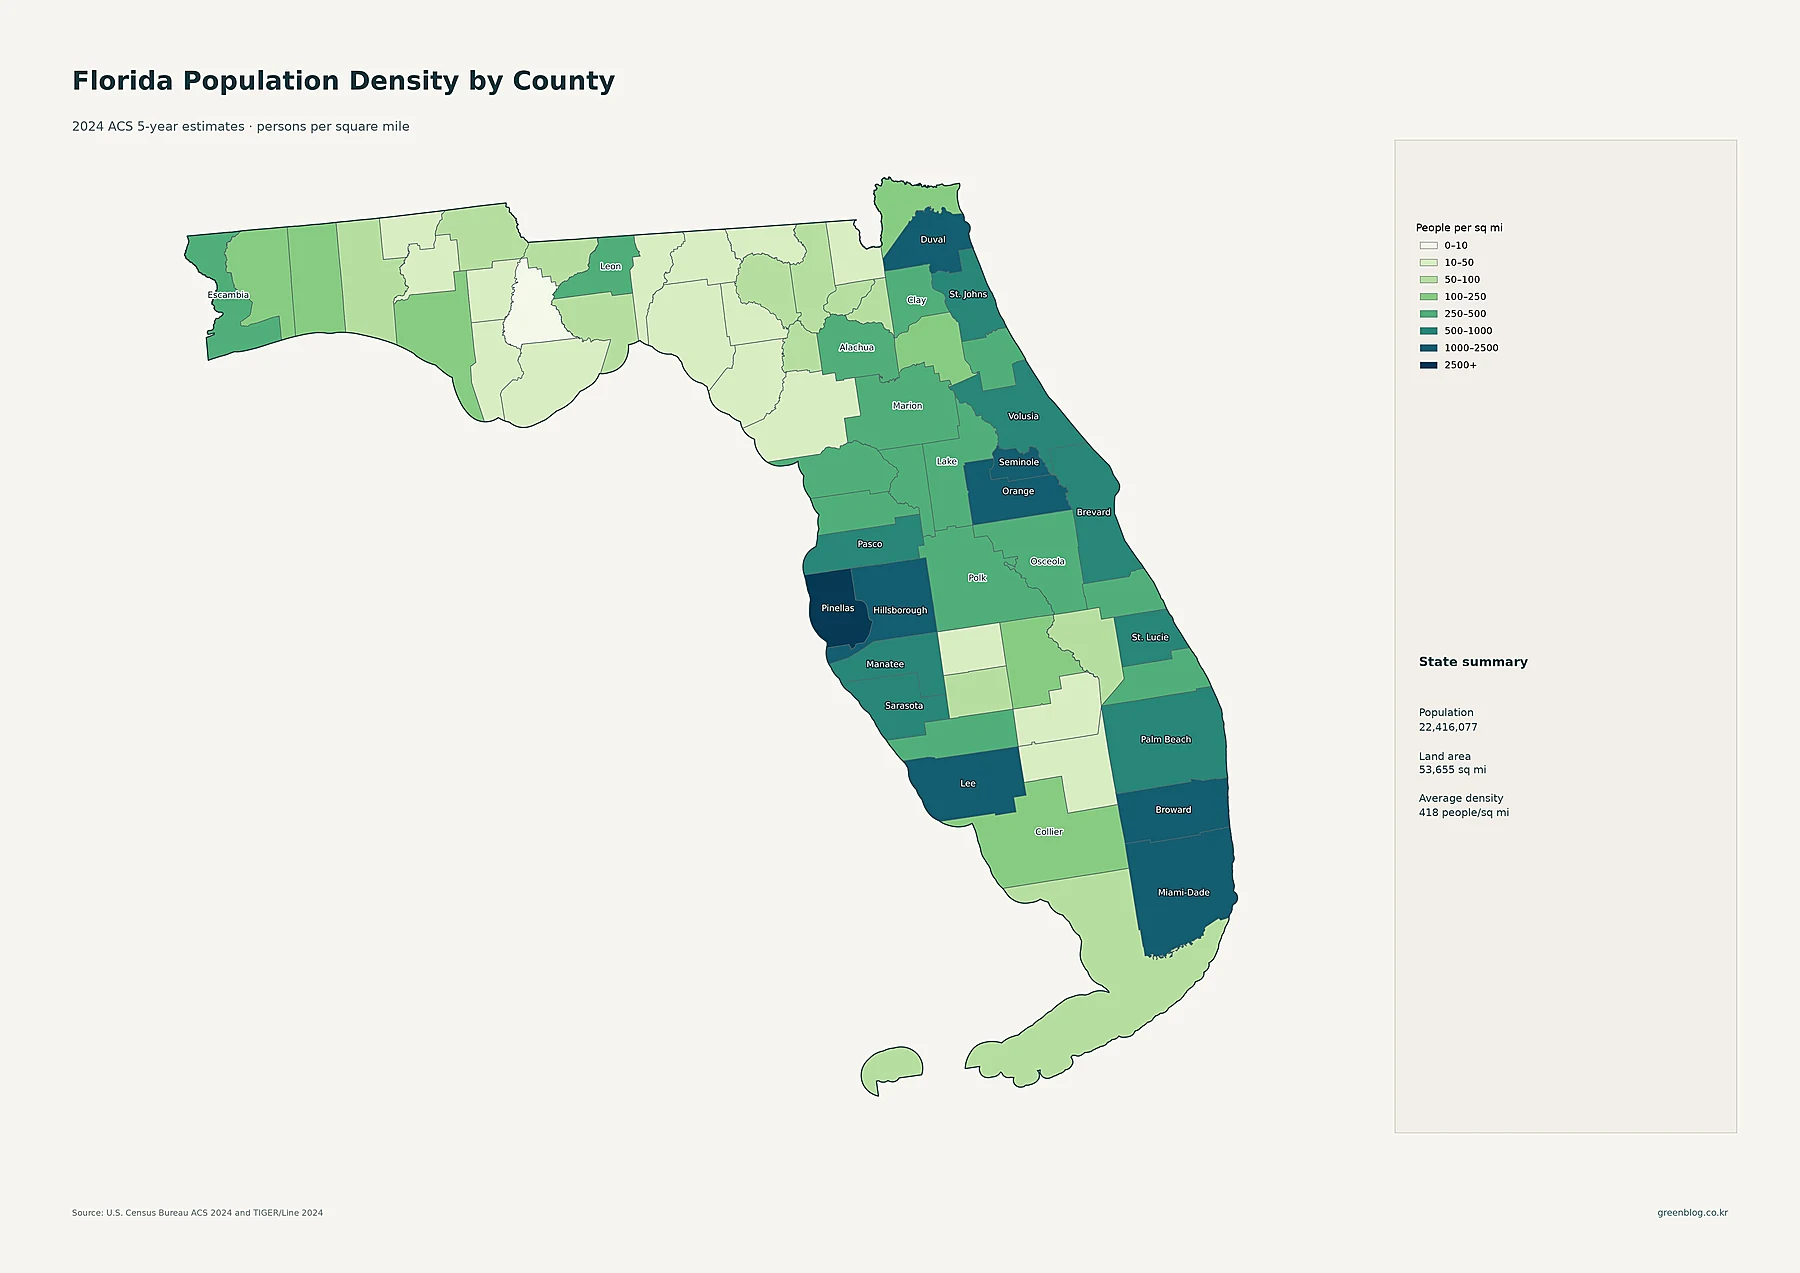
Broward follows at about 1,643.6 people per square mile, Orange at 1,630.0, Seminole at 1,556.3, Hillsborough at 1,489.2, Miami-Dade at 1,441.3, and Duval at 1,341.6. Lee is also above 1,000 at roughly 1,046.7. These high-density counties correspond closely to the main metropolitan concentrations visible on the tract map, but the county shading smooths out the fine-grained contrast within each region.
That smoothing matters in places such as southeast Florida. Miami-Dade, Broward, and Palm Beach all contain dark urban tracts along the developed eastern side as well as much lighter areas elsewhere in the county. A countywide average summarizes that whole land area with one number. For statewide comparison, that is useful; for neighborhood-scale settlement patterns, it is incomplete. Using the tract and county maps together prevents a broad average from being mistaken for uniform density.
Osceola and St. Johns grew more than 40% from 2010 to 2020
The population-change map uses a different time frame from the 2024 ACS maps. It compares 2010 and 2020 decennial census counts, with blue shades indicating growth and warm shades indicating decline. Osceola posts the largest percentage increase at about 44.7%, rising from 268,685 residents in 2010 to 388,656 in 2020. St. Johns follows at about 43.9%, increasing from 190,039 to 273,425. Sumter grew by roughly 38.9%, Walton by 36.8%, and Lake by 29.3%.
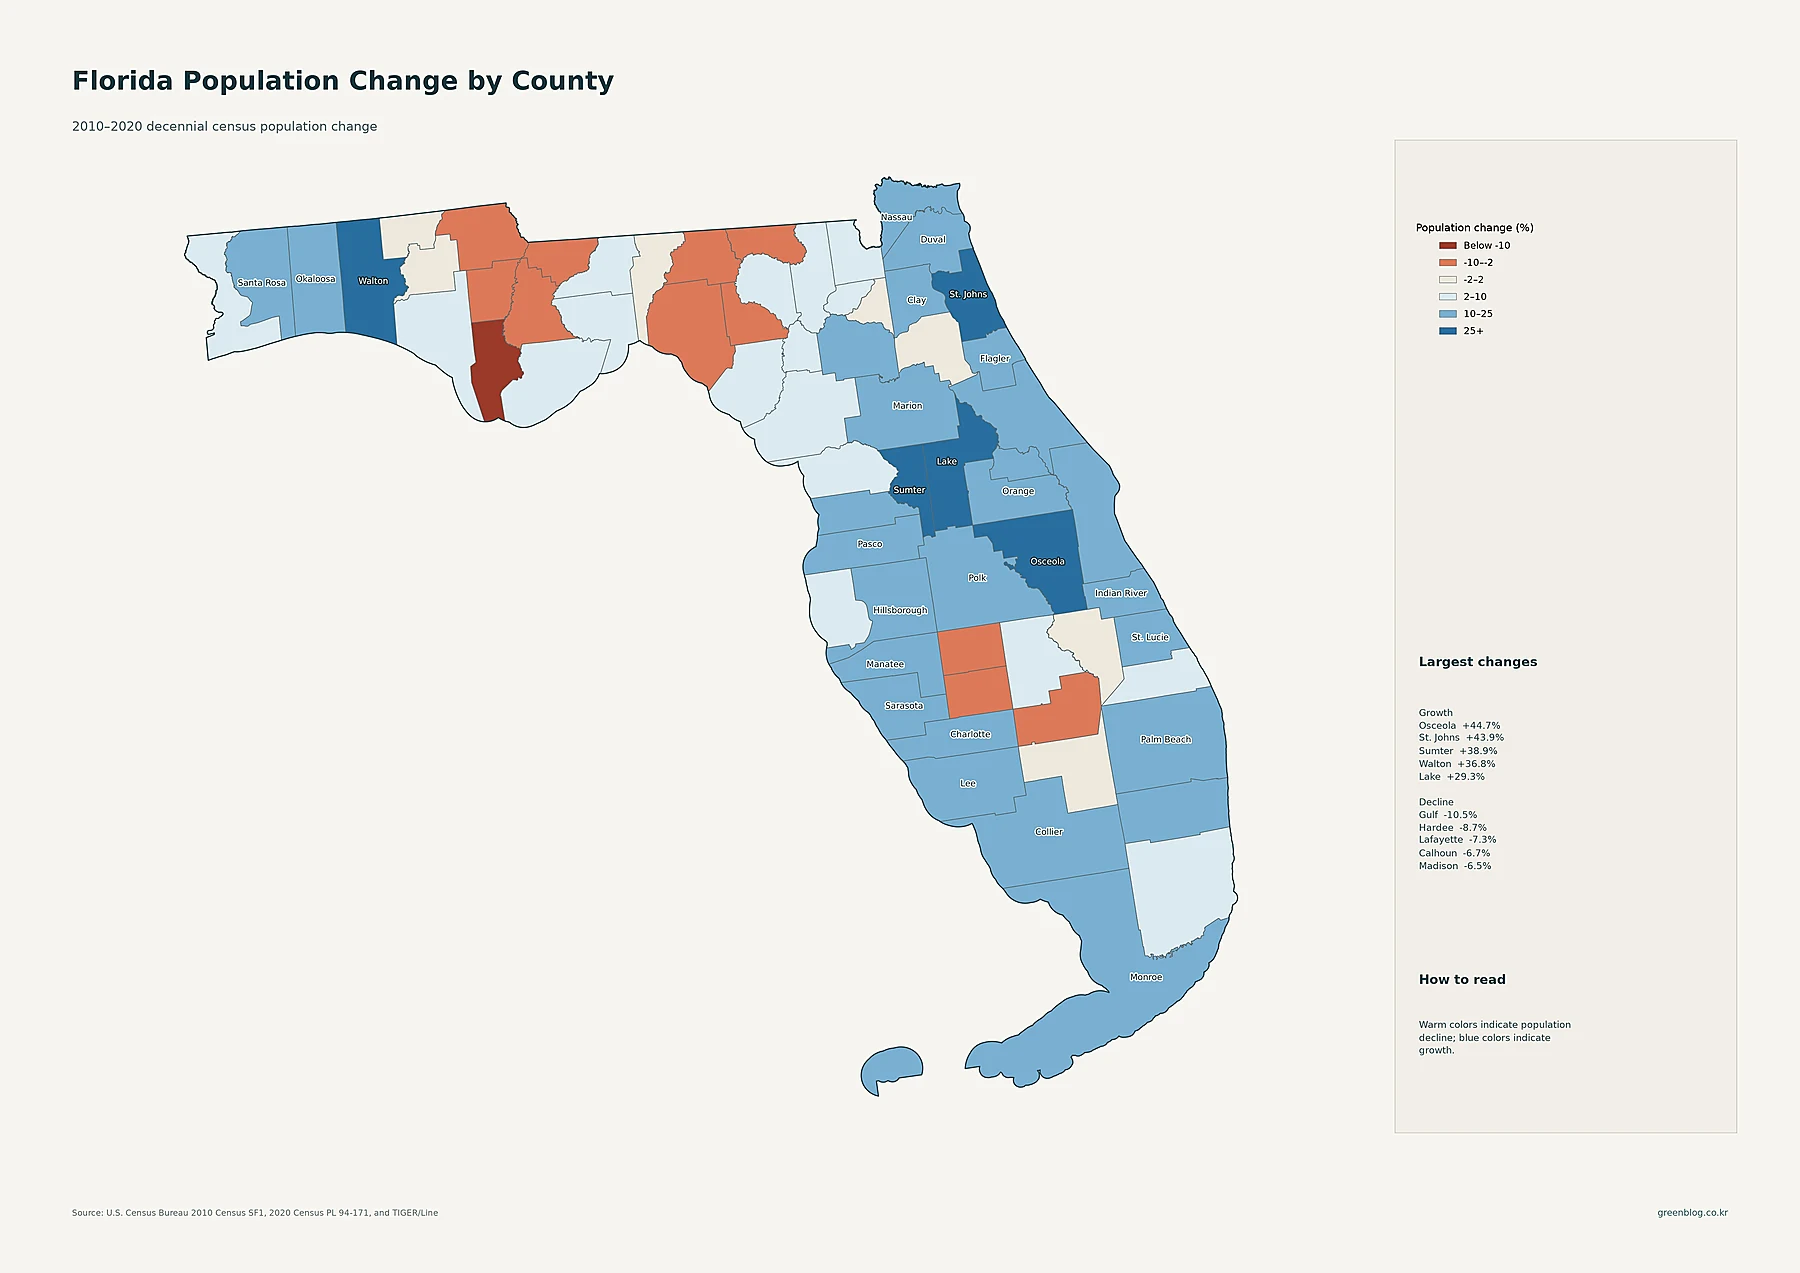
The fastest-growing counties are not simply the counties with the largest current populations. Miami-Dade is the 2024 population leader, but its 2010–2020 increase was about 8.2%. Osceola’s current population is much smaller at 427,415 in the 2024 ACS estimate, yet its decade growth rate was the highest in the state. Orange, which contains the Orlando area, grew about 24.8% over the decade, while neighboring Osceola grew even faster. St. Johns similarly stands out northeast of the Jacksonville region.
Some counties declined during the same period. Gulf fell by about 10.5%, Hardee by 8.7%, Lafayette by 7.3%, Calhoun by 6.7%, and Madison by 6.5%. The map documents the direction and magnitude of change; it does not establish why those changes occurred. Questions about housing, employment, migration, age structure, or local development require additional evidence, so the safest reading here is to keep the map focused on measured population change.
How to read the five Florida population maps together
A practical sequence is to start with the tract map and locate the actual high- and low-density areas. Next, use the major-place map to identify the cities and large Census places inside those clusters. The county population map answers which counties contain the most residents in total, while the county-density map answers which counties place the most residents into each square mile. The 2010–2020 change map should come last because it shifts from current concentration to growth over time.
Following that sequence produces several clear contrasts. Miami-Dade has the largest county population and high density, but Broward is denser. Pinellas has fewer residents than Hillsborough yet is by far the denser county. Orange and Seminole are dense parts of the Orlando region, while nearby Osceola is most notable for its exceptional decade growth rate. Jacksonville is Florida’s largest Census place in the supplied place dataset, while Duval is one of the state’s highest-density and million-plus-population counties. No single map captures all of those relationships, which is why the set works best as a connected demographic reference.
Download the Florida population map collection
The ZIP collection includes the detailed census-tract density map, major places and urban areas, county population, 2010–2020 county change, and countywide population density. Each map can also be viewed individually above.
Frequently asked questions
Which Florida county has the highest population density?
Pinellas County. The supplied 2024 ACS data give it an average of about 3,519.1 people per square mile. Broward is about 1,643.6, Orange 1,630.0, and Seminole 1,556.3. Local density still varies within every county, so the census-tract map is the better source for fine-scale patterns.
Is the most populous Florida county also the densest?
No. Miami-Dade has the largest 2024 estimated county population at 2,738,356, but Pinellas has the highest average density. Miami-Dade’s density is about 1,441.3 people per square mile, compared with about 3,519.1 in Pinellas. Total population and population density measure different things.
Which Florida county grew fastest between 2010 and 2020?
Osceola County grew fastest in the supplied decennial-census comparison, at about 44.7%. St. Johns followed at about 43.9%, Sumter at 38.9%, Walton at 36.8%, and Lake at 29.3%. These percentages compare the 2010 and 2020 censuses and should not be confused with the 2024 ACS estimates used for the current-population and density maps.
Related Maps
Sources
The current population, Census-place population, tract density, and county density in this map set use the supplied U.S. Census Bureau 2024 ACS 5-year estimates with 2024 TIGER/Line geography. The county-change map compares population from the 2010 and 2020 decennial censuses.
- U.S. Census Bureau — 2024 ACS 5-Year Data — official access information for the 2020–2024 ACS 5-year estimates
- U.S. Census Bureau — 2024 TIGER/Line Shapefiles — official geographic boundary files used with Census data
- U.S. Census Bureau — 2010 to 2020 County Population Change — county change reference based on the 2010 and 2020 censuses
Green Map creates custom-edited map images using open geographic data sources such as geoBoundaries, Natural Earth, OpenStreetMap, and government open data.
These maps are edited visual materials, not raw data files, and are provided for education, documents, presentations, and graphic reference.