Wetlands dominate the supplied 2025 view of Glynn County, accounting for 45.19% of the mapped area. Forest follows at 23.86%, developed land at 13.96%, and open water at 10.70%. The Glynn County Georgia Land Cover Map is especially useful for comparing the wooded mainland with the wet coastal landscape and the separated built areas associated broadly with Brunswick and the county’s island communities.
Four map views are included on this page: 2025 land cover, forest and farmland, impervious surface and developed land, and a 1985–2025 class-difference map. The WebP images are shown with the explanation, while the four original 2480 × 1754-pixel JPG files are packaged in one ZIP for printing, county profiles, lessons, presentations, and side-by-side comparison.
Table of Contents
A county where wetlands, open water, and forest outweigh the developed footprint
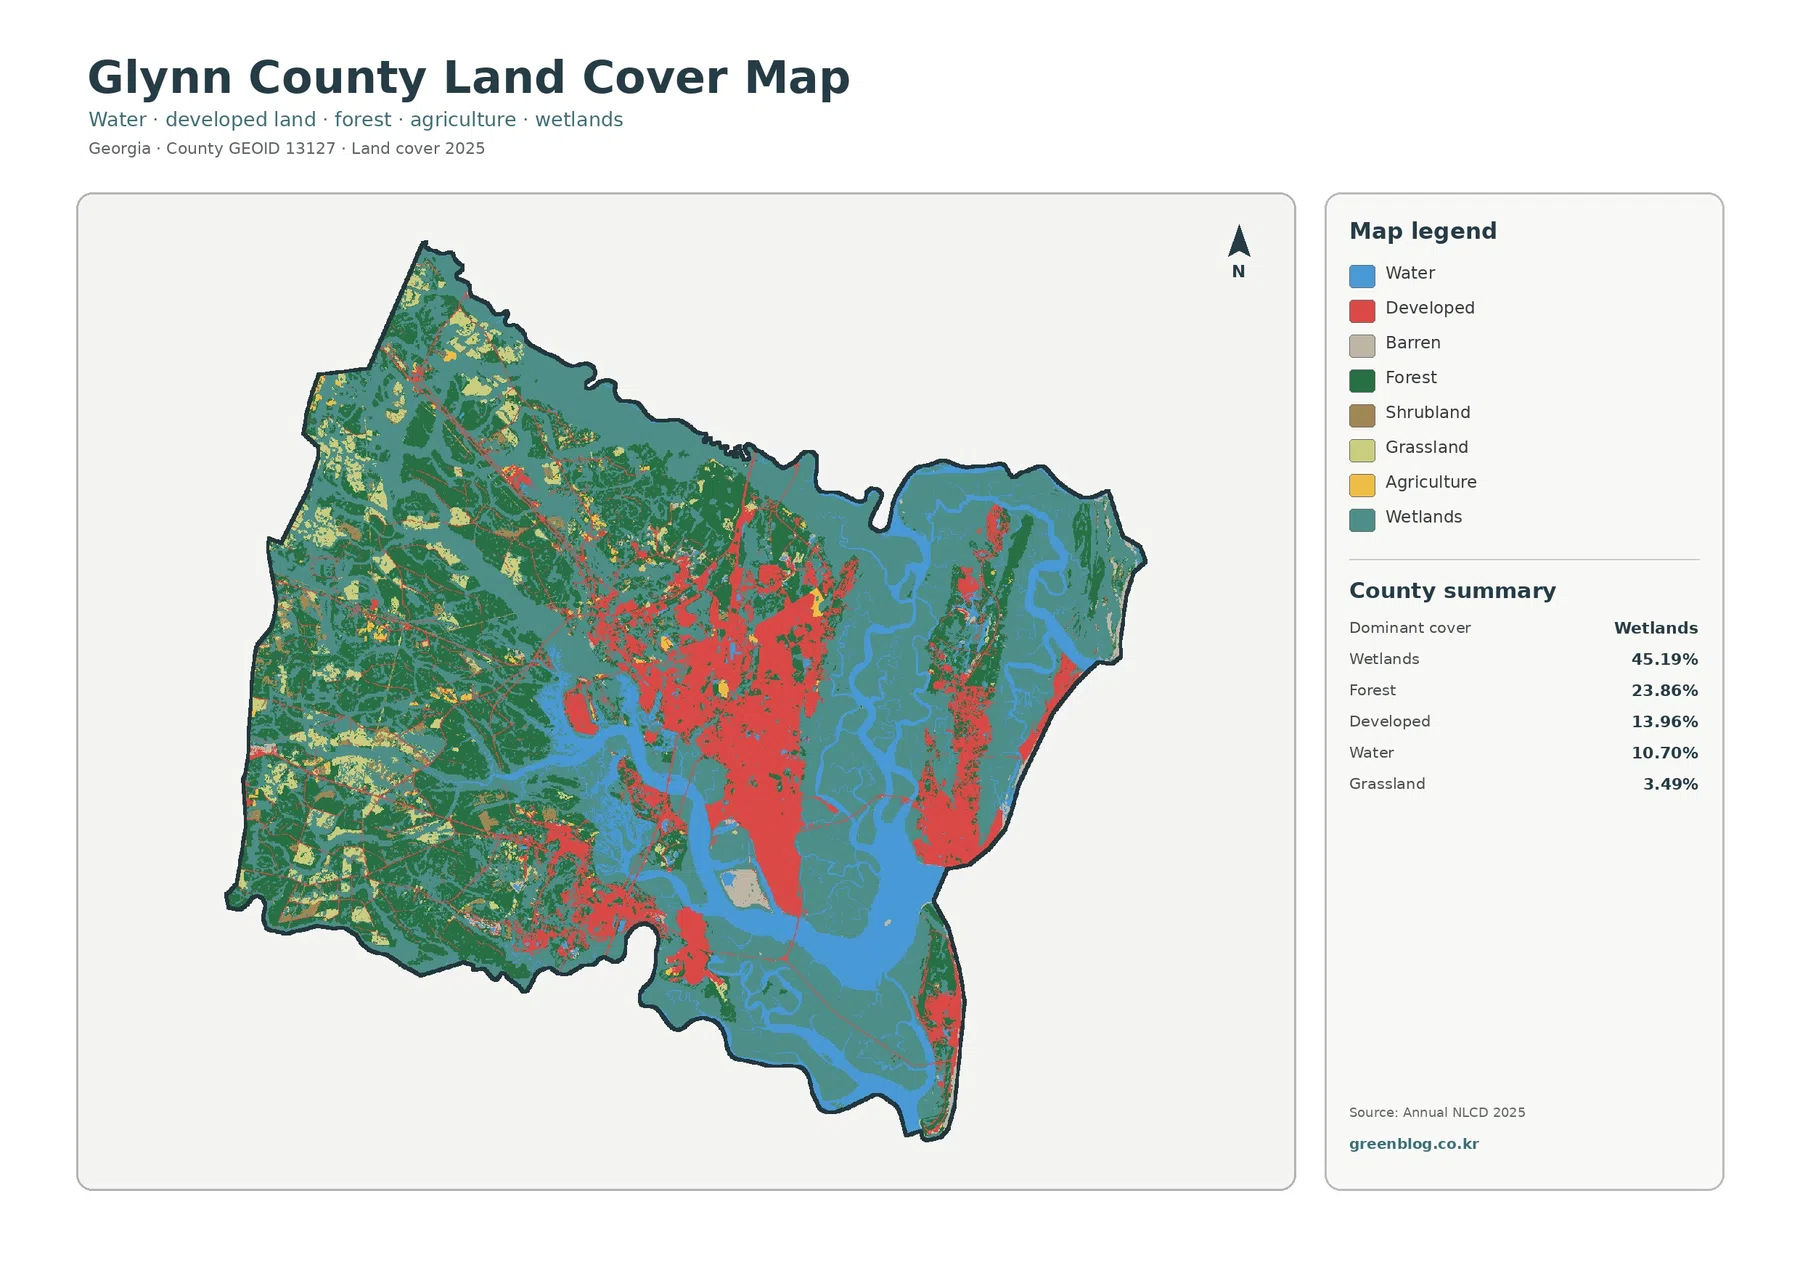
The first map makes the coastal character obvious without needing a long list of places. Teal wetland cells cover broad eastern and southeastern areas and continue around channels and island-shaped uplands. Blue water occupies another 10.70%, so the wetland and water classes together form a large part of the countywide scene. Dark green forest is most continuous toward the west and northwest.
Developed land is smaller in total area than wetlands or forest, yet it is visually concentrated. A large red cluster sits along the central coastal part of the mainland, and separate built patches appear on the eastern islands. The west contains many more forest and wetland cells with only thin or scattered developed marks. That contrast is more informative than the countywide 13.96% developed share by itself.
Land cover should not be read as zoning or ownership. A developed cell can contain lawns, trees, bare soil, and pavement, while a wetland cell is not automatically a legally regulated wetland boundary. The map does not show parcels, building rights, municipal limits, or property lines. Those questions require current local records and specialized mapping.
Hard-surface intensity separates the Brunswick-side core from large low-impervious areas
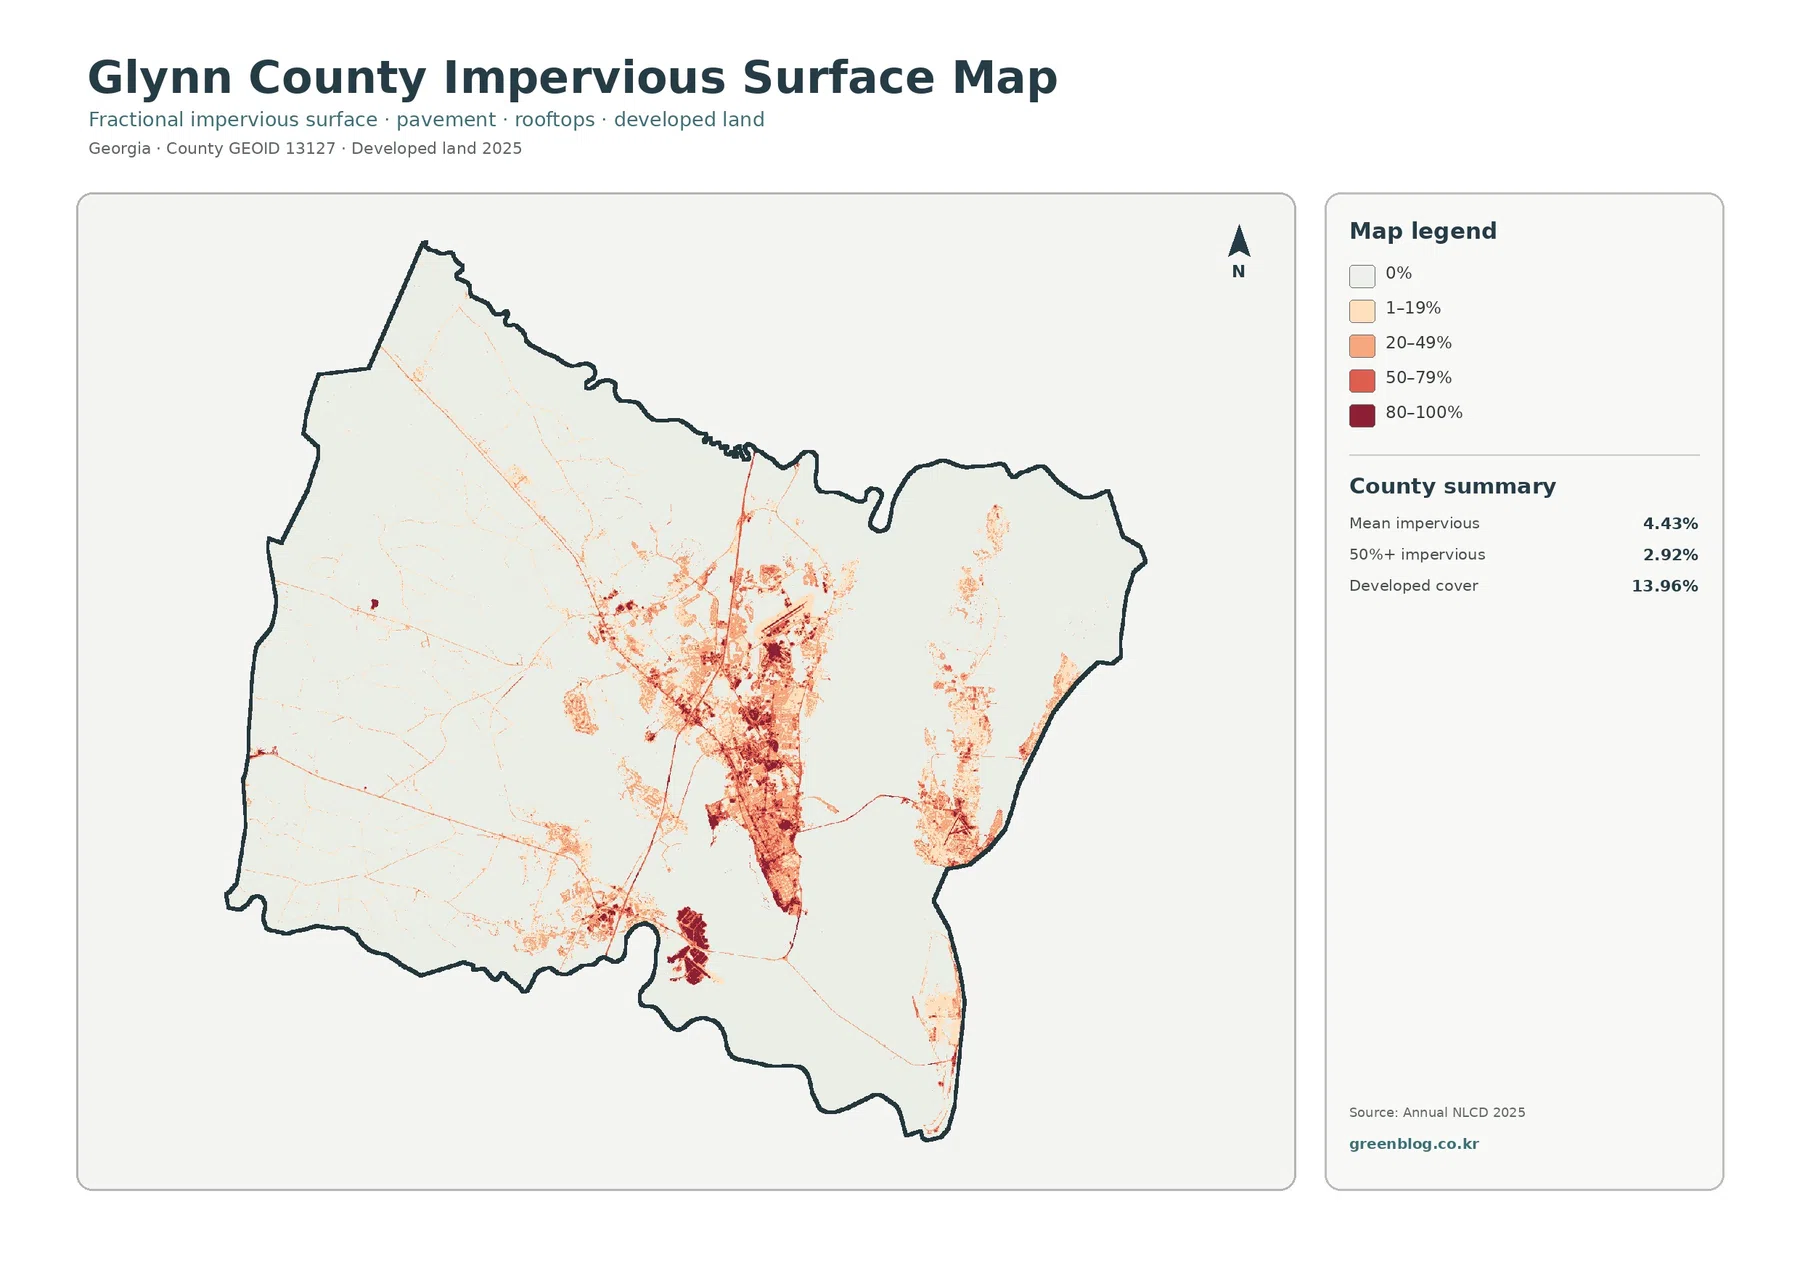
Mean impervious cover is 4.43% across the county, and 2.92% of the mapped area is at least 50% impervious. Both numbers are well below the 13.96% developed-land share because the two measures answer different questions. Developed classes can contain substantial permeable ground, while the impervious layer isolates harder surfaces such as rooftops, streets, and parking areas.
The darkest tones form a strong concentration on the central mainland near the coast. Fine lines and smaller patches extend away from that core, and another set of developed surfaces appears on the eastern island area. By comparison, much of the western mainland is almost blank on the impervious map even where the land-cover view contains forest, wetlands, grass, or other classified surfaces.
The countywide mean can hide this sharp internal contrast. A large low-impervious landscape can pull the average down even when parts of Brunswick or the islands contain much higher percentages. For development discussions, the location and continuity of the darker cells matter at least as much as the 4.43% mean.
Brunswick and the island communities add useful context, but their boundaries are not drawn here
Glynn County’s 2023 comprehensive plan discusses Brunswick, St. Simons Island, Sea Island, Jekyll Island, and Little St. Simons Island as distinct parts of the county. That official planning context helps explain why the county map contains a mainland urban concentration plus separate island landforms. It does not, however, turn the NLCD image into a municipal or community-boundary map.
Georgia DNR’s Coastal Resources Division includes Glynn County in its coastal service area and is responsible for managing state coastal marshes, beaches, and coastal waters. That makes coastal marsh management an important local context, but the teal NLCD wetland class is not the same thing as a Coastal Marshlands Protection Act jurisdiction line. Regulatory determinations require separate official work.
The 1985–2025 comparison highlights endpoint differences rather than a continuous history
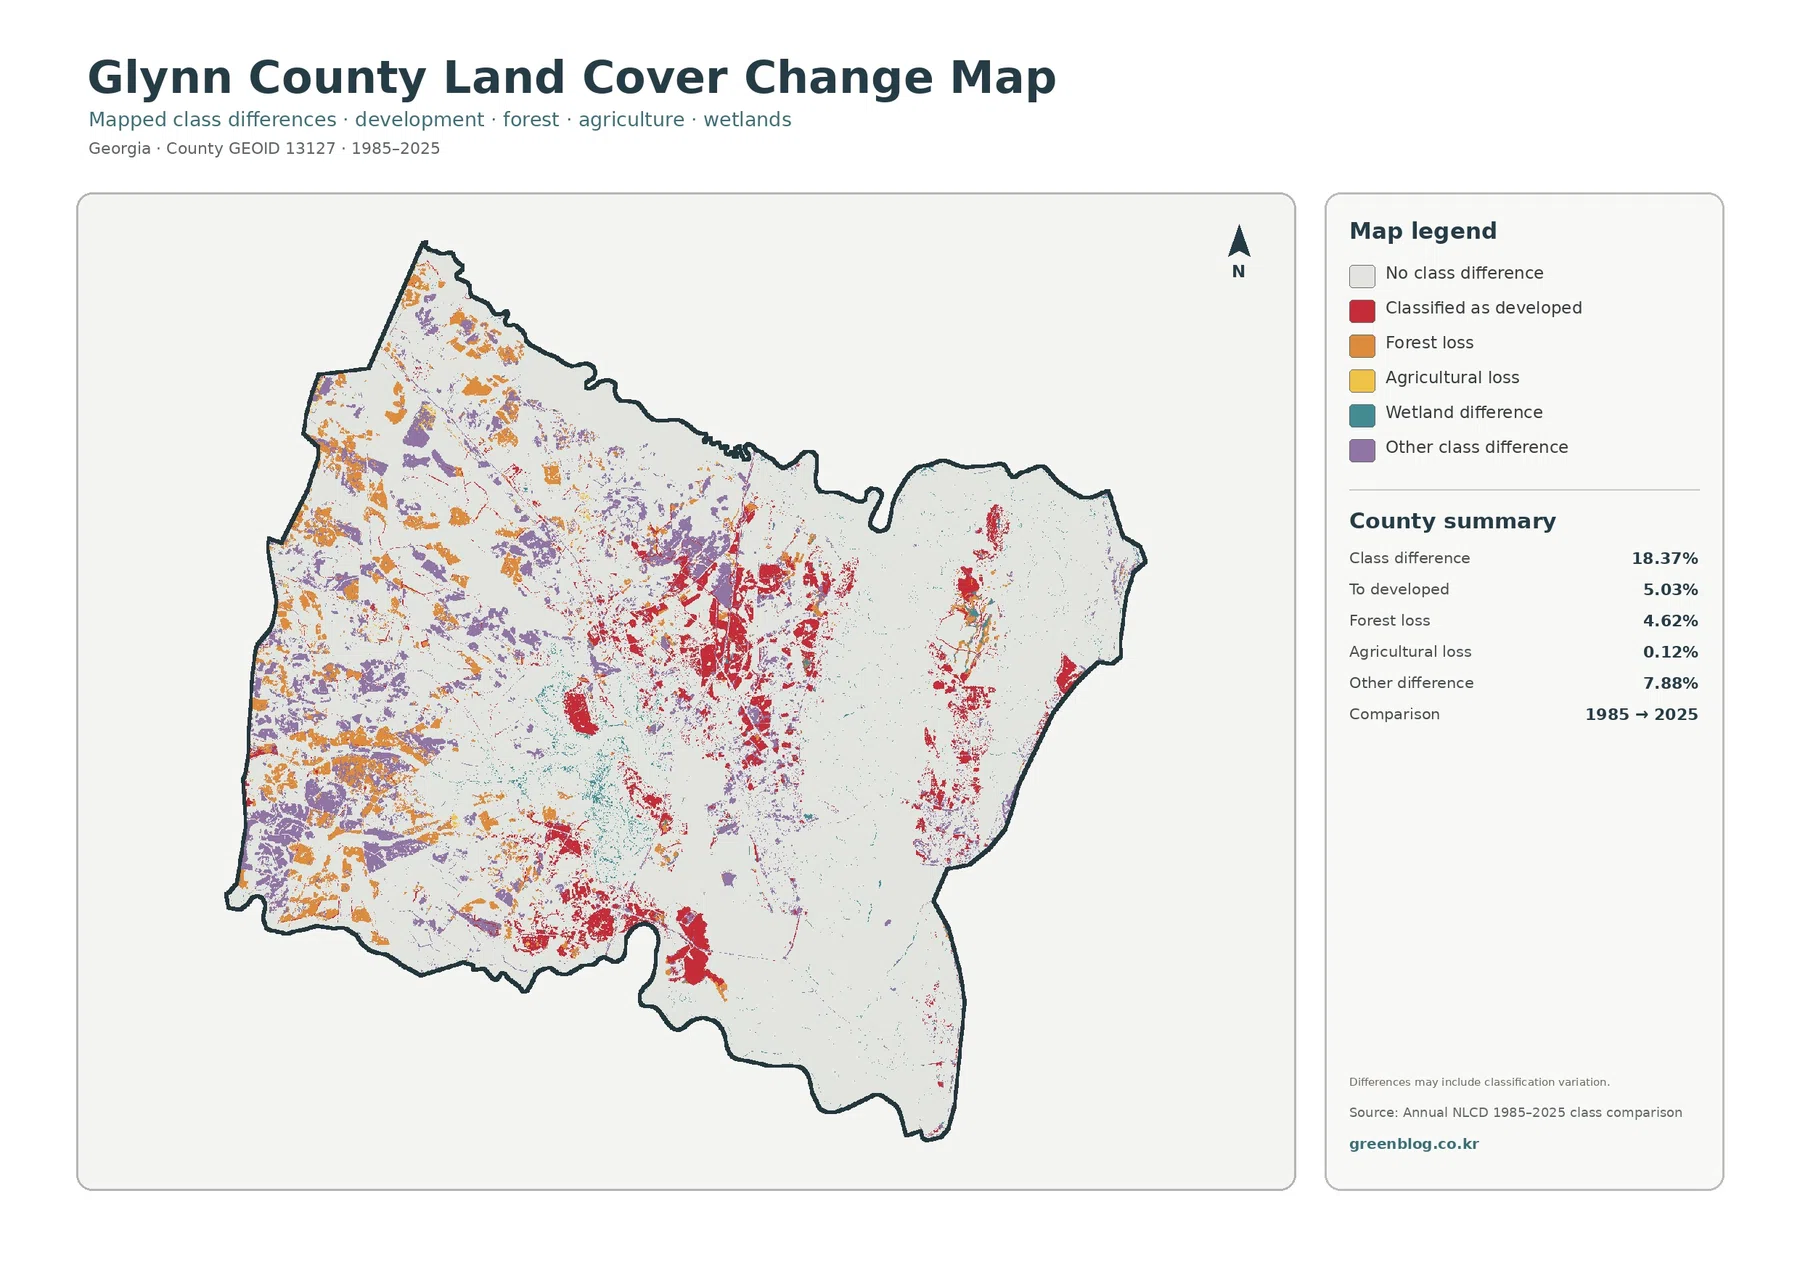
The change map reports 18.37% total class difference between the two endpoints. The summary lists 5.03% classified as developed, 4.62% forest loss, 0.12% agricultural loss, and 7.88% other difference. Wetland difference appears in the legend but does not receive a separate percentage in the preview, so a residual calculation should not be presented as an official wetland-change statistic.
Red developed-conversion cells are concentrated around the large central built area and appear again on the eastern island side. Orange forest-loss marks are more widely scattered across the western mainland, while purple other differences occupy many separate patches. The pattern is not a single growth ring around one city; different kinds of endpoint change appear across several parts of the county.
“Forest loss” only means that a cell classified as forest in 1985 received another class in 2025. The map does not identify logging, construction, storms, vegetation succession, or classification variation as the cause. The same caution applies to cells classified as developed: the image does not provide the construction year, project name, or development sequence.
Forest and farmland view reveals how little mapped agriculture occupies the coastal landscape
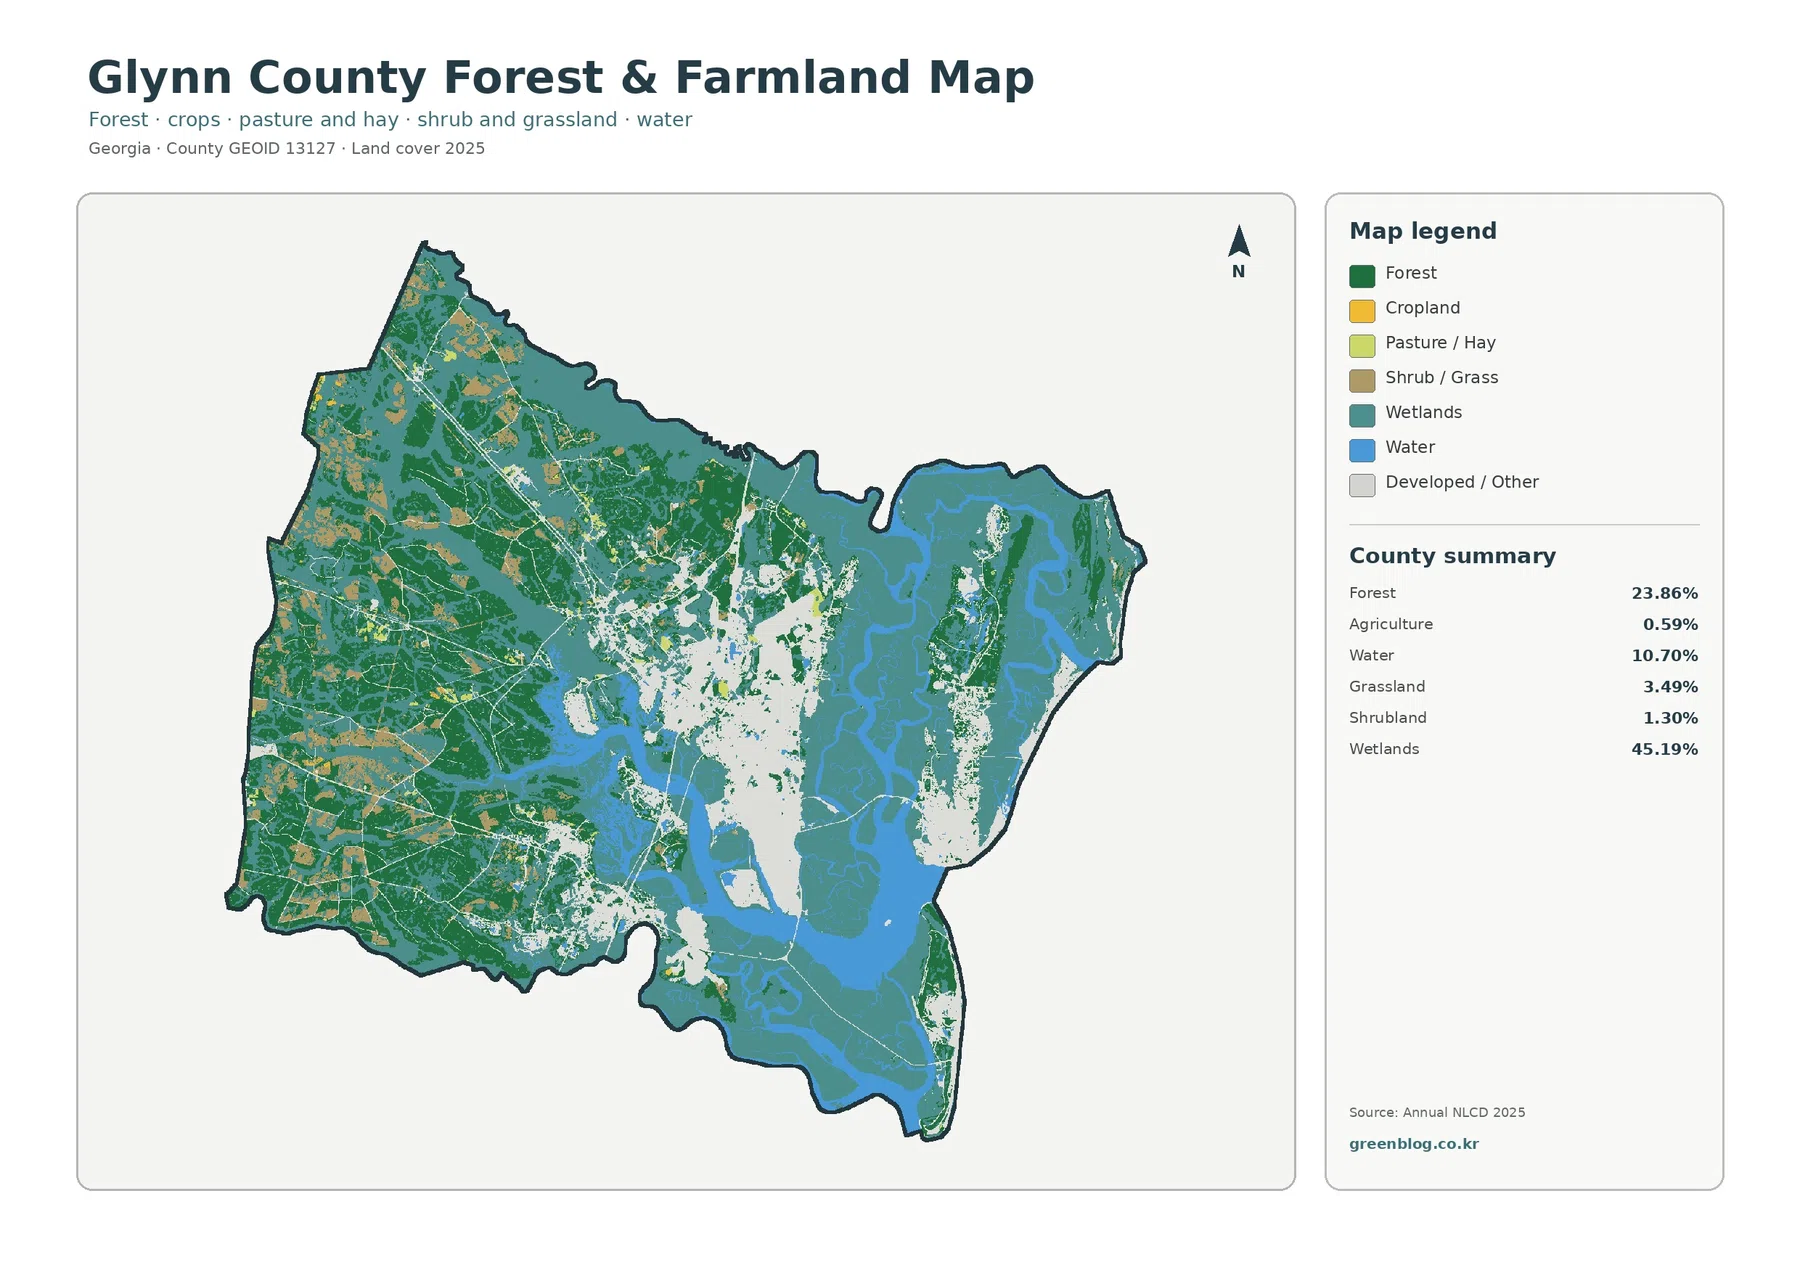
Removing the strong red developed color changes the way Glynn County reads. Dark forest becomes the main upland cover across much of the west and northwest, while teal wetlands and blue water dominate the eastern half and the spaces around island landforms. The pale central and island areas correspond broadly to the larger developed clusters seen on the general map.
The summary lists forest at 23.86%, agriculture at 0.59%, water at 10.70%, grassland at 3.49%, shrubland at 1.30%, and wetlands at 45.19%. Cropland and pasture or hay are separate legend categories, but the preview does not provide separate percentages for those two agriculture types. Their visible colors should not be measured by eye and converted into new statistics.
How to combine the four maps without making the coastal pattern harder to understand
For a general county profile, start with the 2025 land-cover view because it presents the 45.19% wetland share, 23.86% forest share, 13.96% developed share, and 10.70% water share in one image. A second map can then answer a narrower question. The vegetation view is strongest for forest-wetland-open-land comparison, while the impervious map is clearer for hard-surface intensity.
The same principle applies to development. Developed land at 13.96% is broader than mean impervious cover at 4.43%. A lawn-heavy residential area can still fall in a developed class while having far less hard surface than a parking lot or dense commercial block. Showing the general and impervious maps together makes that distinction concrete.
Thirty-meter cells, observation dates, and print size set practical limits
Annual NLCD uses 30-meter raster cells. A raster is simply a grid of square cells, and each land-cover cell receives one predominant class. Along Glynn County’s intricate wetland and water edges, one cell may contain vegetation, open water, a narrow road, and upland ground. The displayed class simplifies that mixed surface.
The current map represents the supplied 2025 observation year. Construction, storm impacts, vegetation recovery, forestry work, shoreline conditions, or drainage changes after that observation may not appear. The 1985–2025 product is also an endpoint comparison rather than a year-by-year record of four decades.
Each downloadable JPG is 2480 × 1754 pixels. That size works well for screens, documents, and many ordinary presentation layouts, but the asset manifest does not mark the files as meeting an A3 high-resolution reference. If a large poster is planned, make a proof print first and check whether the legend and small features remain readable at the intended size.
What the four-map JPG package contains
The ZIP includes one original JPG for each view discussed here: 2025 land cover, forest and farmland, impervious surface and developed land, and 1985–2025 land-cover change. For a short presentation, use the countywide view first and add only the image that directly supports the next point. That usually communicates more clearly than reducing all four maps to small panels.
Frequently Asked Questions
Why are wetlands 45.19% while open water is only 10.70% in Glynn County?
They represent different surface classes. Open water covers exposed water surfaces, while wetland classes can include vegetation and saturated ground influenced by water. Glynn County has extensive teal wetland areas around coastal channels and islands as well as blue open water, so both values are high without describing the same land.
Can the map show the exact boundaries of Brunswick, St. Simons Island, or Jekyll Island communities?
No. The county comprehensive plan identifies Brunswick and the island communities, but the supplied land-cover images do not draw municipal or community boundaries. Large developed clusters can be discussed in broad geographic context, while exact limits should be checked with Census boundary data or official local maps.
Does the 18.37% class difference mean 18.37% of Glynn County was physically damaged?
No. It is the share of cells that received different classifications at the 1985 and 2025 endpoints, and the map warns that classification variation may be included. Values such as 5.03% classified as developed and 4.62% forest loss are useful screening indicators, but timing and cause require intermediate imagery, field evidence, permits, and other local records.
Sources and Reference Data
- MRLC Annual NLCD Data – official access point for annual land-cover and comparison products
- USGS Annual NLCD Land Cover Classification – definitions and guidance for forest, wetlands, developed land, agriculture, and related classes
- U.S. Census Bureau TIGER/Line Shapefiles – official county-boundary and geographic reference data for Glynn County
- Georgia DCA – Glynn County Comprehensive Plan – official access to the county’s 2023 comprehensive plan and earlier planning documents
- Glynn County – Comprehensive Plan 2023 – county planning page describing long-range growth and the community context of Brunswick and island areas
- Georgia DNR Coastal Resources Division – official description of coastal marsh, beach, water, and marine-resource responsibilities in Glynn County and other coastal counties
Map File Information
The ZIP contains four original JPG maps for comparing Glynn County wetlands, forest, coastal water, Brunswick- and island-side development, hard surfaces, and 1985–2025 class differences.
- Included Files: Use only the versions confirmed in the article and supplied images
- File Type: Use the confirmed download contents
- Intended Use: Printing, education, presentations, and map-based projects
Related Maps
- Appling County Georgia Land Cover Map
- Atkinson County Georgia Land Cover Map
- Bacon County Georgia Land Cover Map
Green Map creates custom-edited map images using open geographic data sources such as geoBoundaries, Natural Earth, OpenStreetMap, and government open data.
These maps are edited visual materials, not raw data files, and are provided for education, documents, presentations, and graphic reference.