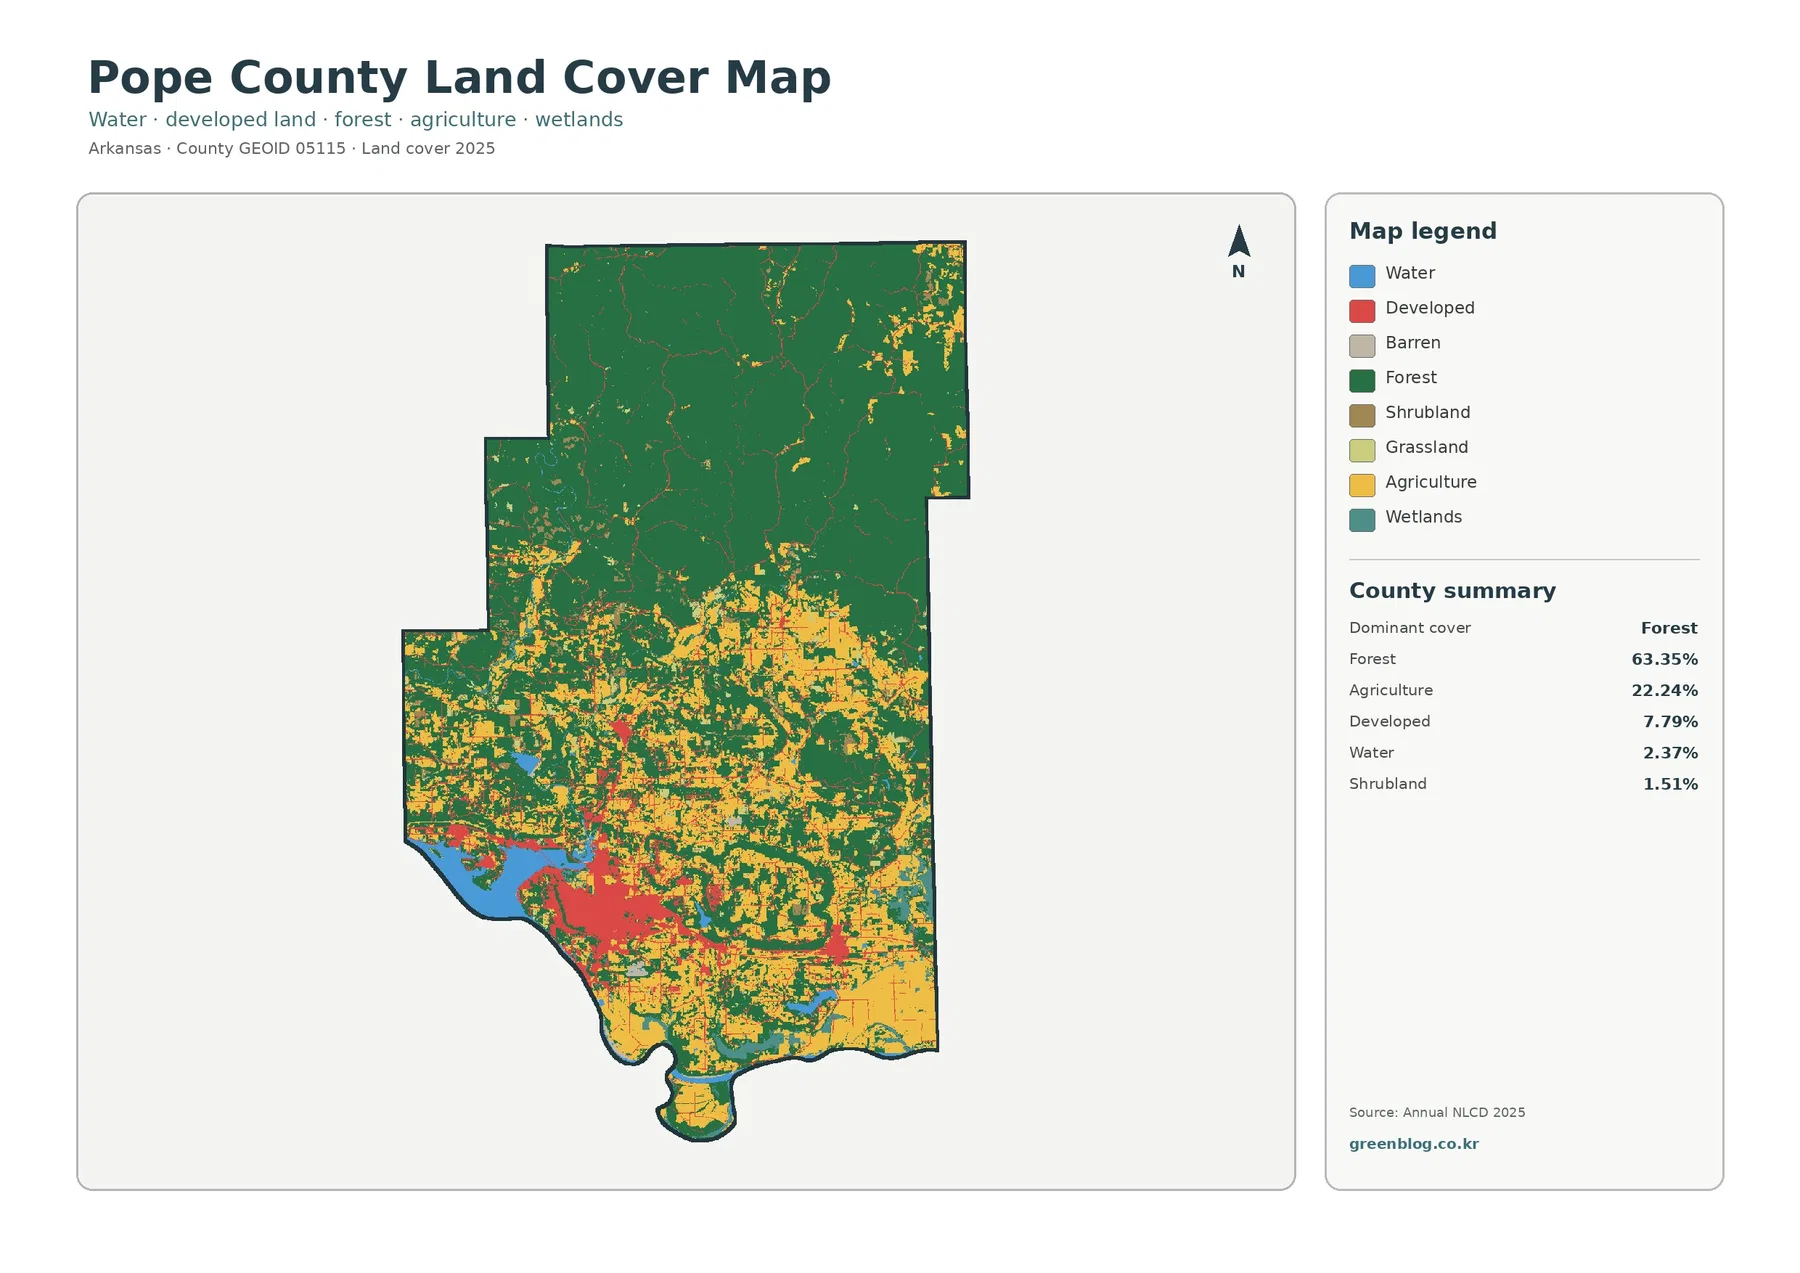
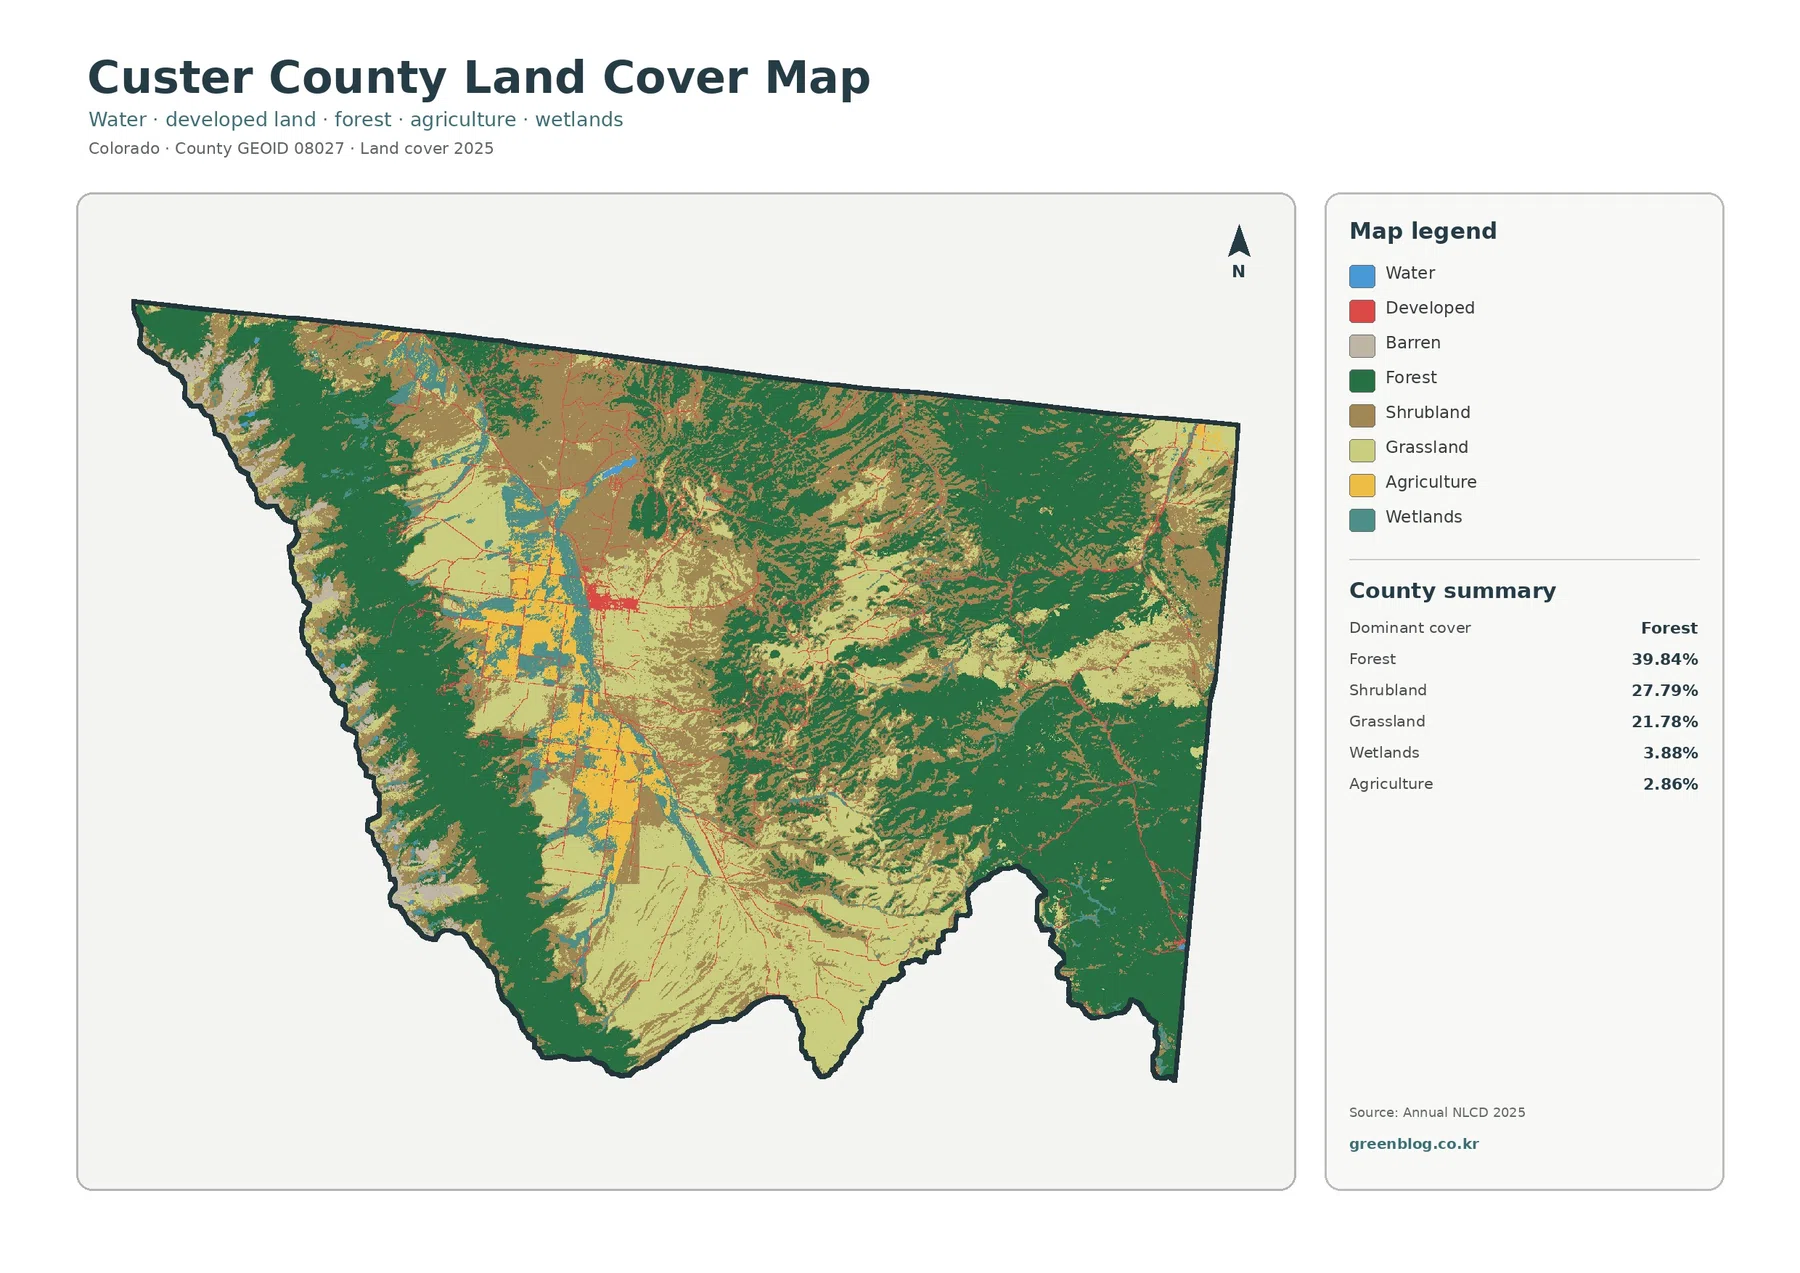
Hardee County’s 2025 land-cover pattern is led by agriculture. Agricultural cover accounts for 55.04% of the county, while wetlands make up another 31.37%. On the countywide map, farm-related classes occupy broad areas but are repeatedly interrupted by wetland bands and patches. Developed land is much smaller and is most noticeable in a compact central cluster. The four maps on this page separate those patterns into overall land cover, forest and farmland, impervious surface, and 1985–2025 class differences.
The WebP images are designed for quick viewing on the page. The four original JPG maps are also available together in the download box below. Land cover describes what is physically covering the ground in a generalized classification; it is not the same as zoning, property ownership, parcel boundaries, or permission to develop. These maps are best used to compare broad county patterns before moving to more detailed local data.
Table of Contents
Agriculture and wetlands define most of the 2025 countywide pattern
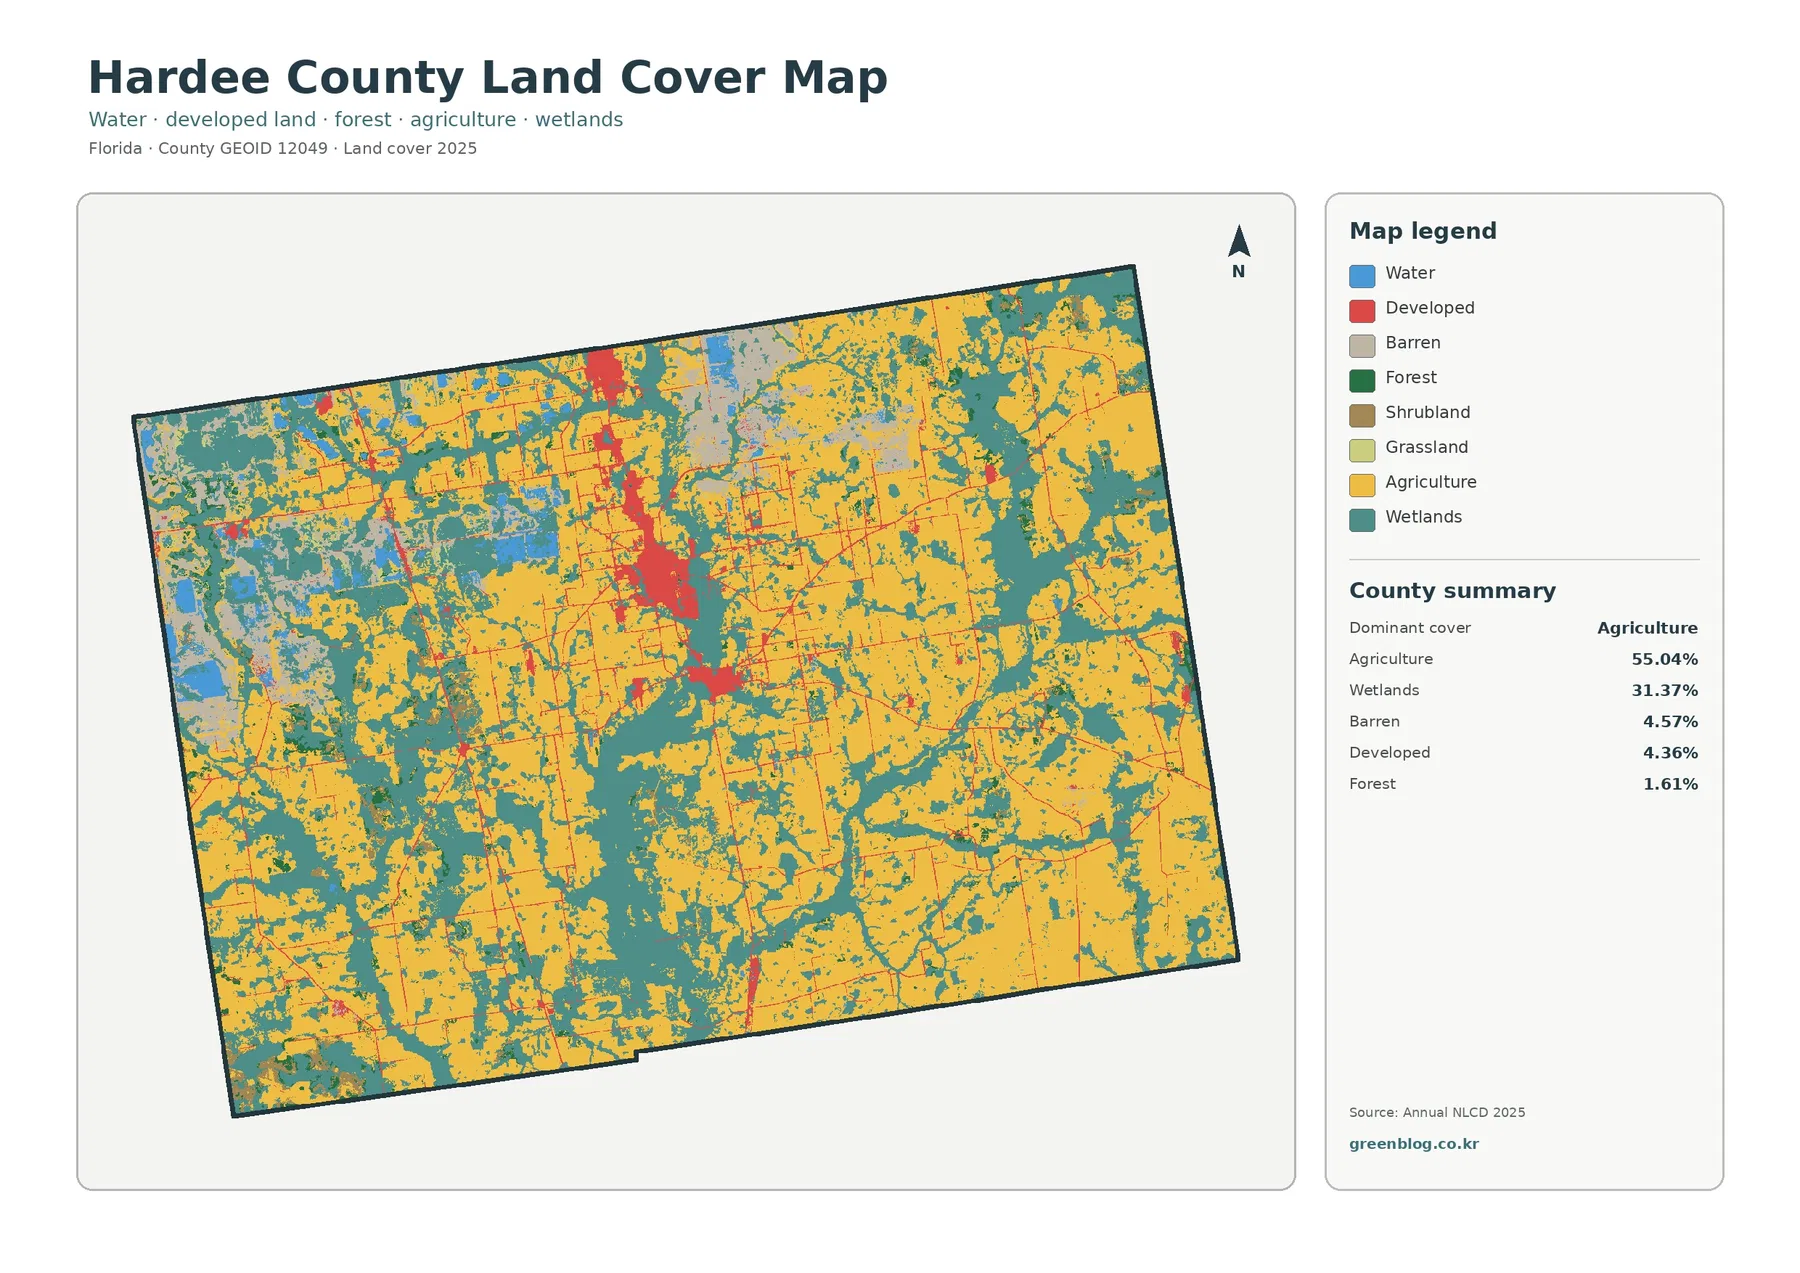
Agriculture is the dominant class at 55.04%. Large yellow areas appear across much of the county, including broad sections of the east, south, center, and west. The pattern is not a single unbroken block, however. Wetlands, developed areas, barren land, and smaller classes break the agricultural cover into areas of different size and continuity. That makes the county look farm-dominant overall without making every part of the county look the same.
Wetlands account for 31.37%, a very large second share. Teal wetland areas are especially broad in parts of the west and southwest, and they also form long branching shapes through central and eastern sections. In several places, wetlands divide or border large agricultural areas. The county summary therefore works best when agriculture and wetlands are considered together rather than treating the 55.04% agricultural share as the only defining feature.
The remaining classes are much smaller: barren land 4.57%, developed land 4.36%, forest 1.61%, water 1.54%, shrubland 0.99%, and grassland 0.52%. Barren areas appear in scattered light-gray patches, while developed land forms a stronger red cluster near the middle of the map and smaller spots elsewhere. Forest is limited in the countywide percentage and appears as relatively small green patches instead of one continuous wooded region.
The countywide map is most useful when percentages are paired with location. A summary table can tell a reader that agriculture exceeds half the county, but it cannot show where wetland corridors divide that agricultural background. The map also makes it easier to see that developed land can be locally prominent in a few places despite accounting for only 4.36% of the total area.
A simplified farm-and-natural-cover view clarifies the large wetland share
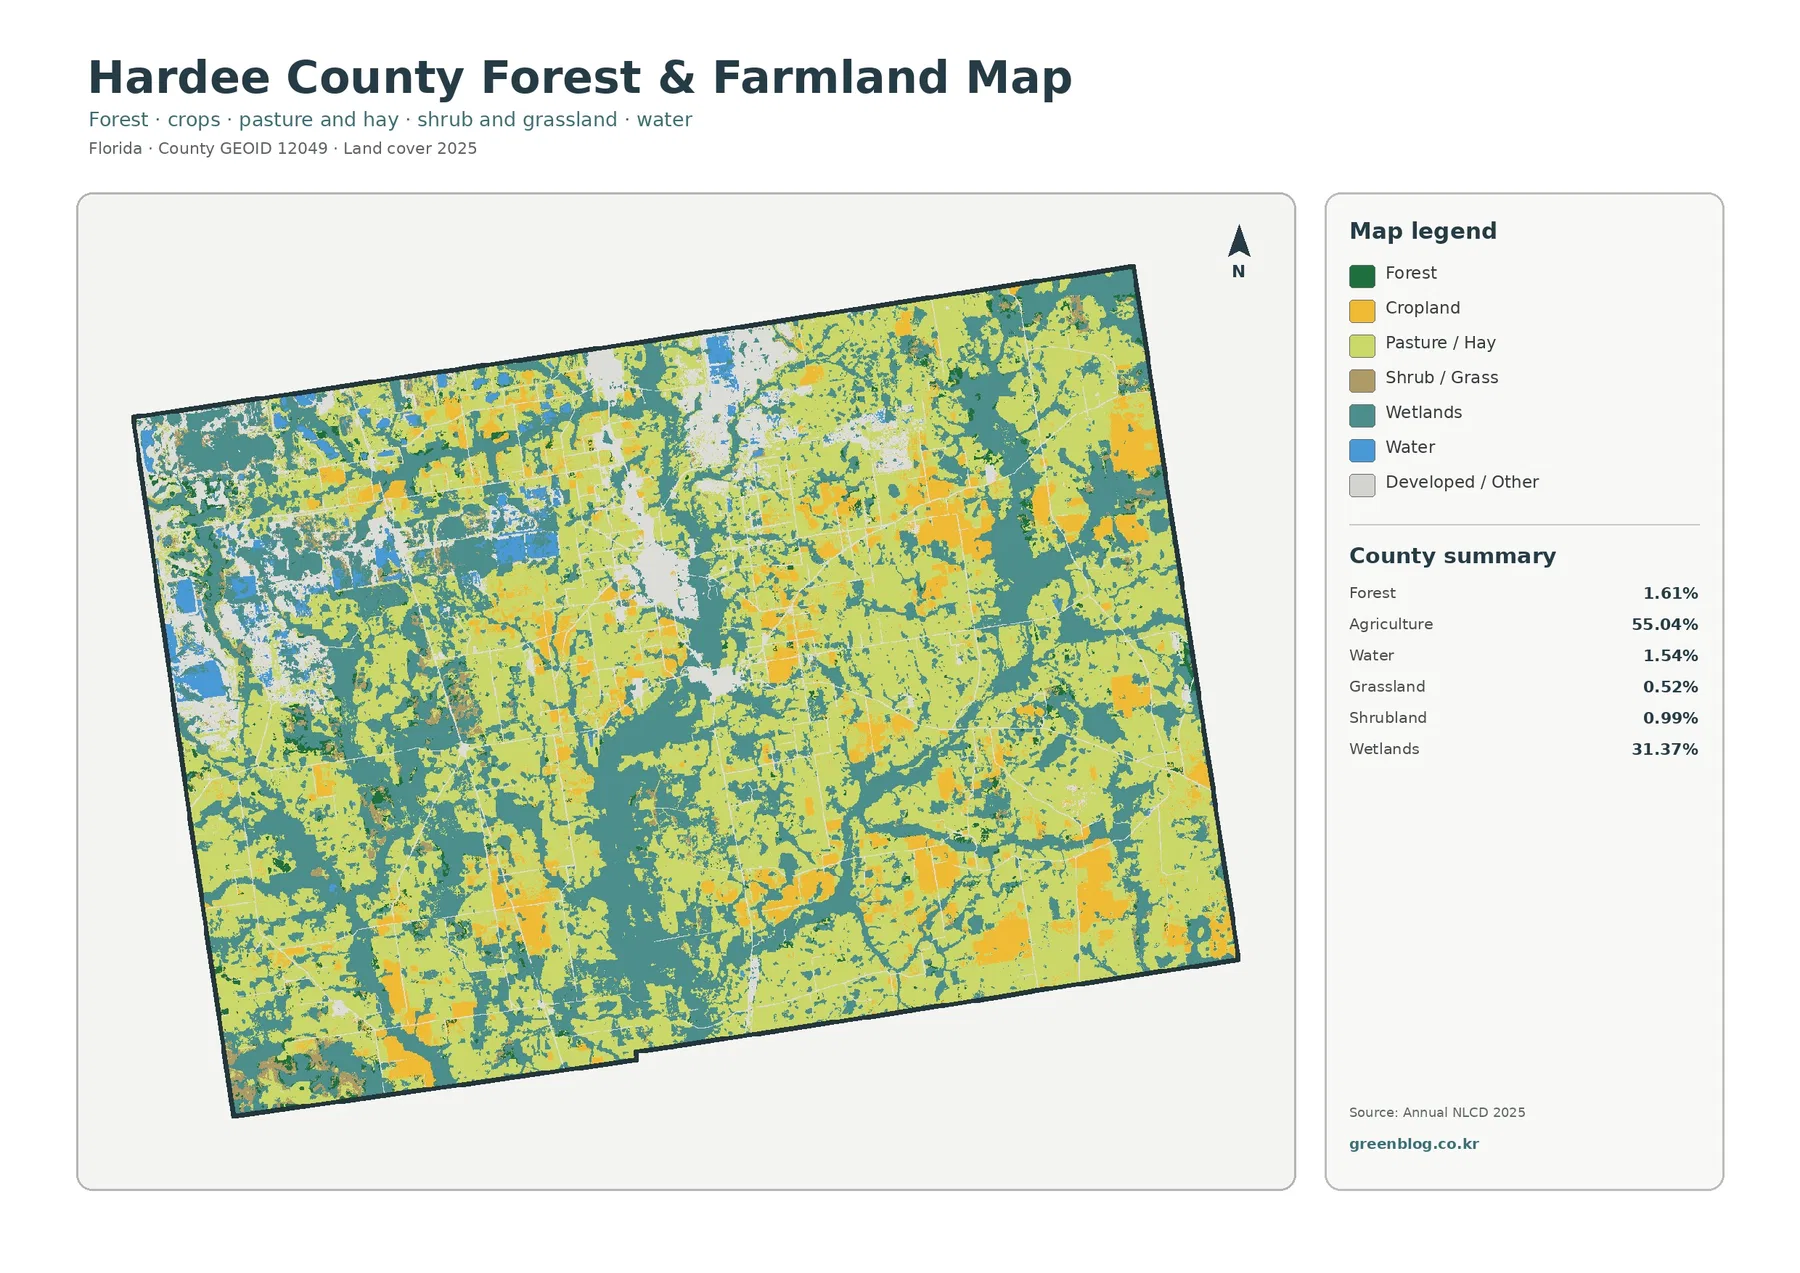
The forest-and-farmland map reduces some of the visual complexity of the general land-cover map. Agriculture remains the dominant category at 55.04%, while the 31.37% wetland share divides the farm landscape into broad blocks and narrower passages. For Hardee County, this view is especially useful because the two largest classes together account for more than 86% of the county.
Agricultural cover is extensive in the eastern and southern parts of the county, but substantial farm blocks also occur farther west. The central area is more mixed, with agriculture interrupted by other classes. North of the main central developed cluster, the arrangement also becomes less uniform. A countywide percentage therefore describes total area, not the local density of the class in every direction.
Forest covers only 1.61%, so it does not form the kind of extensive continuous background seen in heavily wooded counties. Green patches appear in multiple locations, often between agriculture and wetlands. Small wooded areas may still be locally important, but a countywide map at this scale is not intended to inventory every tree stand or narrow wooded strip. A higher-resolution source would be needed for that task.
Grassland at 0.52% and shrubland at 0.99% are also minor in the county summary. Because these categories occupy small shares, their boundaries can be difficult to interpret at a countywide scale. Raster land-cover data represent the landscape as grid cells, and a cell can contain more than one real-world surface. This map is therefore better for identifying broad farm, wetland, and natural-cover patterns than for tracing exact field or habitat edges.
Hard surfaces are concentrated near the center, while countywide imperviousness stays low
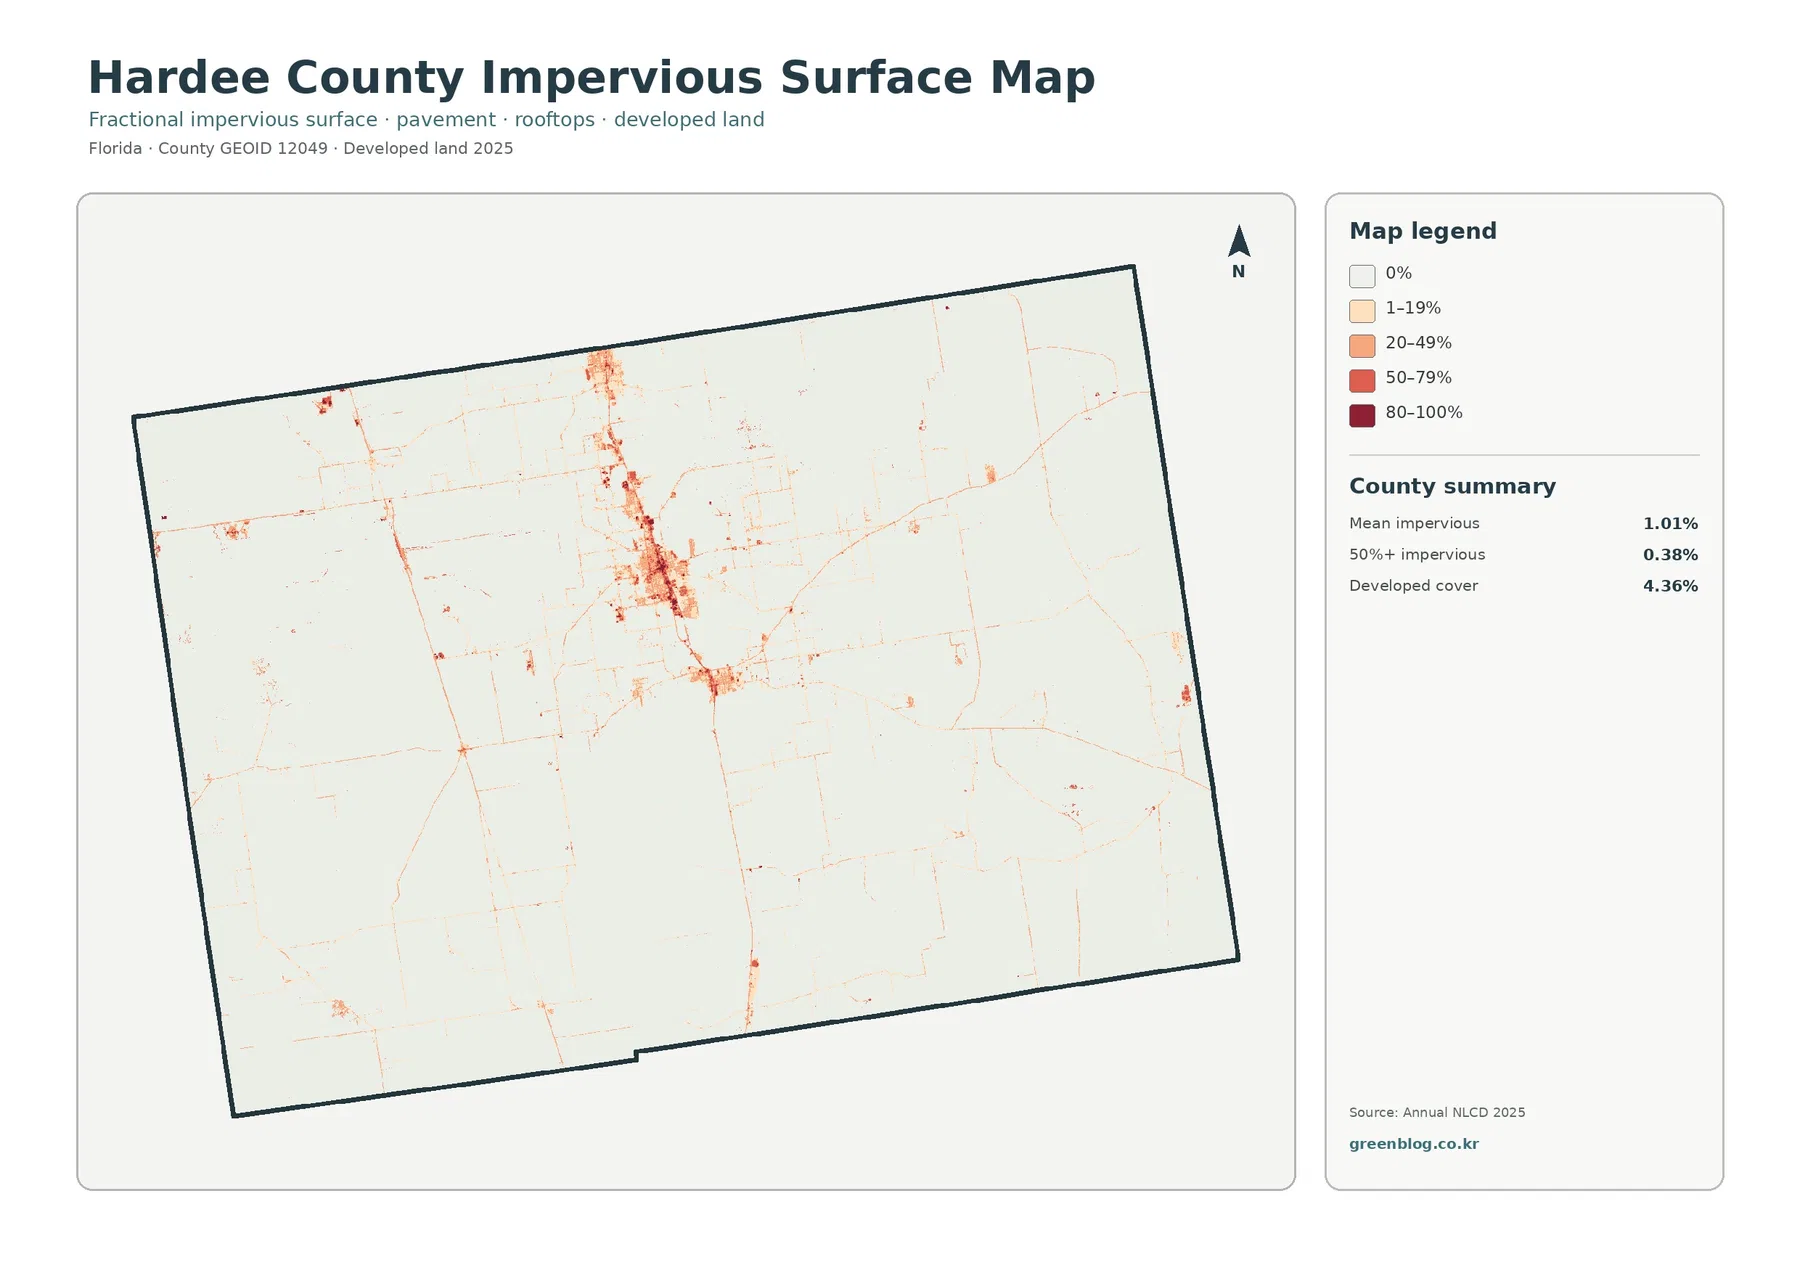
Impervious surface means hard cover such as pavement, parking areas, and rooftops where water does not easily soak into the ground. Hardee County’s mean impervious value is 1.01%, and only 0.38% of the county is mapped at 50% or greater imperviousness. Those values are low compared with the 4.36% developed-cover share on the general map.
The strongest impervious colors form a compact cluster near the center of the county. Thin lines and smaller points extend away from that cluster, with a few additional concentrations in other directions. Most of the county remains very pale. The visual pattern fits the countywide statistic: hard surfaces are present, but they do not form a broad continuous urban footprint.
Developed land and impervious surface should not be treated as interchangeable measures. A developed land-cover class can include lawns, bare soil, trees, and other permeable surfaces around buildings and roads. Impervious mapping focuses more narrowly on the fraction of hard surface. Seeing 4.36% developed cover alongside a 1.01% mean impervious value is therefore reasonable and helps separate settlement-related cover from actual hard-surface density.
This map is useful for a first look at where hard surfaces are concentrated, but it is not a building-footprint or engineering drainage map. Thin lines should not be measured as exact road widths, and colored cells should not be interpreted as parcel boundaries. Detailed stormwater, construction, or property decisions require higher-resolution and legally authoritative data.
The 1985–2025 comparison emphasizes agricultural loss and other class differences
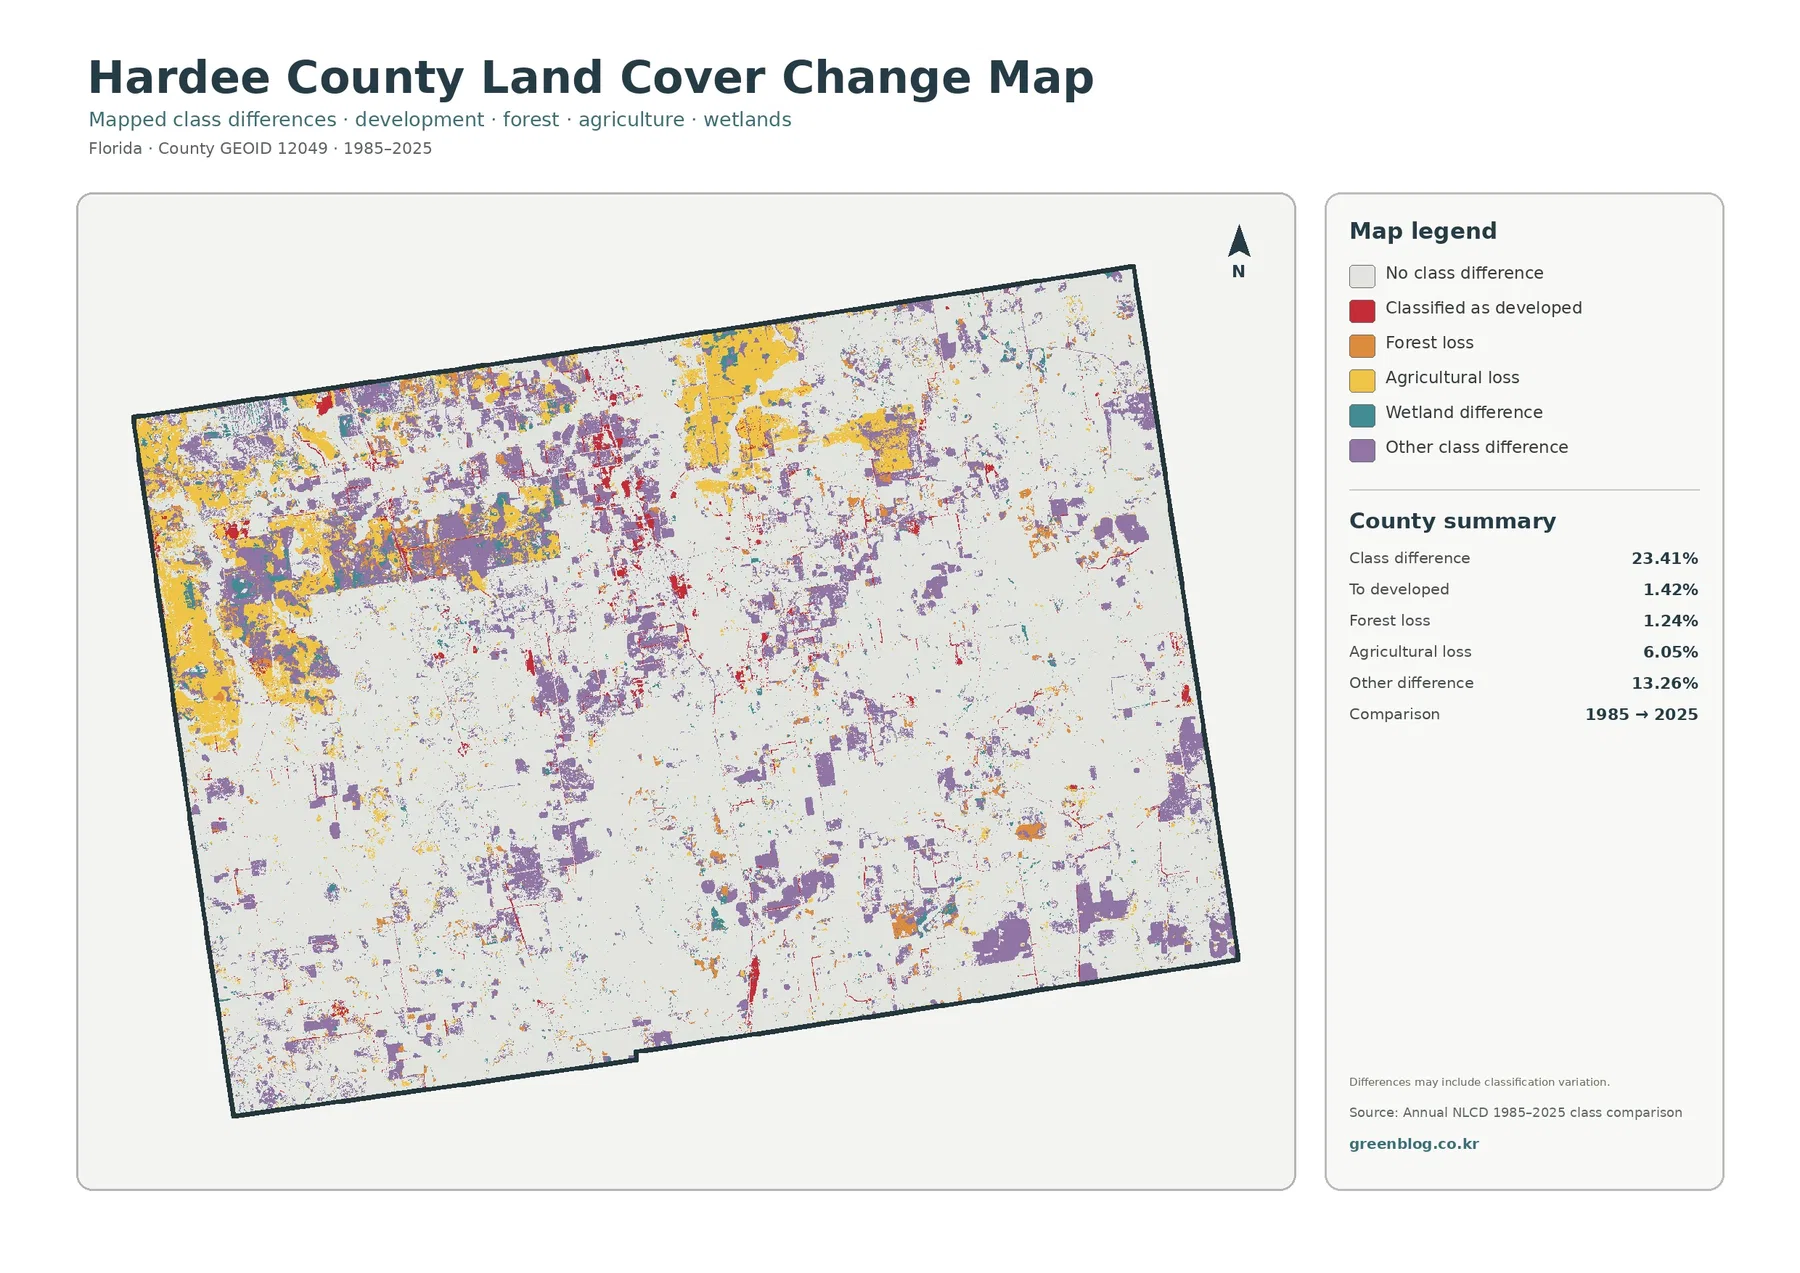
The change map reports a total class difference of 23.41% between 1985 and 2025. The summary identifies 1.42% classified as developed, 1.24% forest loss, 6.05% agricultural loss, and 13.26% other class difference. Wetland difference has its own legend color, but the package does not provide a separate percentage for that category, so no additional number should be inferred from the image.
Agricultural-loss cells appear in noticeable patches in the west and northwest and in other parts of the county. Purple cells representing other class differences are widely scattered and in some places form broad patches. Red developed-transition cells make up a small countywide share but can be seen around the central area and along a few narrow patterns. The purpose of this map is to identify where classifications differ, not simply to restate the 2025 distribution.
A critical limitation is printed on the map itself: class differences may include classification variation. Differences in imagery, mixed pixels, classification methods, or boundary treatment can cause a cell to receive a different class even when the physical landscape change is less dramatic. For that reason, 23.41% should not be described as a measured physical-change rate for Hardee County.
The same caution applies to the 6.05% agricultural-loss figure. It is best understood as the share of cells that moved out of an agricultural classification in this comparison, not as a direct measurement of permanently lost farmland. Likewise, the 1.24% forest-loss category should not automatically be equated with logging or development. Aerial imagery and additional years of land-cover data are better follow-up sources when the cause of a local difference matters.
Separating present-day cover from mapped change avoids misleading conclusions
A practical reading sequence starts with the 2025 land-cover map. It answers the question, “What is mapped here now?” and immediately shows the dominant agricultural background, extensive wetlands, and much smaller developed share. The forest-and-farmland view then simplifies the relationship between working land and natural cover. Together they explain why Hardee County can be strongly agricultural while still containing a very large wetland share.
The impervious map answers a different question: where are hard surfaces concentrated? Its central cluster can be compared with the developed class on the general map, while the pale areas show how little high-impervious cover exists across most of the county. A location mapped as developed does not need to have a high impervious percentage because developed areas can contain many permeable surfaces.
Only after those current-condition maps are understood does the 1985–2025 comparison become easy to use. It can then locate places where class labels differ from the earlier year. Keeping the current maps and the change comparison conceptually separate prevents a common mistake: assuming that a current agricultural or wetland area must have changed simply because nearby cells carry change colors.
Local agricultural context helps explain why the farm map matters
The large agricultural share is consistent with the importance of agriculture in local Extension work. UF/IFAS Extension Hardee County provides programs and information related to agriculture and natural resources, and its county office is in Wauchula. That county-specific source gives useful background for why agricultural questions matter locally, while the percentages on this page come from the supplied 2025 land-cover maps.
Land cover still needs to be kept separate from legal land use. A cell mapped as agriculture does not prove that a parcel has agricultural zoning, and a wetland-classified cell does not establish a regulatory wetland boundary. A developed cell does not indicate that additional construction is permitted. Ownership, zoning, permitting, and legal boundaries must be checked through the appropriate official records.
Countywide land-cover maps work well as screening tools. They show where large agricultural blocks meet wetlands, where developed cover is concentrated, and which portions of the county may deserve a closer look. They are much less suitable for legal or survey questions that depend on precise parcel geometry.
Raster scale and the 2025 observation year set clear limits
Annual NLCD-style land-cover data are raster data, meaning the landscape is represented by a grid of cells. A single cell can contain a mixture of crops, road surface, vegetation, water, or bare ground. The classification assigns a representative value, so a sharp color boundary on the map should not be assumed to match a fence line, ditch, field edge, or parcel boundary exactly.
At the county scale, the maps are strong for broad patterns: more than half agricultural cover, nearly one-third wetlands, a small central developed cluster, and very low average imperviousness. Small ponds, narrow roads, tiny forest patches, and fine wetland edges may be generalized or difficult to see. A site-level investigation needs higher-resolution imagery or other local datasets.
The year matters as well. The land-cover and impervious maps describe the supplied 2025 classification. Later construction, crop rotation, clearing, flooding, or vegetation changes are not automatically included. The comparison map uses 1985 and 2025 as its endpoints, so it should not be treated as a continuous year-by-year history.
Match each downloadable JPG to the question you need to answer
For a general county overview, the standard land-cover map is the best single image because it combines every major class and the summary percentages. For an agriculture-focused lesson or report, the forest-and-farmland map removes some clutter and makes the relationship between the 55.04% agricultural share and the 31.37% wetland share easier to explain.
For development or runoff context, the impervious map is more useful than the general map alone. It shows that the strongest hard-surface concentration is localized while the countywide mean remains 1.01%. The change map is the appropriate choice when the question concerns locations where the 1985 and 2025 classifications differ. It should be paired with a current map rather than used as a substitute for one.
The downloadable ZIP contains four JPG files: the 2025 land-cover map, forest-and-farmland map, impervious/developed-land map, and 1985–2025 land-cover-change map. Each JPG is 2480×1754 pixels. The files can be inserted into reports, classroom materials, screen presentations, and modest-size prints. Keeping the title, year, and legend visible helps readers interpret the maps correctly.
Before making a large print, check whether the legend and small change cells remain readable at the intended output size. The supplied 2480×1754-pixel files are below the pixel dimensions normally associated with a full A3 print at 300 dpi. Enlarging the change map too aggressively can make small raster cells look soft or blocky.
Frequently Asked Questions
What is the largest 2025 land-cover class in Hardee County?
Agriculture is the largest class at 55.04%, followed by wetlands at 31.37%. Together they account for more than 86% of the county. The map shows broad agricultural areas repeatedly divided or bordered by wetland patches and corridors. Barren land at 4.57% and developed land at 4.36% are much smaller shares.
Why is developed cover 4.36% while mean impervious cover is only 1.01%?
The two measures describe different things. Developed land cover can include lawns, soil, trees, and other permeable surfaces within settled areas, while impervious mapping focuses on hard surfaces such as pavement and rooftops. A developed area can therefore have a relatively low impervious fraction.
Does the 6.05% agricultural-loss value mean Hardee County permanently lost that much farmland?
No. The change map compares classifications in 1985 and 2025, and it warns that mapped differences can include classification variation. The 6.05% value is best used to locate cells that moved out of an agricultural class in the comparison. Confirming a real land-use history requires additional imagery or time-series data.
Map File Information
Download the four original Hardee County land-cover JPG maps together in one ZIP file.
- Included Files: Use only the versions confirmed in the article and supplied images
- File Type: Use the confirmed download contents
- Intended Use: Printing, education, presentations, and map-based projects
Related Maps
- Alachua County Florida Land Cover Map
- Baker County Florida Land Cover Map
- Bay County Florida Land Cover Map
Sources and References
- MRLC Annual NLCD Data – official access to Annual NLCD land-cover data and related products.
- USGS Annual NLCD Land Cover Classification – official documentation for land-cover class definitions.
- U.S. Census Bureau TIGER/Line Shapefiles – official geographic boundary resources used for county reference.
- UF/IFAS Extension Hardee County – a county-specific source for agriculture and natural-resources programs and information.
Green Map creates custom-edited map images using open geographic data sources such as geoBoundaries, Natural Earth, OpenStreetMap, and government open data.
These maps are edited visual materials, not raw data files, and are provided for education, documents, presentations, and graphic reference.