Wetlands define the 2025 land-cover picture in Gulf County, Florida. They account for 68.71% of the mapped area and form a broad, mostly continuous field through the center, east, and south of the county. The northern and western portions are more varied, with forest, grassland, shrubland, developed land, and small agricultural patches breaking up the wetland pattern. This page uses four maps to examine the current cover, the forest-and-farmland mix, impervious surface, and mapped class differences from 1985 to 2025.
The WebP images in the article are intended for quick viewing. A single download contains the four original JPG maps for closer inspection, documents, and presentation slides. Land cover is not the same as zoning, ownership, or legal land use. It is a classification of the surface into categories such as water, forest, agriculture, wetlands, and developed land, so it works best for county-scale comparison rather than parcel decisions.
Table of Contents
A county where wetlands occupy more than two-thirds of the mapped surface
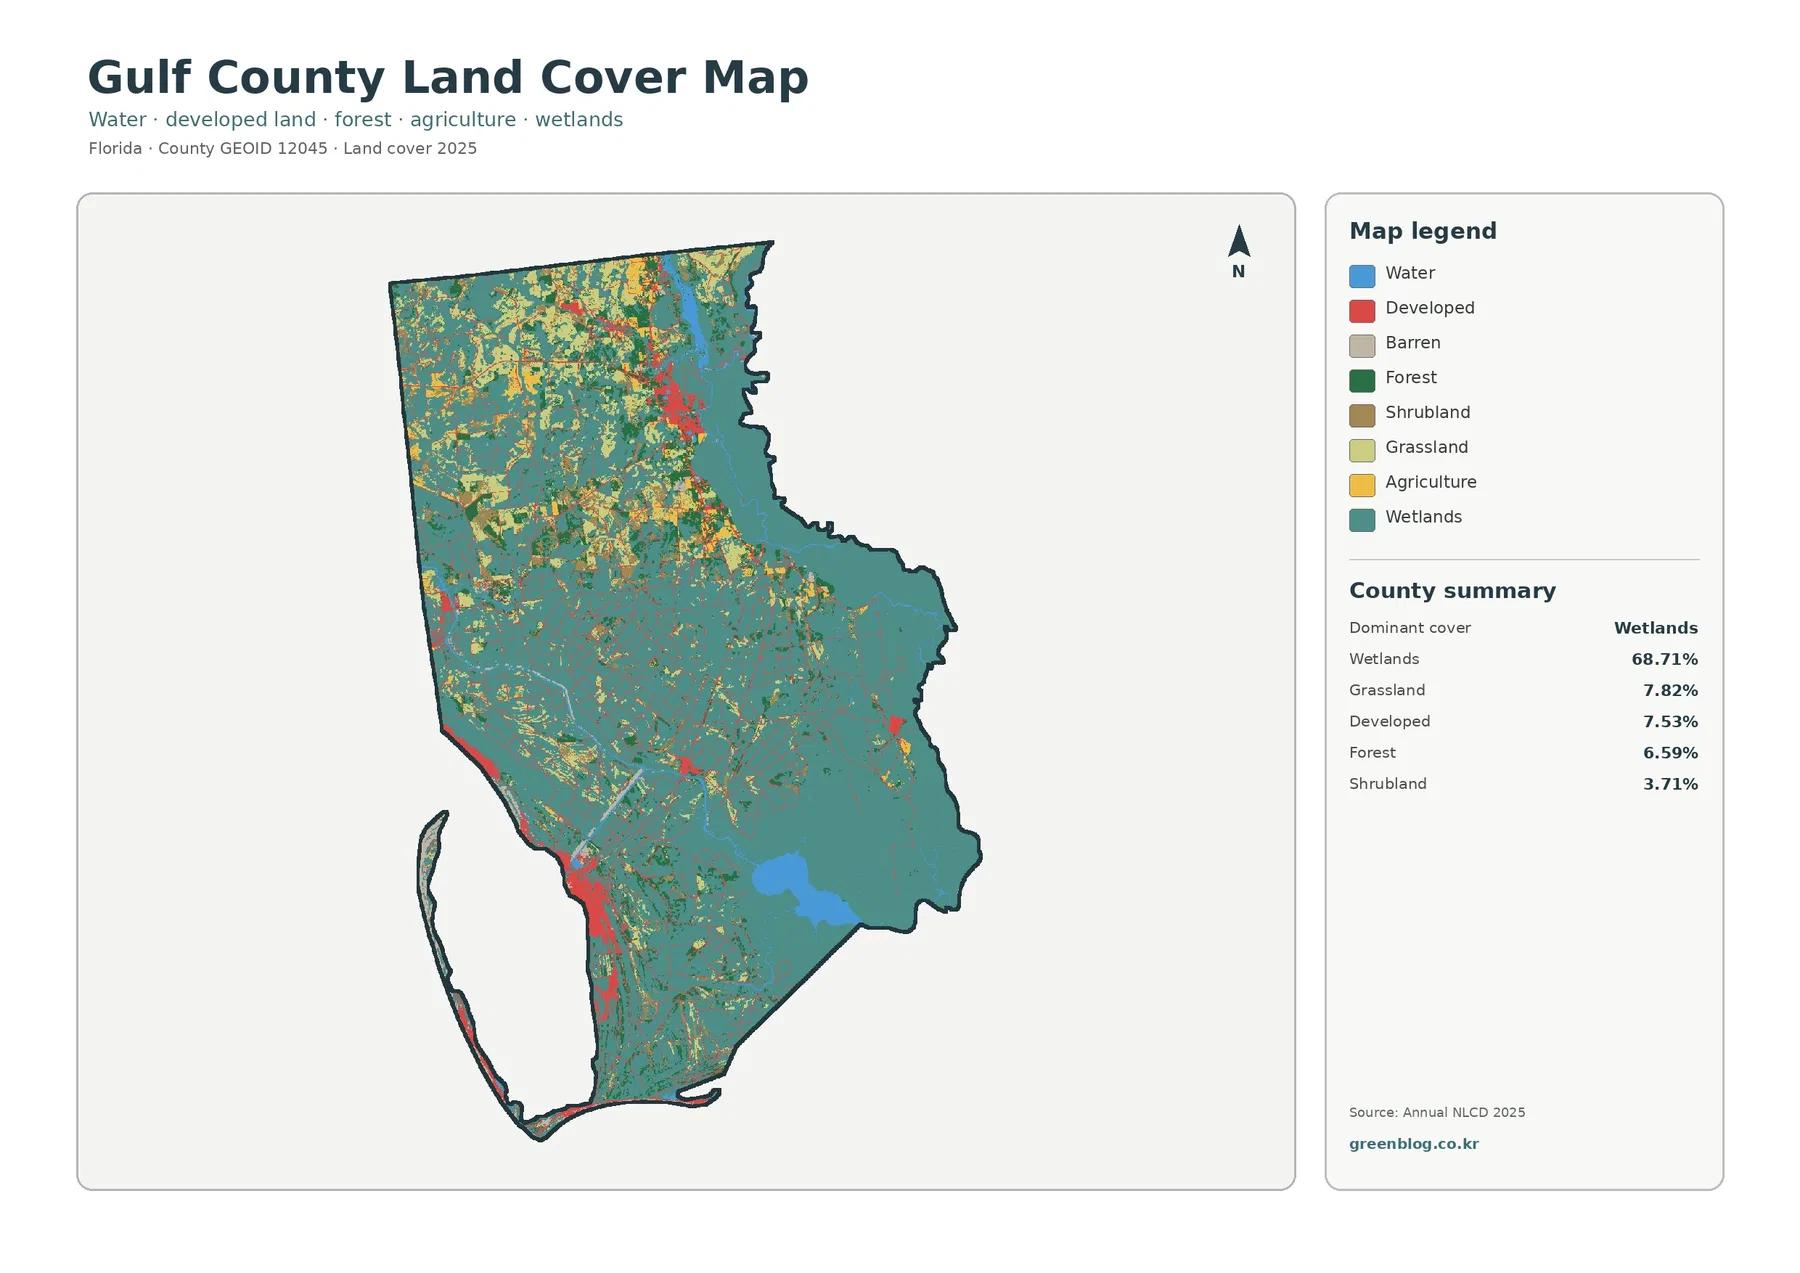
At 68.71%, wetlands are by far the largest category in the county summary. The map makes that dominance visible without relying on the number alone: teal extends across most of the interior and covers large portions of the eastern and southern areas. The western and northern edges are still wetland-rich, but their pattern is more fragmented because several other classes appear much more often there.
Grassland is the second-largest listed category at 7.82%, while developed land follows closely at 7.53%. Those similar percentages do not produce similar map shapes. Grassland appears as many light-green patches, especially in the north and west. Developed land is more localized, forming several compact concentrations and thin linear features rather than an even blanket across the county.
Forest covers 6.59% and shrubland 3.71%. Both are most noticeable where the northern and western landscape becomes more varied, although smaller patches also occur beside broad wetland areas. Water accounts for 2.74% and appears as distinct blue areas. Agriculture is only 1.68%, with small yellow patches concentrated mainly in the more mixed northern portion. Barren land is included in the legend but is not listed among the leading summary percentages.
The map is most informative when these categories are read together. Saying that Gulf County is “mostly wetland” is accurate at a broad level, but it misses the contrast between the large wetland interior and the more diverse northern and western edges. That contrast matters for environmental education, regional comparison, and any presentation that needs to explain why a single county percentage cannot describe every part of the map equally well.
Forest, grassland, and small agricultural patches stand out more clearly in the north
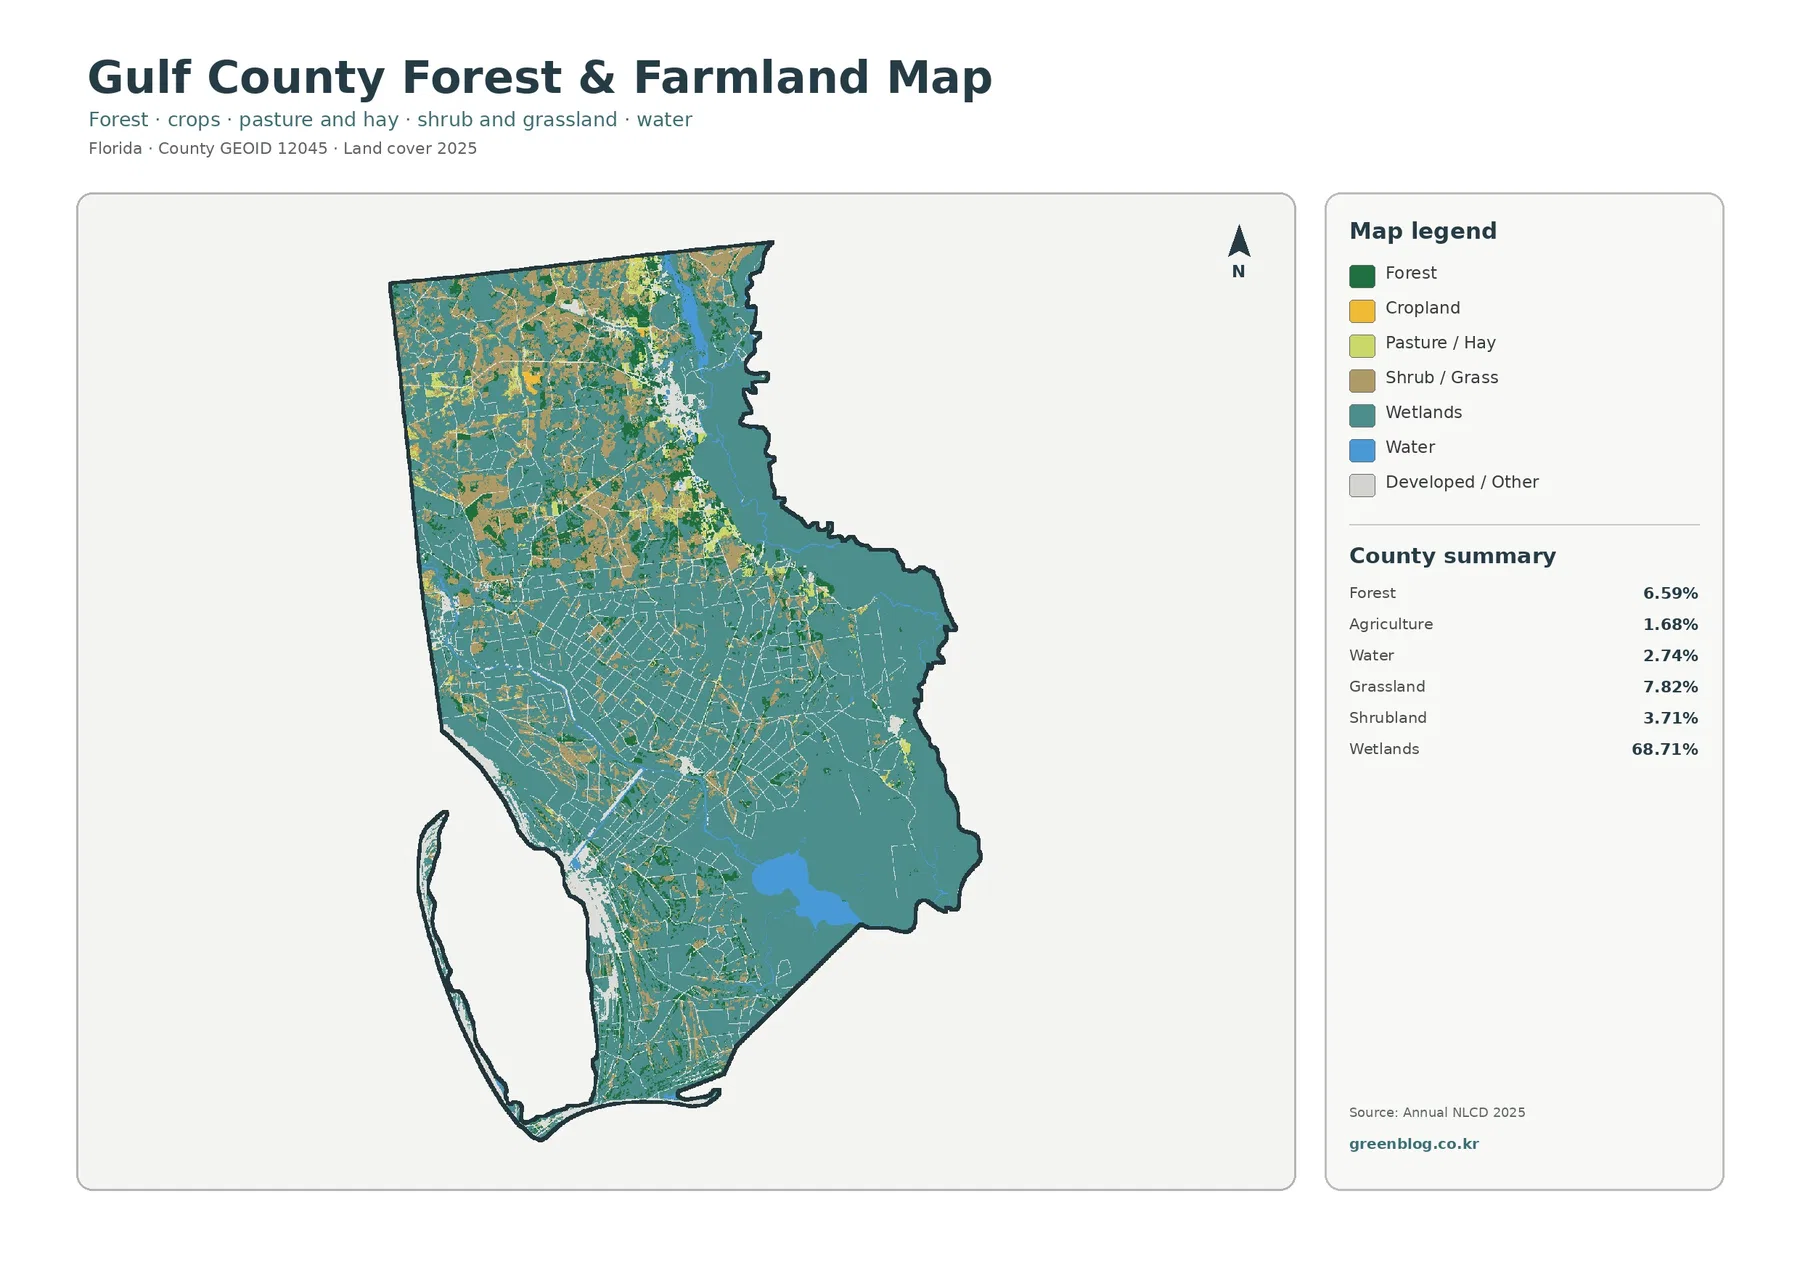
The forest-and-farmland view reduces the visual emphasis on development and makes the natural-cover mix easier to compare. In the south and much of the center, wetlands still dominate. Farther north, green forest patches, light-green grassland, muted shrub-and-grass areas, and small agricultural cells occur much more frequently. The result is a clear shift from a broad wetland field to a finer mosaic of cover classes.
Forest occupies 6.59% of the county. Although that share is modest compared with wetlands, the green patches are important because they repeatedly interrupt the wetland pattern in the north and west. Some forest areas sit directly beside wetlands, while others are surrounded by grass or shrub cover. The map does not identify tree species, stand age, or forest management, so those questions require a different dataset.
Agriculture accounts for 1.68% and is visually limited. Yellow patches are small and scattered rather than arranged as one continuous farming belt. That percentage describes the mapped surface class, not the economic importance of farming or the boundaries of individual properties. Crop type, ownership, and field management are outside the scope of this land-cover layer.
Grassland at 7.82% and shrubland at 3.71% add much of the texture seen in the northern half. They should not be merged into forest simply because all three are vegetated categories. Each class represents a different mapped surface condition. Keeping them separate preserves useful information about how open vegetation, woody cover, and wetlands are arranged next to one another.
Open water is 2.74%, shown in blue rather than teal. That distinction is worth keeping in mind when a blue water body is surrounded by wetlands. Wetlands can contain vegetation and seasonally wet surfaces, while the water class represents open water. The map supports broad comparison of those two categories, but it is not a legal wetland delineation or a survey of shoreline boundaries.
Hard surface is sparse even though developed land reaches 7.53%
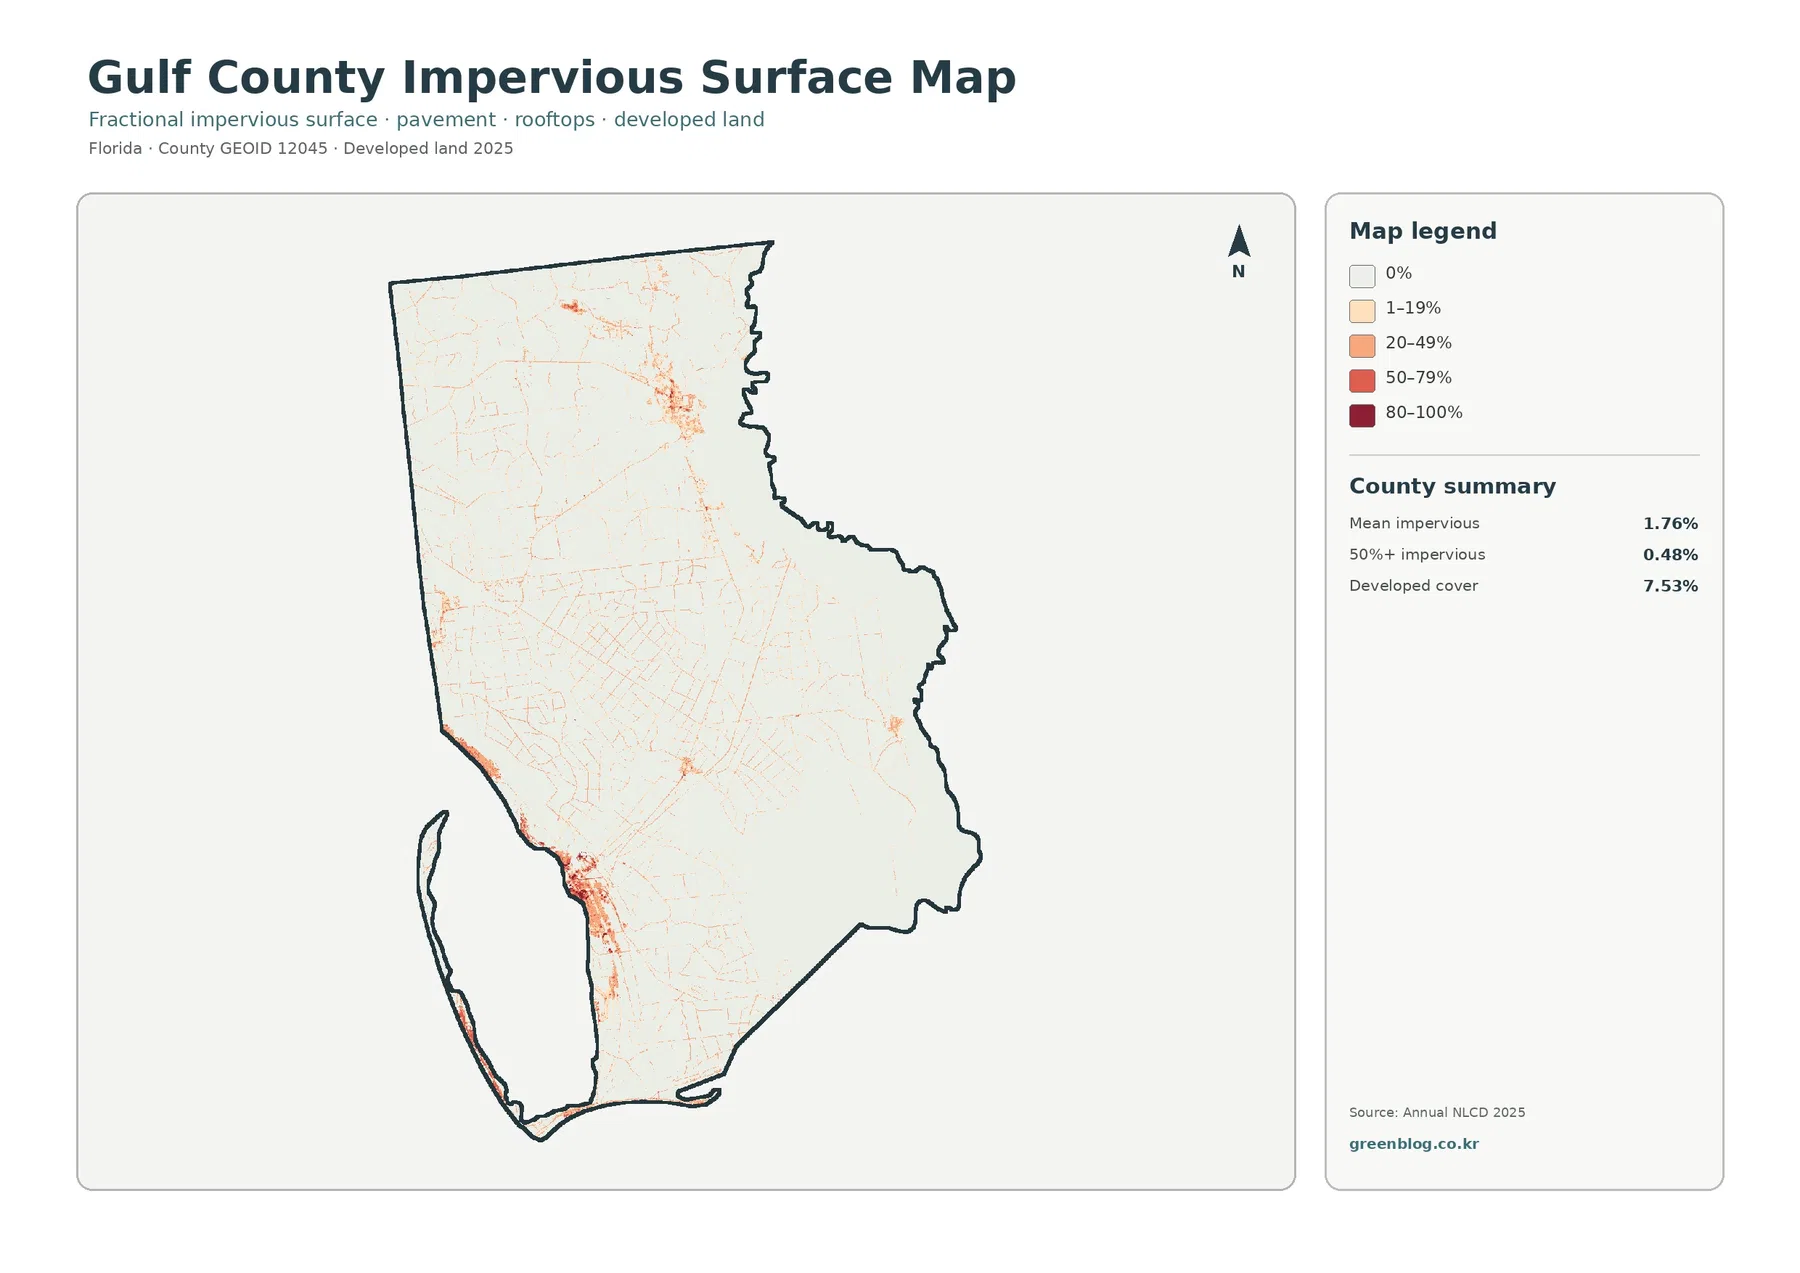
Impervious surface means pavement, rooftops, parking areas, and similar surfaces that do not readily absorb water. Gulf County has a mean impervious value of 1.76%, and only 0.48% of the mapped area reaches at least 50% impervious cover. Those values are much lower than the 7.53% developed-land share because developed classes can include lawns, bare soil, vegetation, and other surfaces that still allow some infiltration.
Most of the impervious map is nearly white. Stronger colors appear in a northern concentration, at a few western locations, and along portions of the southwestern coastal edge. Small clusters also occur in the south. Because the map does not label towns, roads, or municipal boundaries, it would be inappropriate to assign every colored cluster to a named community from this image alone. What the map does establish is that hard surface is concentrated rather than evenly distributed.
The southwestern edge is especially useful for comparison because darker impervious cells form a narrow concentration near the coast, while the broad central and eastern wetland areas remain very light. The general land-cover map shows developed classes in many of the same places, but the impervious layer adds a second piece of information: it estimates how much of each area is actually covered by hard surface.
A low countywide impervious percentage should not be interpreted as a flood or drainage assessment. Imperviousness describes only one part of how water moves through a landscape. Rainfall, elevation, wetland condition, drainage structures, soils, and water levels are not represented by this map. For site-level drainage or hazard questions, more detailed official information is necessary.
The 1985–2025 comparison is a map of class differences, not a simple change-rate chart
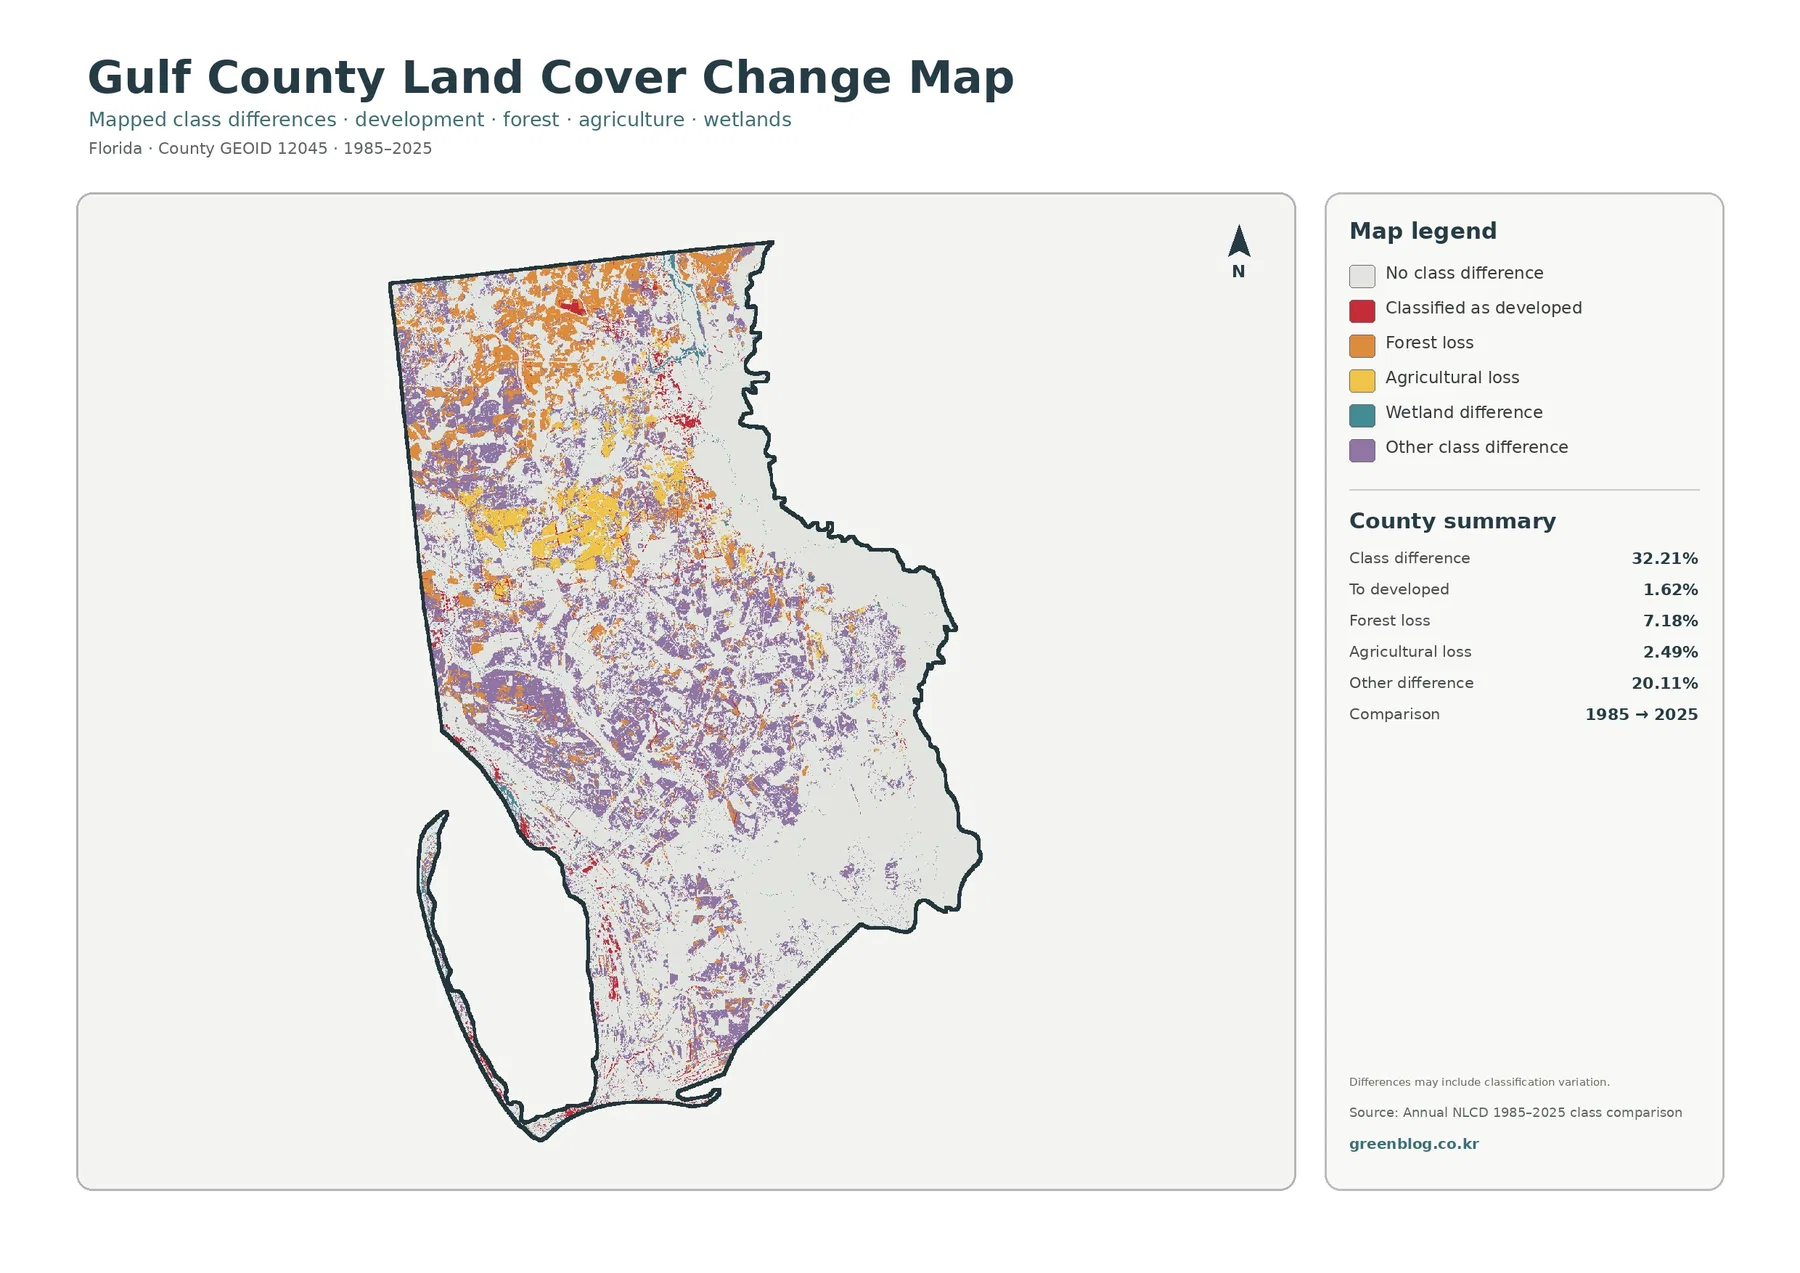
The comparison map reports a total class difference of 32.21% between 1985 and 2025. Within that summary, 1.62% is classified as a transition to developed, 7.18% as forest loss, 2.49% as agricultural loss, and 20.11% as other difference. The large “other difference” component is a strong reason not to describe the entire 32.21% as development, deforestation, or any other single process.
Orange forest-loss cells, yellow agricultural-loss cells, and purple other differences are especially common in the northern and western portions. Red developed transitions are present but occupy a much smaller share of the map. Large white areas remain in the center and south, indicating places where the mapped class did not differ between the two comparison years. The geography of change is therefore uneven.
A note on the map states that differences may include classification variation. Images from different dates can be affected by seasonal vegetation, moisture, observation conditions, and changes in classification methods. For that reason, a cell labeled as forest loss does not automatically prove permanent removal of forest on the ground, and agricultural loss is not the same as a verified reduction in farm acreage.
The most defensible use of this layer is to identify places that deserve a closer look. Intermediate-year Annual NLCD layers, aerial imagery, or field information can then be used to investigate what happened. The map is a screening and comparison tool, not a substitute for a documented land-change study.
Reading the four maps together separates current cover, development intensity, and long-term difference
The general land-cover map answers a present-day question: what kinds of surface cover dominate Gulf County in 2025? The answer begins with wetlands at 68.71%, then shows where grassland, developed land, forest, shrubland, water, and agriculture interrupt that broad pattern. It is the strongest single map for a county overview.
The forest-and-farmland view is better when the purpose is to compare vegetated and working-land classes without the developed categories drawing as much attention. It reveals the more varied northern landscape and shows how small agricultural areas sit among forest, grass, shrub cover, and wetlands. That makes it useful for environmental lessons or county-to-county comparison.
The impervious map shifts the question from land-cover category to surface hardness. A developed cell does not necessarily have a high impervious percentage, and Gulf County illustrates that difference clearly: developed cover is 7.53%, while mean imperviousness is only 1.76%. Presenting those two values side by side helps prevent an easy but misleading assumption that all developed land is paved or roofed.
The change map adds time, but it should be placed last in an explanation because its colors are easiest to understand after the current map is familiar. A red transition to developed, for example, says that the 1985 and 2025 classifications differ in a particular way; it does not report current impervious density. Comparing the layers rather than combining their percentages produces a clearer interpretation.
Raster cells, mixed pixels, and observation year set practical limits on detail
Annual NLCD land cover is generalized to raster cells. At a 30-meter scale, a narrow road, a small water channel, a tree line, a wetland edge, and nearby grass can fall within the same cell. The classification represents the cell rather than a surveyed property boundary. Enlarging the image makes the pixels easier to see, but it does not add parcel-level detail that was never part of the source.
Mixed pixels are especially important along wetland-water boundaries and around small developed features. A cell can contain more than one real-world surface, yet the land-cover product must assign or summarize it according to its classification rules. That is why exact legal wetland limits, shoreline surveys, ownership boundaries, and building permits should never be read from this map.
The 2025 layer also has a time limit. Construction, restoration, vegetation change, flooding, or agricultural conversion after the observation period may not appear here. When the most recent condition of a specific location matters, current aerial imagery and local administrative records should be consulted in addition to the map.
For comparisons with another county, keep the year and classification system consistent. Comparing Gulf County’s 2025 values with an older map from another area can mix genuine geographic differences with differences caused by observation date. Using the same Annual NLCD year and legend creates a cleaner basis for comparing wetlands, development, forest, and agriculture.
Choosing and downloading the four Gulf County JPG maps
The download contains four JPG files: the 2025 general land-cover map, the forest-and-farmland map, the impervious-surface/developed-land map, and the 1985–2025 class-difference map. Each JPG is 2480×1754 pixels. The WebP versions on the page are convenient for browsing, while the JPG files are better suited to zooming, document layout, and slide preparation.
Use the general map when one image must summarize the county. Choose the forest-and-farmland view when vegetation and agriculture are the main topic. The impervious map works best for explaining where hard surface is concentrated. The change map is appropriate when the goal is to locate long-term class differences and then compare them with the current 2025 pattern.
The JPG dimensions are useful for ordinary documents and screen presentations, but they do not reach full A3 pixel dimensions at 300 dpi. If a large print is planned, test the legend and small class patches at the intended physical size before producing the final poster. This is especially important for the change map because many colored cells are small and closely spaced.
Frequently Asked Questions
What is the largest 2025 land-cover class in Gulf County?
Wetlands are the largest class at 68.71%. Grassland follows at 7.82%, developed land at 7.53%, forest at 6.59%, shrubland at 3.71%, water at 2.74%, and agriculture at 1.68%. The map shows the broadest wetland areas through the center, east, and south, with a more varied mix in the north and west.
Why is developed cover 7.53% while mean impervious cover is only 1.76%?
Developed land can include lawns, soil, trees, and other permeable surfaces along with pavement and rooftops. Impervious cover measures the hard-surface portion separately. In Gulf County, only 0.48% of the mapped area reaches at least 50% impervious cover.
Does the 32.21% class difference mean that one-third of the county physically changed?
No. The map explicitly notes that classification variation may be included. The summary separates 1.62% to developed, 7.18% forest loss, 2.49% agricultural loss, and 20.11% other difference. It is best used to locate cells with different 1985 and 2025 classifications, not as a direct measurement of all physical land change.
Sources and Reference Material
- MRLC Annual NLCD Data — official access to Annual NLCD land-cover data and related products.
- USGS Annual NLCD Land Cover Classification — definitions and background for the mapped land-cover classes.
- U.S. Census Bureau TIGER/Line Shapefiles — official county boundary data reference.
Map File Information
The four Gulf County land-cover maps are provided together in one ZIP archive.
- Included Files: Use only the versions confirmed in the article and supplied images
- File Type: Use the confirmed download contents
- Intended Use: Printing, education, presentations, and map-based projects
Related Maps
- Alachua County Florida Land Cover Map
- Baker County Florida Land Cover Map
- Bay County Florida Land Cover Map
Green Map creates custom-edited map images using open geographic data sources such as geoBoundaries, Natural Earth, OpenStreetMap, and government open data.
These maps are edited visual materials, not raw data files, and are provided for education, documents, presentations, and graphic reference.