Gadsden County’s 2025 land-cover pattern is led by forest at 40.55%, followed by wetlands at 24.76%, agriculture at 10.59%, and developed land at 8.98%. The county is not divided into one simple urban side and one rural side. Forest, farms, wet areas, and several separate population centers repeatedly meet across the map, creating a patchwork that is easy to miss if the percentages are read without the geography.
Four map views are provided here: a countywide land-cover map, a forest-and-farmland map, an impervious-surface/developed-land map, and a 1985–2025 classification-difference map. The four original JPG files are available together in the download section. These maps describe surface cover; they do not establish ownership, parcel boundaries, zoning, development rights, or permit status.
Table of Contents
Hard surfaces cluster around separate towns rather than forming one continuous urban belt
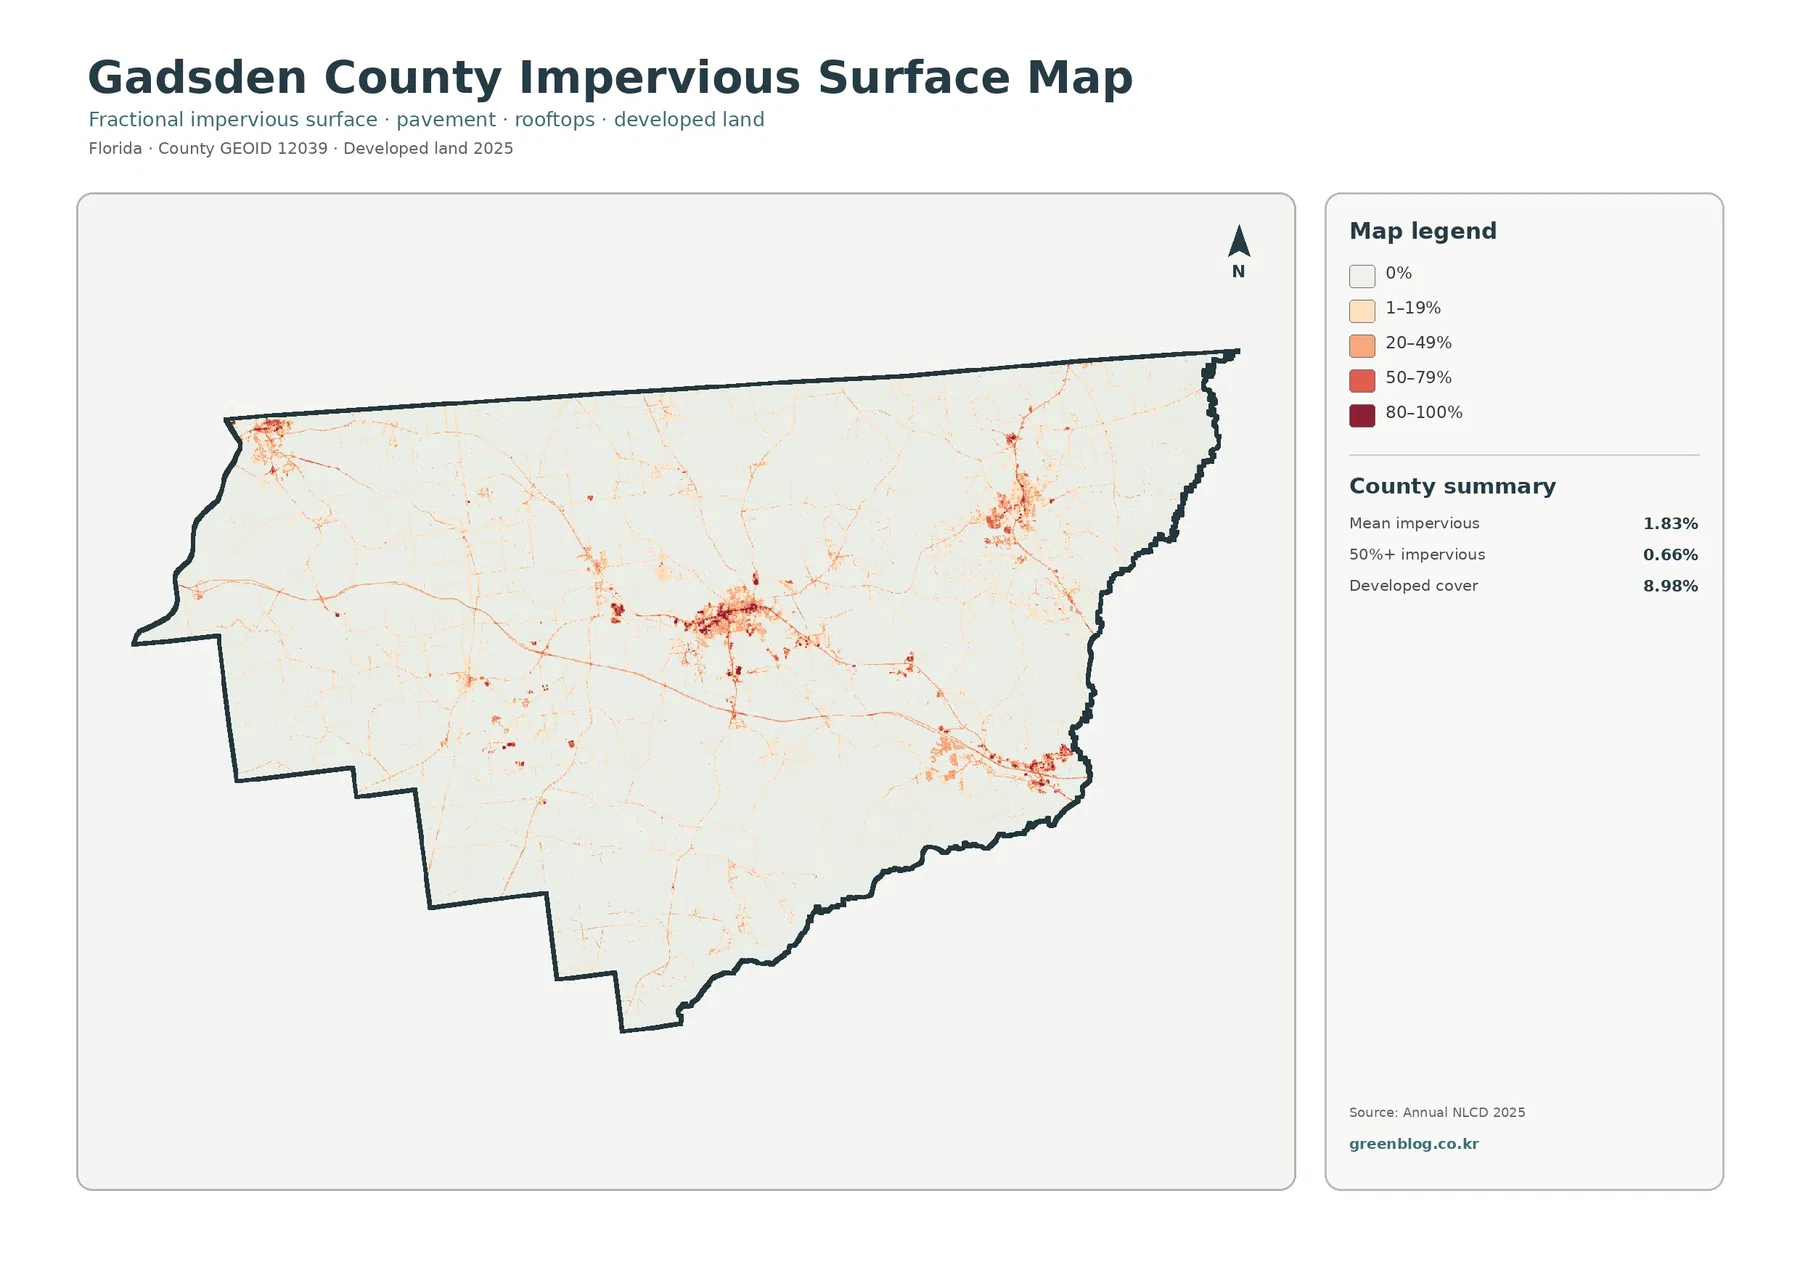
The impervious-surface layer is a useful place to begin because it immediately reveals how limited the hardest surfaces are across Gadsden County. Mean imperviousness is 1.83%, and only 0.66% of the mapped area is at least 50% impervious. Those values are far below the 8.98% developed-cover share because developed land can include lawns, trees, bare soil, and other permeable areas in addition to pavement, parking lots, and rooftops.
The strongest red tones appear in several distinct clusters. A large concentration sits near the center of the county, with other groups toward the northeast, southeast, and west. Thin road-like lines connect some of these places, while broad areas between them remain pale. The pattern is therefore better described as several compact developed centers within a largely rural and natural landscape than as one continuous metropolitan surface.
Gadsden County’s official municipalities page lists Quincy, Chattahoochee, Havana, Greensboro, Gretna, and Midway. Reading that list beside the map helps explain why the developed footprint breaks into multiple clusters. Quincy is the county seat and corresponds to the strongest central concentration, while other municipalities provide context for additional developed areas elsewhere in the county. The map should still be used as a surface classification, not as a municipal-boundary layer.
A countywide average can hide local contrast. Streets and town centers can contain much higher impervious fractions than 1.83%, while forests, farms, and wetlands may contain almost none. That is why the color intensity matters as much as the summary statistic. The map is especially helpful for explaining the difference between a developed class and the harder surfaces located within that class.
Impervious cover should not be treated as a flood-risk or drainage model. Pavement and rooftops can influence how rainfall reaches the ground, but actual flooding depends on rainfall, terrain, soils, channels, drainage systems, and other conditions. Site-level decisions require official flood information, engineering data, current imagery, and local planning records rather than this countywide land-cover product.
Forest is the largest 2025 class, but wetlands and farms interrupt it throughout the county
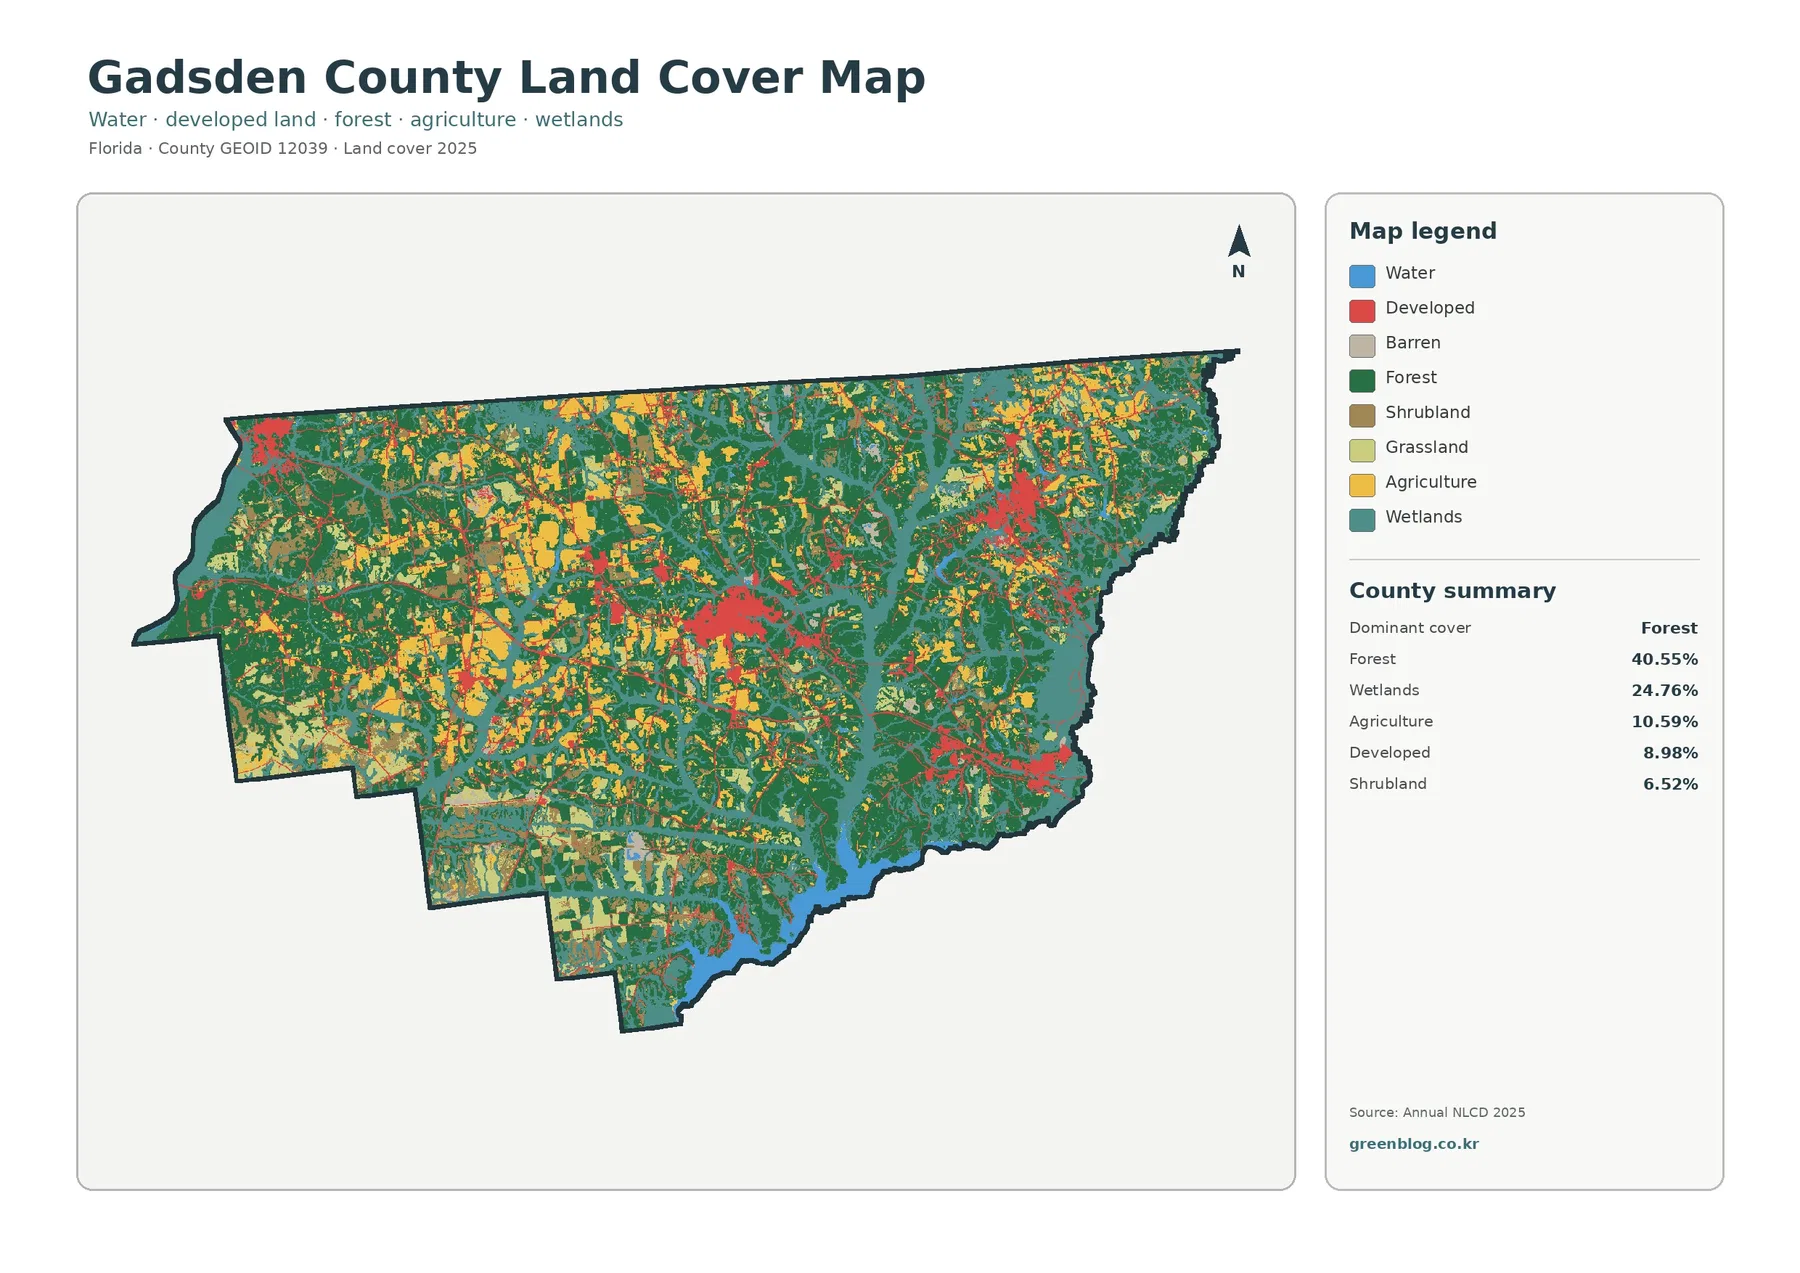
Forest covers 40.55% of Gadsden County and forms the largest single class in the 2025 summary. Dark green occupies broad areas in the west, center, north, and south. Even so, the forest is not a uniform blanket. Agricultural yellow, wetland teal, and developed red repeatedly break through the green, producing a landscape where several cover types can appear within a relatively short distance.
Wetlands account for 24.76%, making them the second-largest class. Teal follows broad low areas and water-influenced corridors through the county and becomes prominent toward the southern and southeastern parts of the map. Wetlands and open water are separate categories. Open water covers 2.19%, while wetlands include areas where saturated soils and wetland vegetation can dominate the surface.
Agriculture contributes 10.59%. Yellow patches are scattered through the western, central, and northern portions of the county rather than being confined to one farm district. The distribution is substantial enough to be a defining part of the countywide pattern, yet it remains embedded within a much larger forest-and-wetland setting. UF/IFAS Extension Gadsden County describes agriculture as an important part of local life, giving useful context for the mapped agricultural share.
Developed cover is 8.98%, which makes the red town clusters visually important without making development the dominant countywide class. Shrubland adds 6.52% and grassland 5.70%. These smaller natural and open classes appear among forest, farms, and wetlands and help explain why the map contains many color changes rather than broad, simple blocks.
The map is most useful when both percentage and position are considered. A bright red town center may attract the eye even though developed land represents less than one tenth of the county. Conversely, open water has a small countywide share but can be locally important where it meets broad wetland areas. The legend and summary should therefore be read together rather than using visual prominence alone to judge importance.
The forest-and-farmland view exposes a working-land mosaic inside a forested county
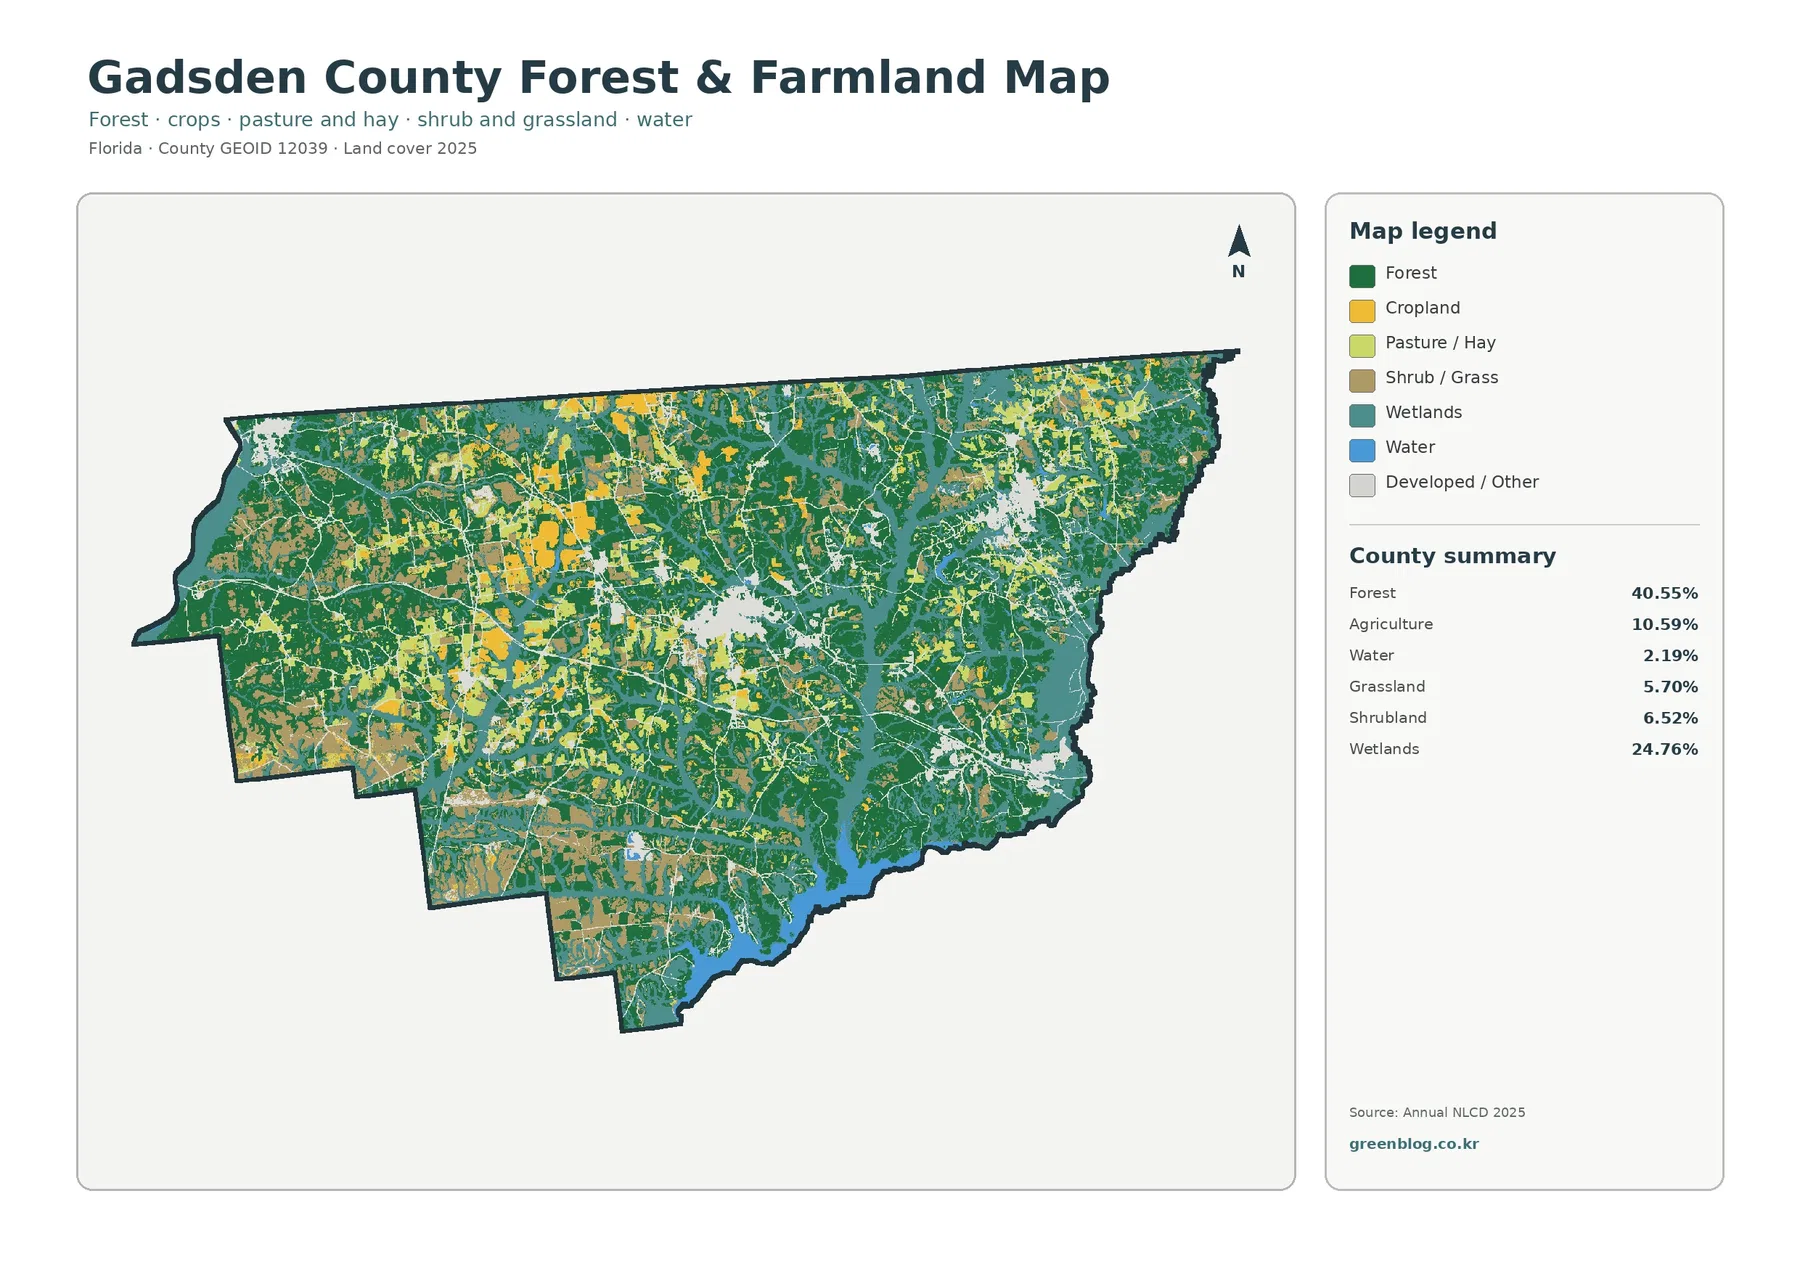
Removing most developed and miscellaneous classes makes the relationship between forest and agriculture much clearer. Dark-green forest remains the dominant background, but yellow agricultural patches are frequent enough that they cannot be dismissed as isolated exceptions. Some are broad, while others are narrow or fragmented. The resulting pattern is a mixture of wooded land and working land rather than a single large agricultural plain.
The 10.59% agricultural value is a land-cover statistic, not a count of farms or a measure of agricultural production. Individual fields and property boundaries are not drawn here. A classified raster cell can contain more than one real-world surface, and the assigned class represents a generalized interpretation of that cell. Farm ownership, crop type, acreage, and legal use require separate agricultural or parcel data.
Shrubland at 6.52% and grassland at 5.70% also matter in this view because they occupy enough area to shape transitions between forest, agriculture, and wetlands. At small display sizes, their colors can be difficult to distinguish from neighboring classes. The downloadable JPG makes the legend easier to inspect, but enlarging the image cannot produce detail finer than the source classification.
Wetlands remain prominent at 24.76% even when the map is designed to emphasize forest and farming. That keeps agricultural areas in context. A yellow patch beside teal wetland and dark-green forest tells a different story from an isolated farm polygon on a blank background. For classroom use, this map is well suited to discussing how agricultural and natural covers coexist within one North Florida county.
UF/IFAS Extension Gadsden County provides programs in agriculture and natural resources, which is a useful local reference for this combined map. The extension information supports the importance of both subjects in the county, but it does not supply the land-cover percentages shown here. The exact percentages in this article come from the supplied 2025 map package.
Water and wetland context becomes especially important toward Lake Talquin and the Ochlockonee system
The southern and southeastern parts of the county contain a visible mix of water and wetland cover. Florida State Parks describes Lake Talquin as an impoundment of the Ochlockonee River and notes surrounding forests, lowlands, swamps, bluffs, and other natural communities. That regional context helps explain why blue water and teal wetland areas become important features when the Gadsden County map is read near its southeastern side.
Lake Talquin should not be confused with the land-cover categories themselves. A park, forest, reservoir management area, or other legal boundary can contain several cover classes, and the same class can continue beyond a managed boundary. The land-cover map answers a surface question—what type of cover was classified at a location—not a jurisdictional or conservation-ownership question.
The county’s planning documents make the same distinction useful in another way. Gadsden County’s Comprehensive Plan addresses future land use, transportation, infrastructure, conservation, and related policy topics. Annual NLCD land cover, by contrast, summarizes observed surface classes. Comparing them can be informative, but neither dataset should be substituted for the other.
The 1985–2025 comparison contains 26.99% class difference, with forest loss the largest named component
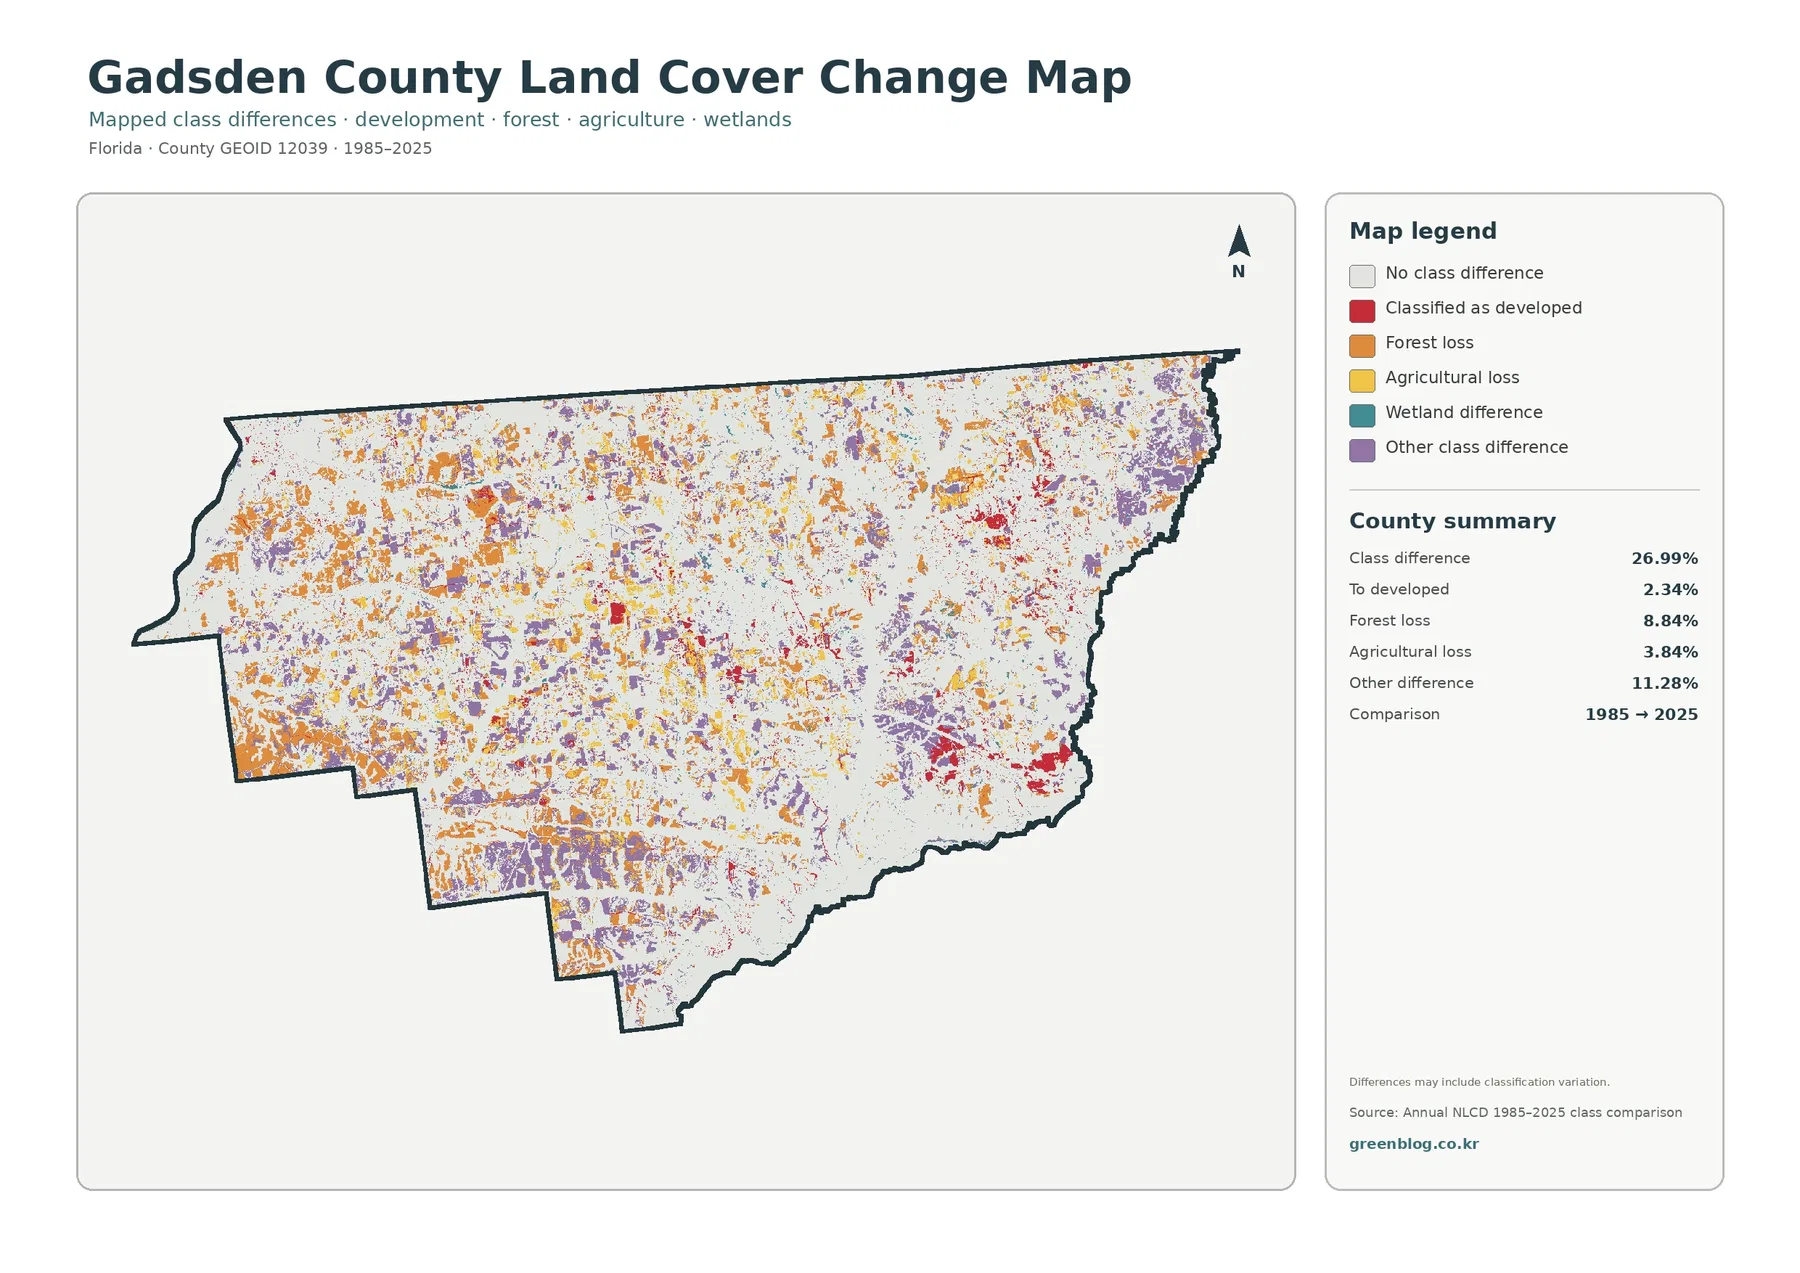
The supplied endpoint comparison reports 26.99% class difference between 1985 and 2025. It identifies 2.34% as change to developed, 8.84% as forest loss, 3.84% as agricultural loss, and 11.28% as other difference. Multiple colors are scattered widely across the county, so the map does not support a simple claim that change occurred in only one direction or around only one town.
Forest loss is the largest named component at 8.84%, but the label needs careful interpretation. The map compares classifications at two endpoints. A cell can change class because of real land-cover change, vegetation cycles, harvest and regrowth, different image conditions, or classification variation. The note on the supplied map explicitly warns that the differences may include classification variation.
Agricultural loss is 3.84%, while agriculture still covers 10.59% in the 2025 map. Those two numbers should not be converted into a direct agricultural decline rate. The endpoint map does not show every transition during the forty-year period, nor does it identify crop decisions, farm economics, or temporary field conditions. Intermediate-year land-cover products and agricultural records are needed for a stronger historical conclusion.
The 2.34% change-to-developed category appears in small red areas around several settlement zones. It identifies where the endpoint classes differ in a way that ends in developed cover, but it does not tell whether the change was housing, roads, commercial space, industry, or another developed use. Local planning and permit records would be needed to identify those specific causes.
A productive way to use the change layer is to start with a colored difference area and then return to the 2025 countywide and impervious maps. The first map tells the present cover class, while the impervious layer reveals whether harder surfaces are concentrated there. This sequence narrows questions without claiming more certainty than the supplied classification supports.
How to use the four maps without confusing scale, pixels, and legal land use
Annual NLCD is a raster classification, meaning the landscape is represented as a grid of cells. At the commonly used 30-meter scale, a narrow road, a small pond, scattered trees, and a field edge can occupy the same cell. The classification generalizes that mixture into a mapped class or value. This is one reason countywide maps should not be used as parcel surveys.
Mixed pixels are especially relevant in Gadsden County because forest, agriculture, wetlands, and developed areas frequently meet along irregular edges. A small field surrounded by trees may not have a perfectly sharp boundary at raster scale. The same issue can occur along wetland margins and narrow road corridors. Zooming into the JPG makes the existing pixels easier to see but does not create new source detail.
The 2025 maps describe the classification year shown in the package. Construction, forestry operations, agricultural changes, restoration work, or other surface changes after that observation period may not appear. Current decisions should therefore be checked against recent imagery and current county information.
For environmental education, each map can be assigned a different question. The countywide map answers what covers the most area. The forest-and-farmland view explains how working lands fit among forest and wetlands. The impervious layer locates the hardest developed surfaces. The change map identifies where endpoint classifications differ and introduces the need for caution when interpreting long-term change.
Download the four original JPG maps for reference, presentations, and printing
The download ZIP contains four original JPG files: the 2025 land-cover map, the forest-and-farmland map, the impervious/developed-land map, and the 1985–2025 land-cover-change map. The WebP figures in the article are convenient for quick browser viewing, while the JPG versions are better when the legend and smaller patches need to be enlarged in a document or slide.
Each source JPG in the package is 2480×1754 pixels. That is useful for screen-based presentations and many document layouts, but it is below full A3 size at 300 dpi. Print sharpness will therefore depend on the physical output size. Image pixel dimensions should also be kept separate from the land-cover dataset’s own raster resolution.
Frequently Asked Questions
What is the largest 2025 land-cover class in Gadsden County?
Forest is the largest class at 40.55%. Wetlands follow at 24.76%, agriculture at 10.59%, developed land at 8.98%, shrubland at 6.52%, grassland at 5.70%, and water at 2.19%. The geography matters as much as the ranking because farms, wetlands, and developed clusters repeatedly interrupt the broad forest pattern.
Why is developed cover 8.98% while mean imperviousness is only 1.83%?
Developed classes can contain lawns, trees, soil, and other permeable surfaces in addition to roads, parking lots, and rooftops. Mean imperviousness measures the harder surface component. Only 0.66% of the county is mapped at 50% or more impervious, and the strongest values cluster around several town centers rather than across the whole county.
Does the 26.99% class difference mean exactly 26.99% of Gadsden County physically changed between 1985 and 2025?
No. The endpoint comparison reports classification differences, including 2.34% to developed, 8.84% forest loss, 3.84% agricultural loss, and 11.28% other difference. The map itself notes that classification variation may be included. Confirming physical change requires intermediate-year data, aerial imagery, local records, and sometimes field information.
Map File Information
The ZIP contains the four original JPG land-cover maps for Gadsden County, Florida.
- Included Files: Use only the versions confirmed in the article and supplied images
- File Type: Use the confirmed download contents
- Intended Use: Printing, education, presentations, and map-based projects
Related Maps
- Alachua County Florida Land Cover Map
- Baker County Florida Land Cover Map
- Bay County Florida Land Cover Map
Sources and References
- MRLC Annual NLCD Data – official land-cover data access used for annual classification and comparison
- USGS Annual NLCD Land Cover Classification – definitions and background for mapped land-cover classes
- Gadsden County Towns & Municipalities – official listing of Quincy, Chattahoochee, Havana, Greensboro, Gretna, and Midway
- UF/IFAS Extension Gadsden County – local agriculture and natural-resources context
- Gadsden County Comprehensive Plan – official planning framework for future land use, conservation, transportation, and infrastructure
- Florida State Parks – Lake Talquin – background on Lake Talquin, the Ochlockonee River, and surrounding natural communities
Green Map creates custom-edited map images using open geographic data sources such as geoBoundaries, Natural Earth, OpenStreetMap, and government open data.
These maps are edited visual materials, not raw data files, and are provided for education, documents, presentations, and graphic reference.