Broward County has one of the clearest east-west land-cover divides in Florida. Wetlands account for 66.80% of the 2025 county summary, while developed land accounts for 31.00%. Most of the western county is mapped as a broad Everglades wetland landscape, and the eastern third is a dense urban area stretching toward the Atlantic coast. Instead of a gradual blend, the maps show a remarkably sharp transition between conservation wetlands and metropolitan development.
The page provides four different views: 2025 general land cover, impervious/developed land, a 1985–2025 change comparison, and a simplified forest/farmland/natural-cover map. The four original JPG maps are available together in one ZIP download. These are surface-cover maps, so they should not be treated as zoning, ownership, development-right, or regulatory wetland maps.
Table of Contents
The urban edge is visible almost immediately when moving east from the Everglades
Western Broward is dominated by a single broad teal expanse, while the eastern side becomes a continuous field of developed colors. Broward County’s Wetlands Program explains that roughly two-thirds of the county is set aside as Water Conservation Areas and remains part of the Everglades. That local description closely matches the 66.80% wetland share in the supplied 2025 map.
The boundary is not simply a line between “empty land” and “city.” Broward County’s water-resource planning identifies Water Preserve Areas along the eastern side of the Water Conservation Areas. These marshes, reservoirs, and recharge areas are intended to support water management, reduce seepage, improve water quality, and provide a buffer between the Everglades and developed areas. That planning context is useful for understanding the narrow transition zone visible between the two dominant land-cover blocks.
East of that transition, the county is heavily urbanized. The impervious map shows a dense matrix of streets, rooftops, commercial areas, and residential development extending across the eastern third. Numerous small lakes and canals interrupt the developed pattern, but they do not change the overall impression of a continuous metropolitan landscape. The west, by contrast, contains almost no substantial hard-surface development.
Impervious cover exposes the intensity of the eastern metropolitan landscape
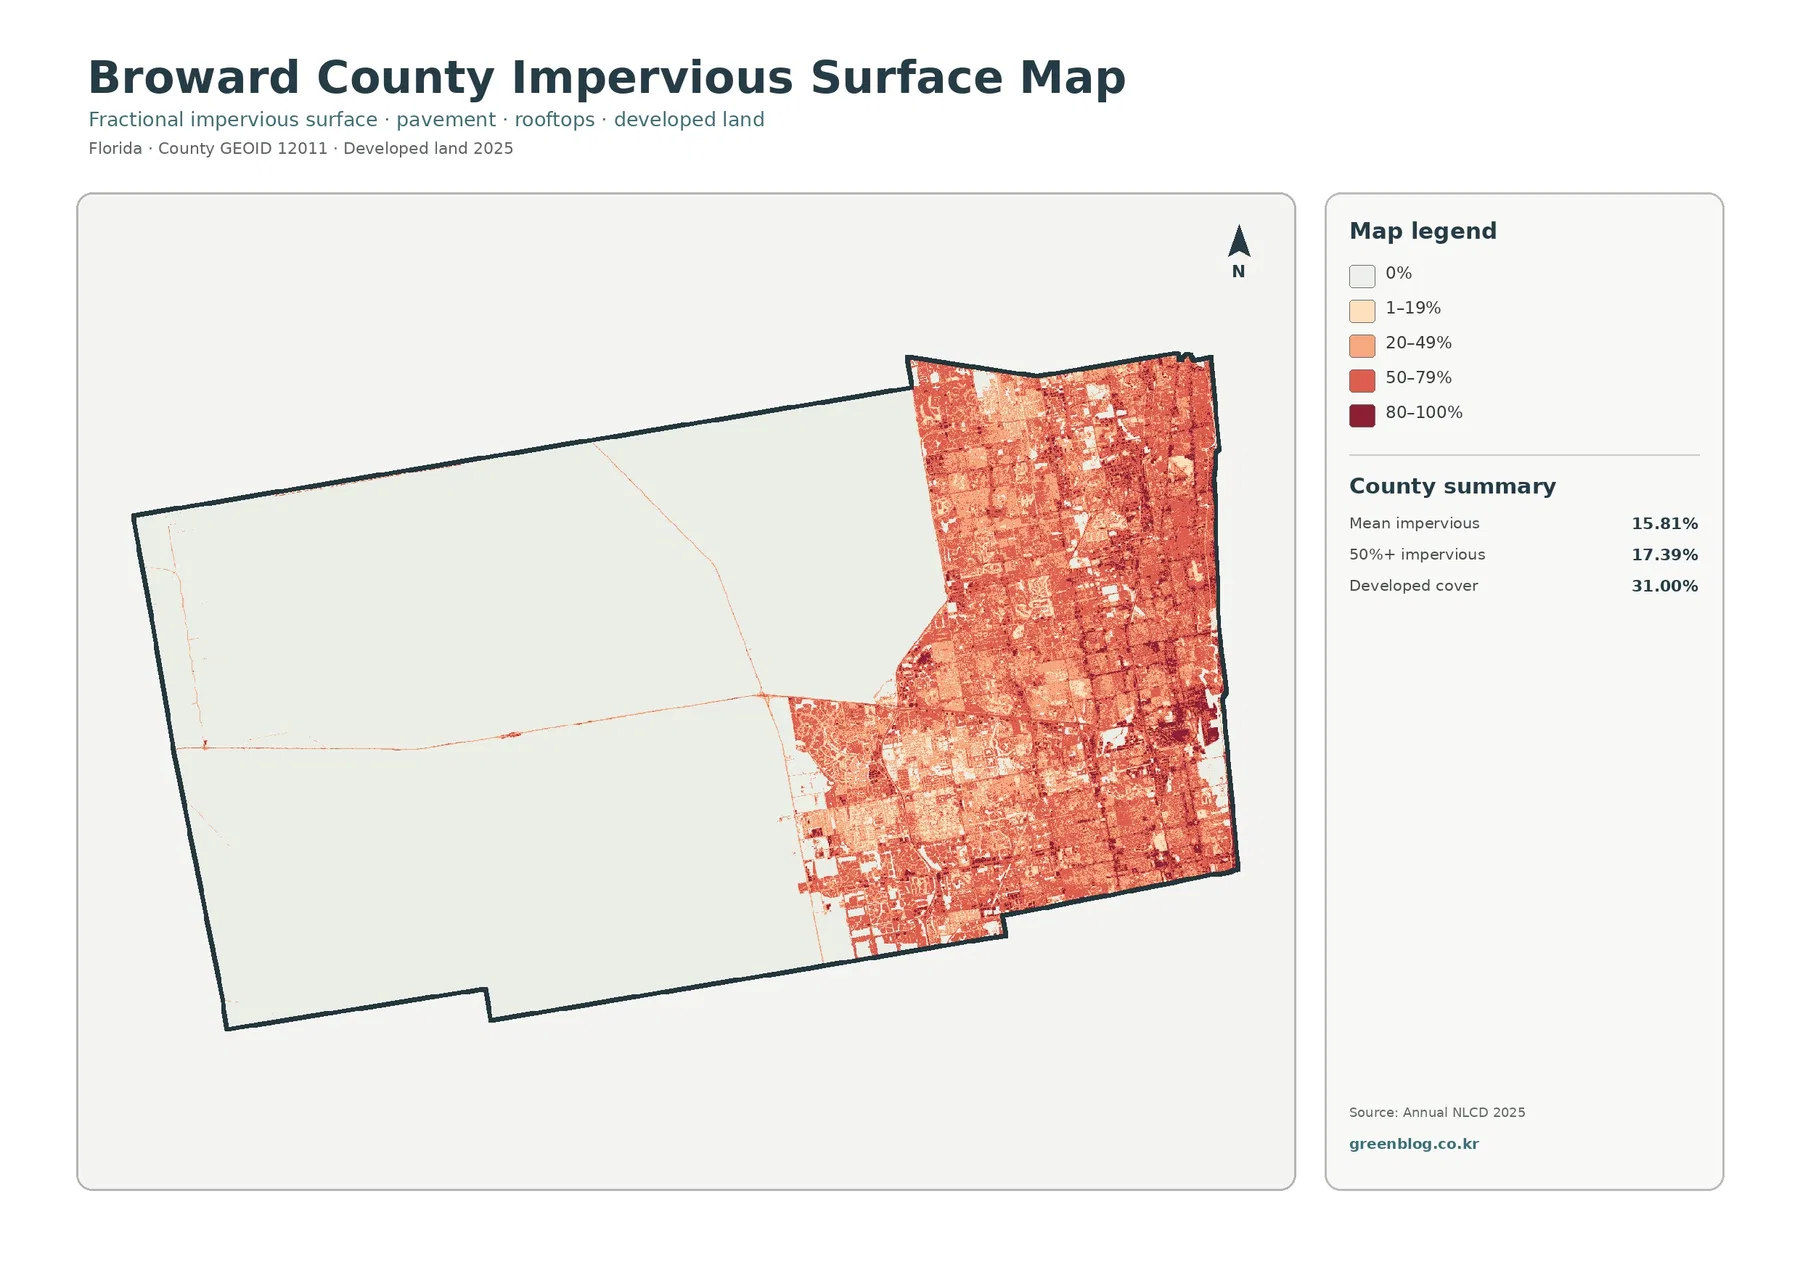
Mean impervious cover is 15.81%, and 17.39% of the county lies in cells with at least 50% impervious surface. Impervious surface means pavement, parking areas, rooftops, and other hard cover where rainfall does not readily soak into the ground. The 15.81% mean is lower than the 31.00% developed-land share because developed classes can include lawns, trees, open water, and other permeable surfaces.
Most of the eastern third is colored with moderate to high impervious values, and the pattern becomes especially dense near the Atlantic side and in the large inland municipalities. A web of lighter and darker blocks reflects different development densities rather than one uniform urban surface. The contrast with western Broward is extreme: once the map crosses into the Water Conservation Areas, hard-surface cover almost disappears.
Broward County’s Environmental Permitting Division regulates stormwater-management systems to provide flood protection and reduce pollutants in runoff. The impervious layer is useful for identifying where hard surfaces are concentrated, but it does not calculate flooding or water-quality effects by itself. Canal operation, rainfall, drainage infrastructure, groundwater, and surface-water levels also shape those outcomes.
Wetlands and developed land account for more than 97% of the 2025 summary
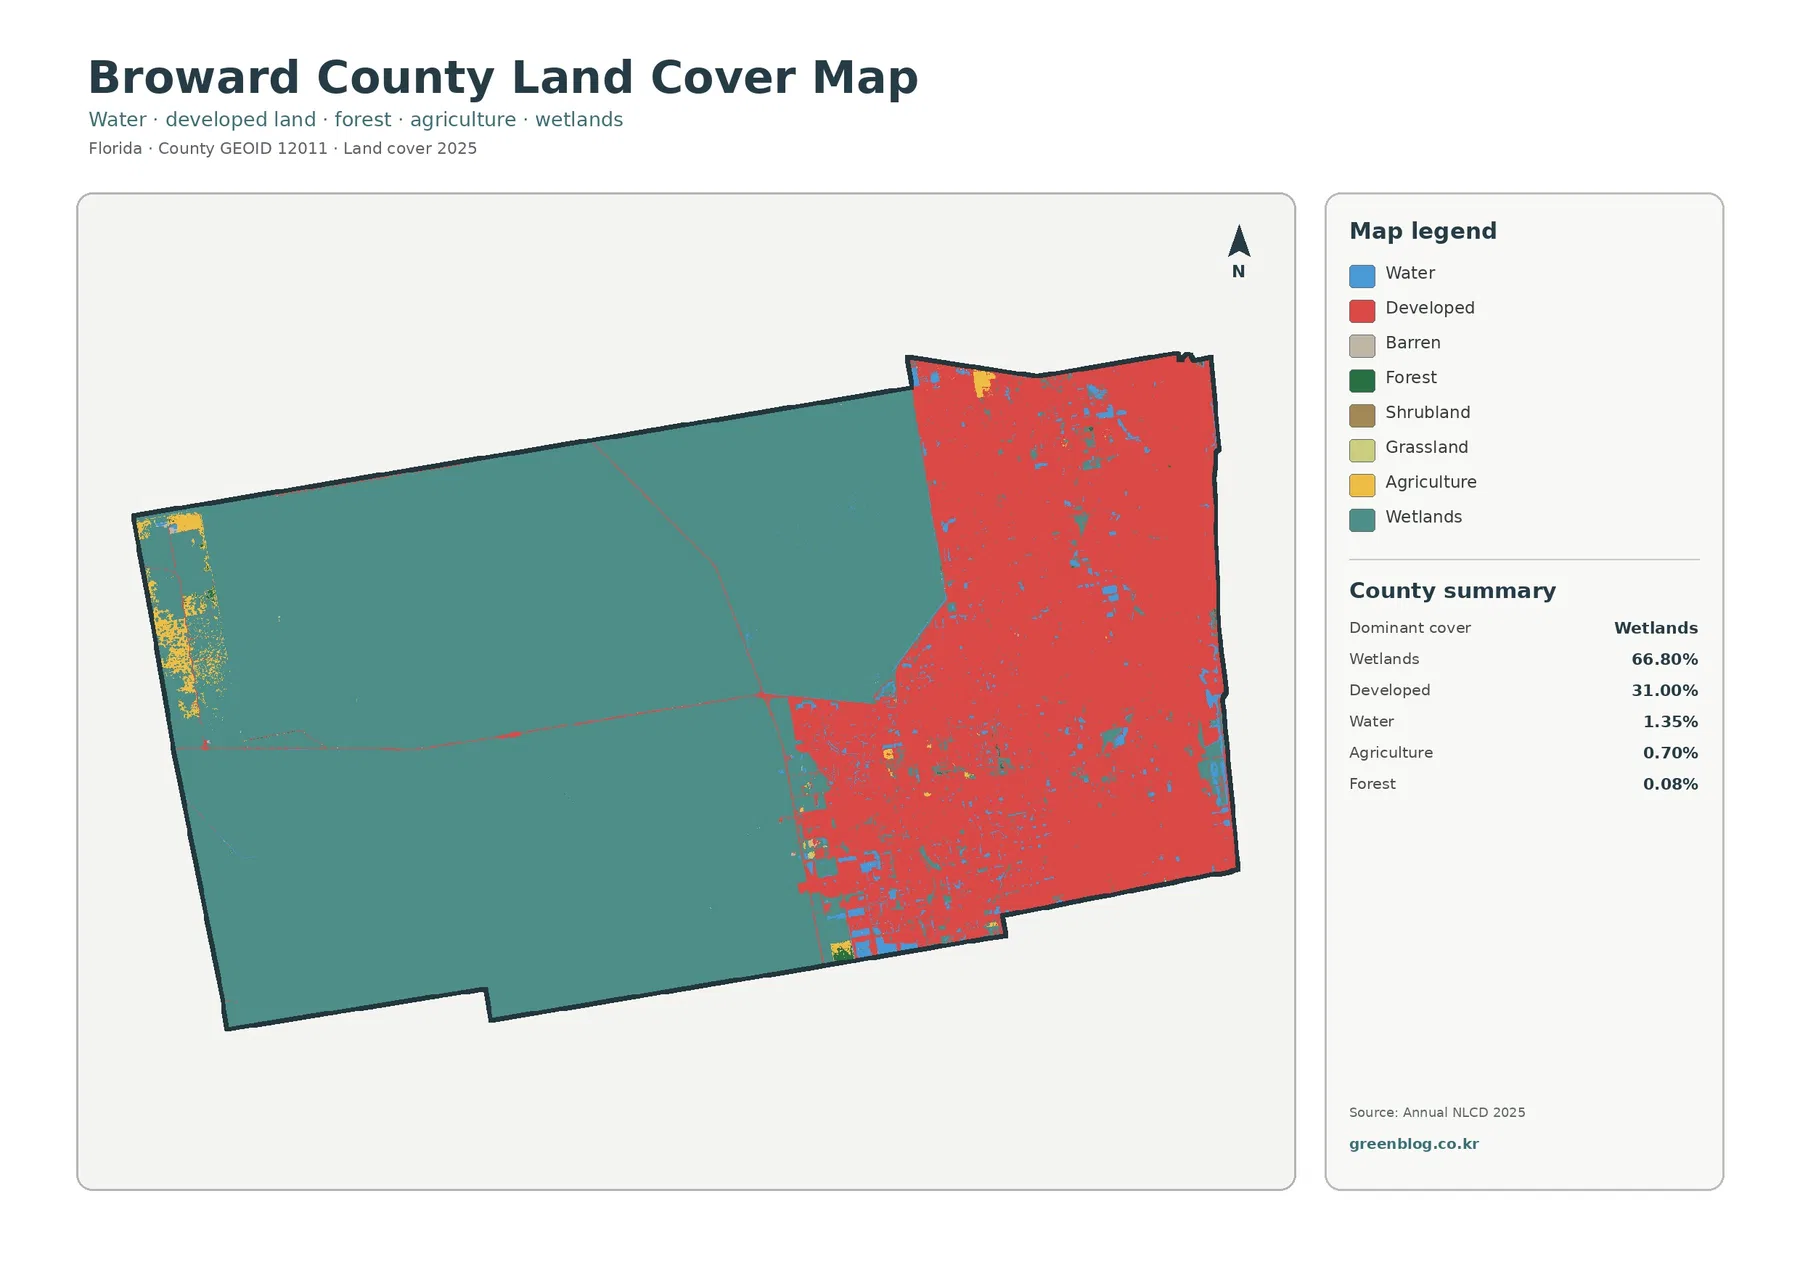
The 2025 summary is unusually concentrated. Wetlands at 66.80% and developed land at 31.00% together exceed 97% of the county. That explains why the general map reads as two large regions rather than a complex mixture of forest, agriculture, grassland, and development. Western Broward is overwhelmingly wetland, while eastern Broward is overwhelmingly developed.
Water is only 1.35% in the county summary. That number can seem surprising in an Everglades county, but wetland and open water are different classes. Shallow, seasonally flooded, or vegetated surfaces can be mapped as wetlands rather than water. In the eastern city area, lakes and canals appear as small blue shapes and lines inside the developed matrix. The western conservation landscape remains predominantly teal because vegetation and wetland conditions dominate the classification.
Agriculture is 0.70% and forest only 0.08%. Both are minor elements rather than defining countywide patterns. Small agricultural patches occur near parts of the western transition and a few isolated locations, while mapped forest is extremely limited. Broward County should therefore not be described using the forest-versus-farmland language that fits many other Florida counties. Its defining comparison is Everglades wetland versus metropolitan development.
The simplified natural-cover view makes the scale of the Everglades side unmistakable
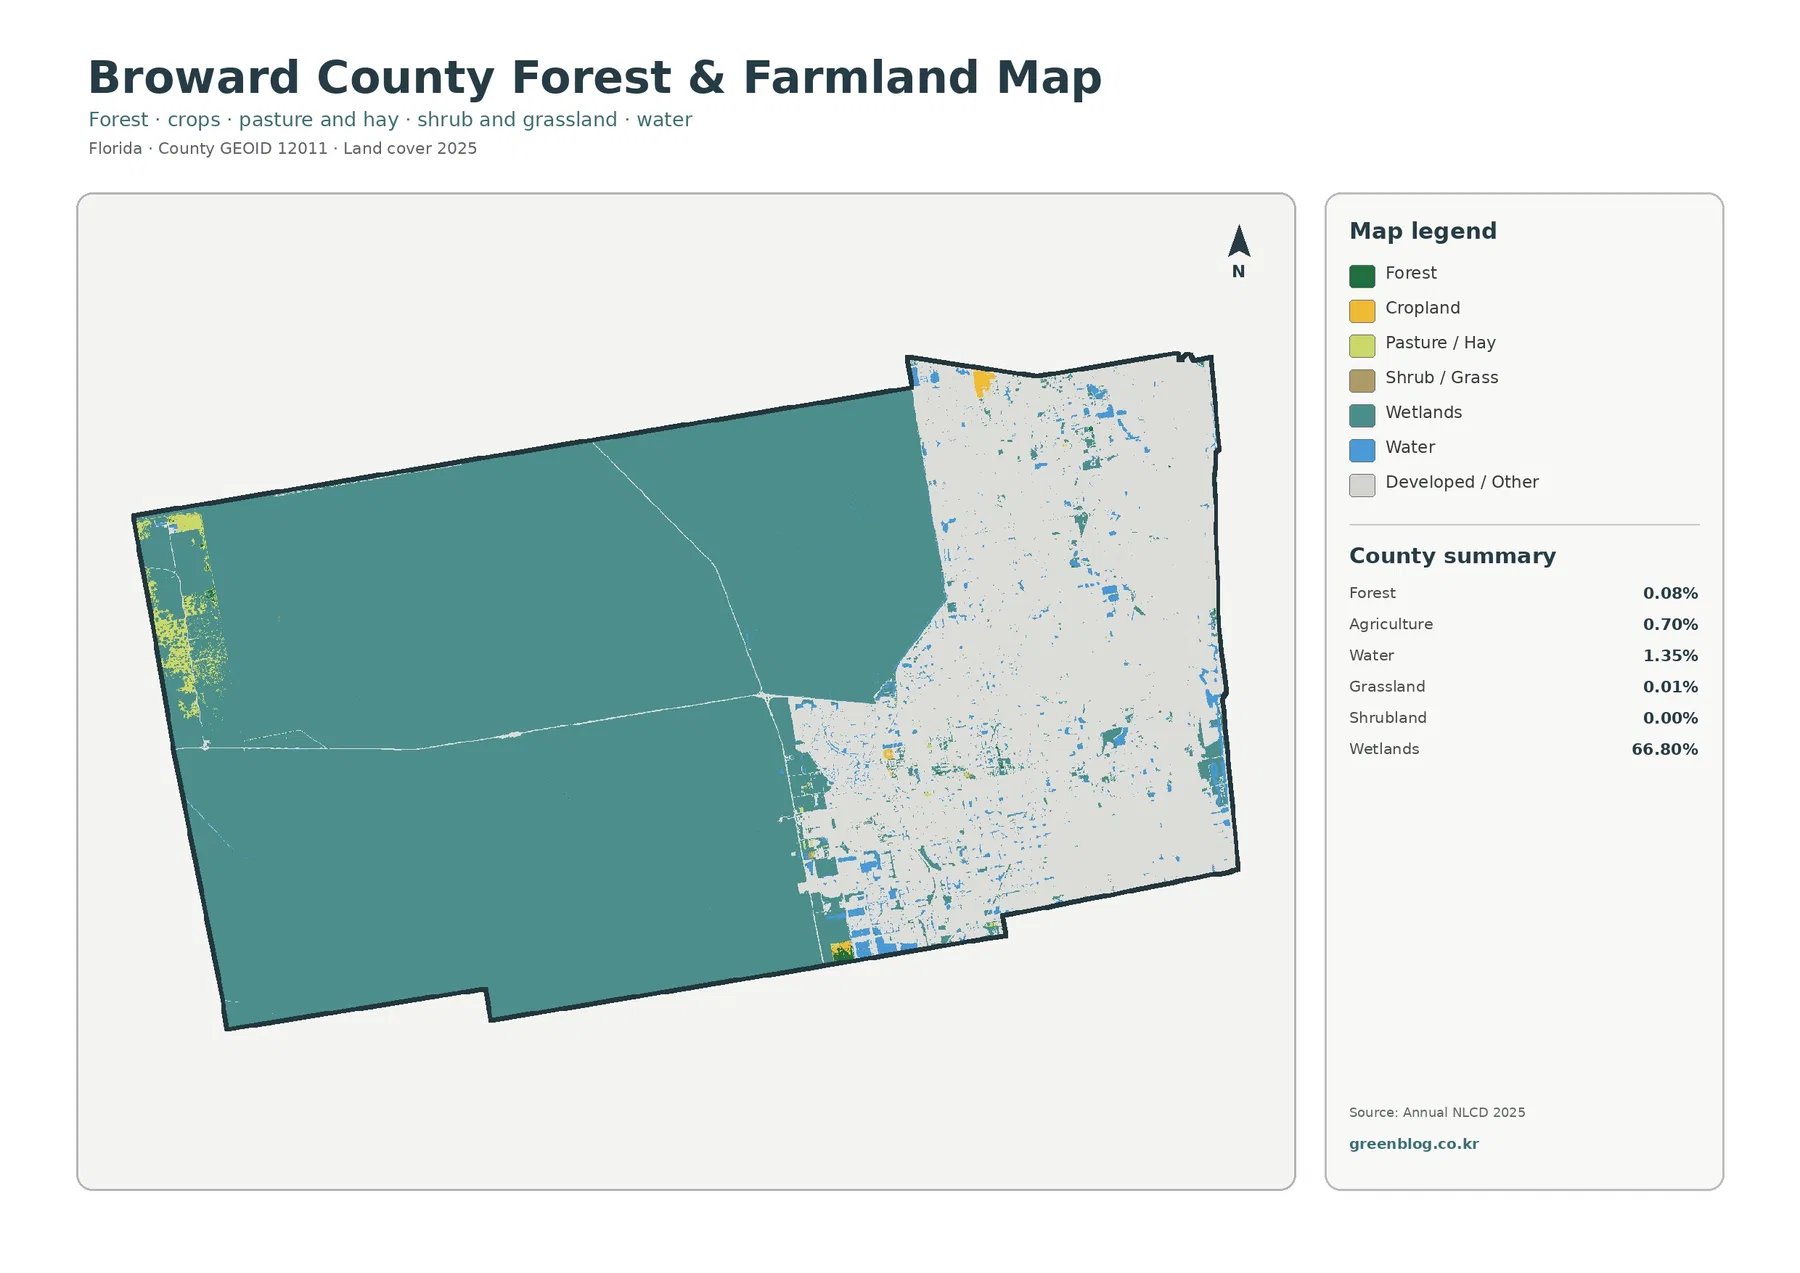
When most developed and miscellaneous surfaces are reduced to a pale background, the western wetland block becomes even more dominant. The map is less useful for locating forest or farmland, because those classes are tiny, and more useful for explaining the county’s conservation geography. A broad wetland system occupies most of the land west of the urban boundary, while the eastern third contains fragmented wetland and water patches inside a metropolitan setting.
Broward County’s Wetlands Program describes wetlands as important for water-quality filtration, flood storage, shoreline protection, aquifer recharge, recreation, and wildlife habitat. The map does not measure those functions, but it shows the extraordinary physical scale of the wetland resource within the county boundary. That makes this view useful for environmental education, Everglades context, and countywide water-resource presentations.
The small agricultural and forest shares are still worth keeping in the legend because they show what the county is not dominated by. Agriculture occupies only 0.70%, and forest 0.08%. Removing those classes entirely would hide small local exceptions, while overemphasizing them would distort the county’s overall pattern. Their best role is as minor context around the much larger wetland and developed categories.
The 1985–2025 layer places most developed change near the metropolitan side
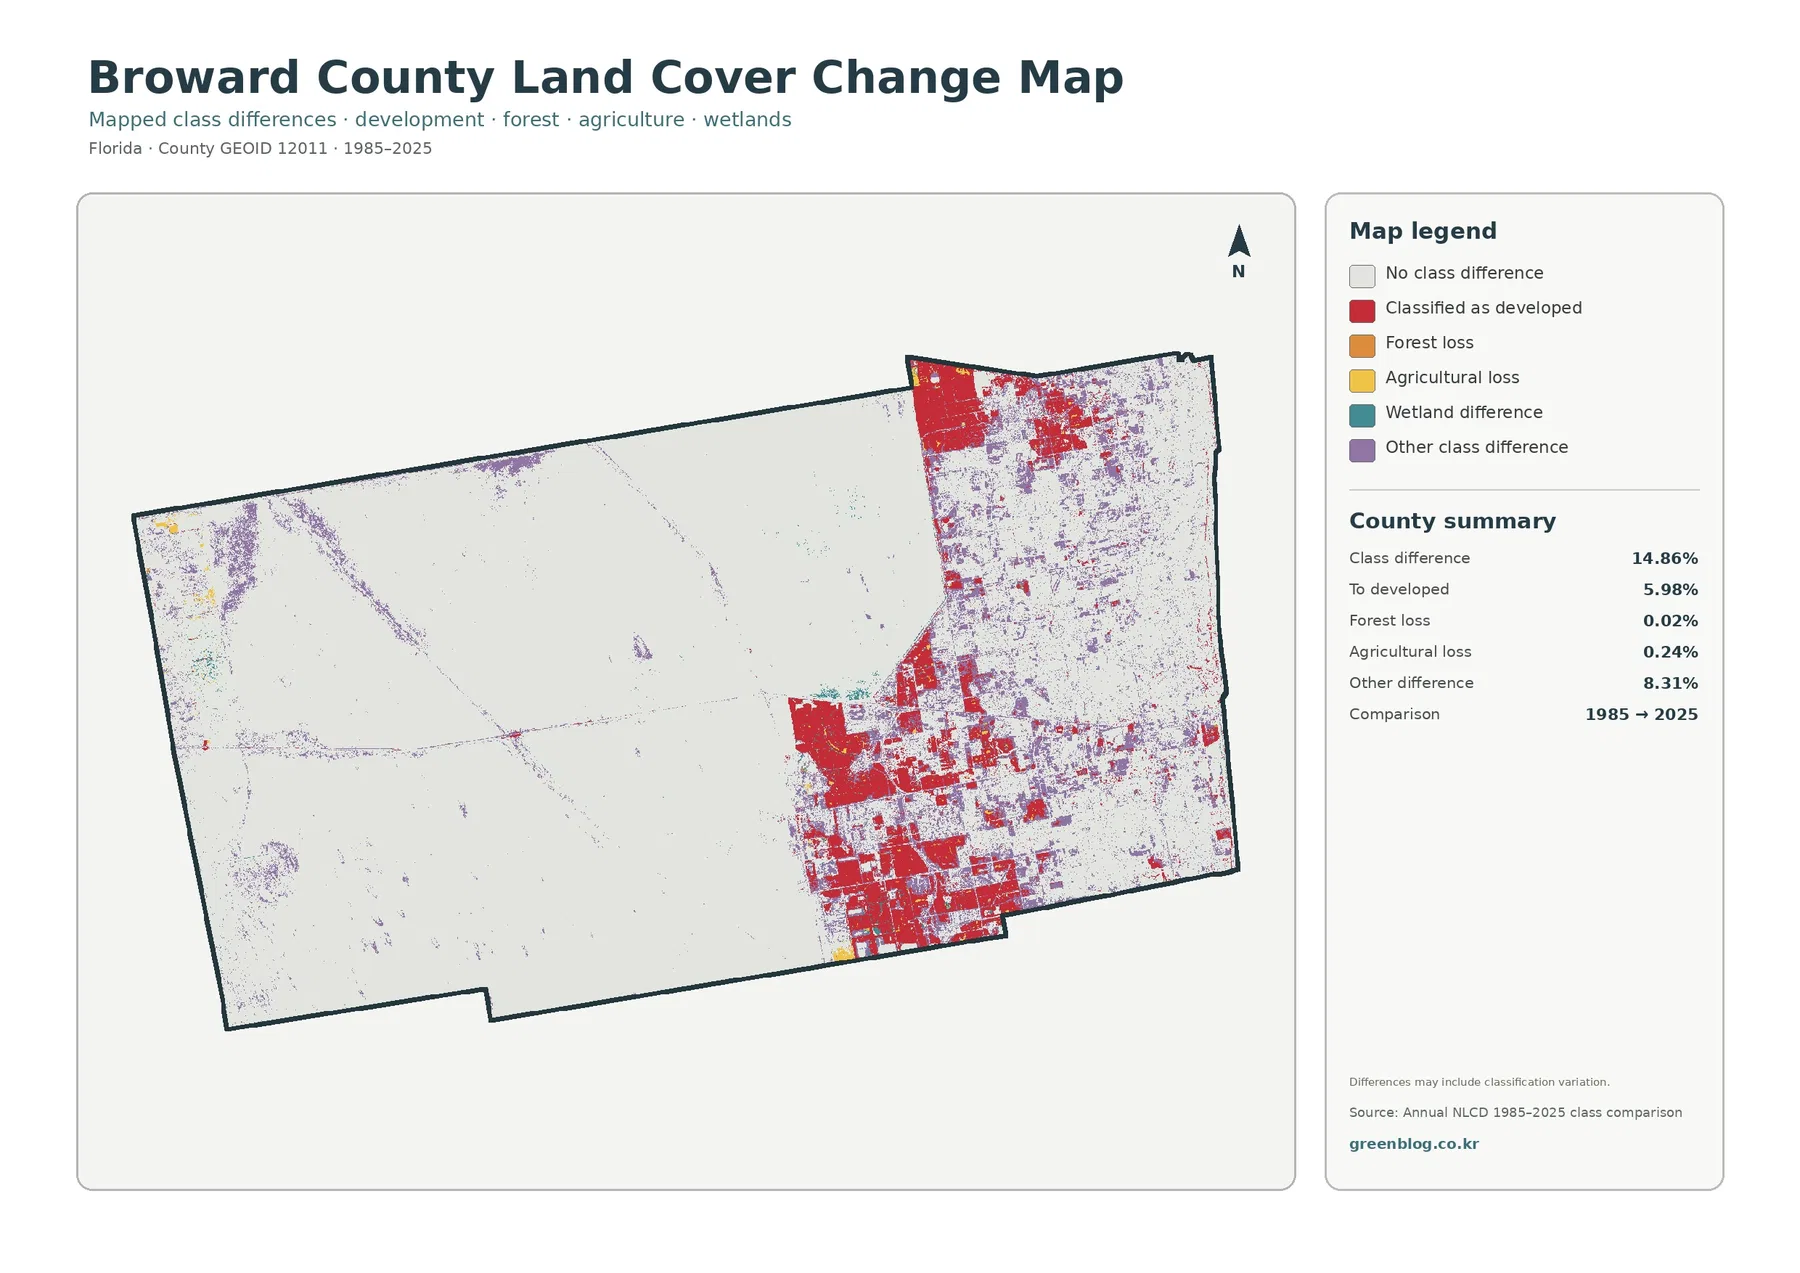
The change map reports a 14.86% class difference between 1985 and 2025. Changes classified as developed in 2025 account for 5.98%, forest loss for 0.02%, agricultural loss for 0.24%, and other class differences for 8.31%. The largest red clusters occur in eastern Broward and along portions of the western edge of the urban area. Much of the central western Water Conservation Area remains comparatively quiet on the change map.
The total 14.86% is not a 14.86% development increase. It includes every cell with a different mapped class between the two dates. The map itself notes that classification variation may be part of the result. Water levels, imagery, wetland vegetation, mixed pixels, and class-boundary differences can affect a comparison in addition to real land conversion.
For an urban-growth discussion, the 5.98% “to developed” category is the more relevant starting point. Even then, it should be treated as a mapped land-cover comparison rather than a construction or permitting record. Historical aerial photographs, parcel records, road projects, and local planning documents are better tools for explaining why a particular location changed.
Water Conservation Areas are managed wetland systems, not simply undeveloped western land
Broward County’s wetland history page explains that large portions of historic Southeast Florida wetlands were drained and converted, while roughly two-thirds of Broward remains within water-conservation areas that are part of the Everglades. County planning documents describe these western areas as important for habitat, water storage, water supply, water quality, and hydrologic connections to the larger Everglades system.
The Water Resource Assessment also describes Water Preserve Areas along the western urban limits. Those projects are intended to expand functional wetlands, reduce seepage from the Water Conservation Areas, improve water supply and water quality, and create a buffer between the Everglades and developed communities. That information adds an important planning dimension to the sharp land-cover boundary seen in all four maps.
None of those management boundaries should be inferred directly from a 30-meter land-cover raster. A wetland-colored cell identifies a mapped surface class, not a legal conservation boundary or permit condition. For project-level work, Broward County’s wetland, planning, water-resource, or GIS layers should be consulted after the broad pattern has been identified here.
Use the four maps to separate countywide cover, urban intensity, and long-term change
The general land-cover map is the best opening image because it immediately communicates the 66.80% wetland versus 31.00% developed split. The impervious map is more useful when the question is urban density and hard-surface concentration. The simplified natural-cover view puts the scale of western wetlands in the foreground, and the change map should come last when the goal is to compare 1985 with the 2025 pattern.
The asset manifest records each original JPG at 2480 by 1754 pixels. The package does not mark those dimensions as meeting its A3 high-resolution reference, so large-format printing should be tested before final production. For reports and presentations, preserve the aspect ratio and keep the legend and County summary visible because those elements contain the exact class definitions and percentages needed to interpret the image.
Thirty-meter cells and countywide percentages define the proper scale of interpretation
Annual NLCD is designed for consistent large-area land-cover comparison and commonly uses a Landsat-based 30-meter grid. One cell may contain wetland vegetation, shallow water, pavement, lawn, and trees at the same time. The land-cover product assigns a representative class, while the impervious product estimates hard-surface percentage. Enlarging the exported image cannot create parcel-level precision that was absent from the source raster.
The general land-cover, forest/farmland, and impervious views describe 2025 conditions. The change layer compares 1985 with 2025. Development, restoration, canal work, water-level changes, or other conditions after that observation period may not appear. Current project work should therefore pair these maps with recent aerial imagery and Broward County’s current environmental or planning information.
Every percentage shown here is countywide. Wetlands at 66.80%, developed land at 31.00%, and mean impervious cover at 15.81% are not separate values for Fort Lauderdale, Hollywood, Pembroke Pines, Coral Springs, or any Water Conservation Area. Municipal, watershed, conservation-area, or parcel statistics require the original raster to be recalculated with the correct boundary.
Frequently Asked Questions
What is the largest land-cover class in Broward County in 2025?
Wetlands are the largest class at 66.80%, followed by developed land at 31.00%. Together they account for more than 97% of the county.
Which map best shows the intensity of eastern Broward development?
The impervious-surface map is the clearest view. Broward County averages 15.81% impervious cover, and 17.39% of the county lies in cells that are at least 50% impervious. Exact municipal boundaries require separate GIS data.
Does the 14.86% 1985–2025 class difference mean that 14.86% of Broward County was developed?
No. It includes all mapped class differences between the two dates. The map identifies 5.98% as changes classified as developed in 2025, and some differences may include classification variation.
Sources and reference material
- MRLC Annual NLCD Data – source land-cover and impervious data
- USGS Annual NLCD Land Cover Classification – class definitions and interpretation
- U.S. Census Bureau TIGER/Line Shapefiles – county-boundary reference
- Broward County Wetlands Program – Everglades wetlands, wetland functions, and conservation context
- Broward County Water Resource Assessment – Water Preserve Areas and Everglades restoration context
- Broward County Natural Resources Division – water, coastal, and environmental-management programs
Map File Information
Download the four original JPG maps in one ZIP: 2025 land cover, forest and farmland, impervious/developed land, and the 1985–2025 land-cover change comparison.
- Included Files: 4 JPG maps
Related Maps
- Alachua County Florida Land Cover Map
- Baker County Florida Land Cover Map
- Bay County Florida Land Cover Map
Green Map creates custom-edited map images using open geographic data sources such as geoBoundaries, Natural Earth, OpenStreetMap, and government open data.
These maps are edited visual materials, not raw data files, and are provided for education, documents, presentations, and graphic reference.