Kent County, Delaware is dominated by two land-cover settings that are easy to see in the 2025 maps: agriculture and wetlands. Agriculture accounts for 42.23% of the county summary, while wetlands account for 30.85%. Developed land is 18.57%, forest is 5.74%, and water is 2.12%. The result is a county where broad farm areas, extensive wetland cover, and concentrated developed centers all appear within the same boundary rather than one landscape type covering everything.
This page provides four views of Kent County: general land cover, forest and farmland, impervious surface and developed land, and mapped class differences from 1985 to 2025. The four original JPG maps are also available together in one ZIP download for reports, classes, presentations, and offline reference. Land cover describes what is physically covering the ground at the observation date; it should not be confused with zoning, property ownership, legal land use, or permission to develop a parcel.
Table of Contents
A county shaped by farmland, wetlands, and focused development
Kent County occupies central Delaware and includes Dover, the state capital and the county seat. Kent County’s official website lists 17 towns and three cities, including Dover and Harrington, and notes that Milford is shared with Sussex County. Those municipal names do not appear on the supplied land-cover maps, so the colored cells should not be treated as municipal statistics. They do, however, provide useful geographic context for the prominent developed cluster in the center of the county and the smaller developed concentrations elsewhere.
The countywide percentages immediately separate Kent County from a heavily forested county or a predominantly urban one. Farmland is the largest mapped cover, and wetlands form another major component, especially across the eastern side and around water-connected lowlands. Developed areas are much more concentrated. Forest occurs in smaller patches among fields, wetlands, and settled areas rather than as one extensive block. Reading those contrasts first makes the individual map panels easier to interpret.
Local planning documents reinforce the importance of both agriculture and natural resources without turning this land-cover map into a regulatory map. Kent County’s comprehensive planning materials address farmland preservation, wetlands, floodplains, conservation, and managed growth as separate planning topics. Delaware DNREC also identifies wetlands as a major natural feature of the state and notes that a substantial share of Delaware’s wetlands is in Kent County. Those sources help explain the regional setting, but they do not mean every wetland-colored cell is a legally delineated wetland or every agricultural cell is protected farmland.
What stands out on the 2025 land cover map
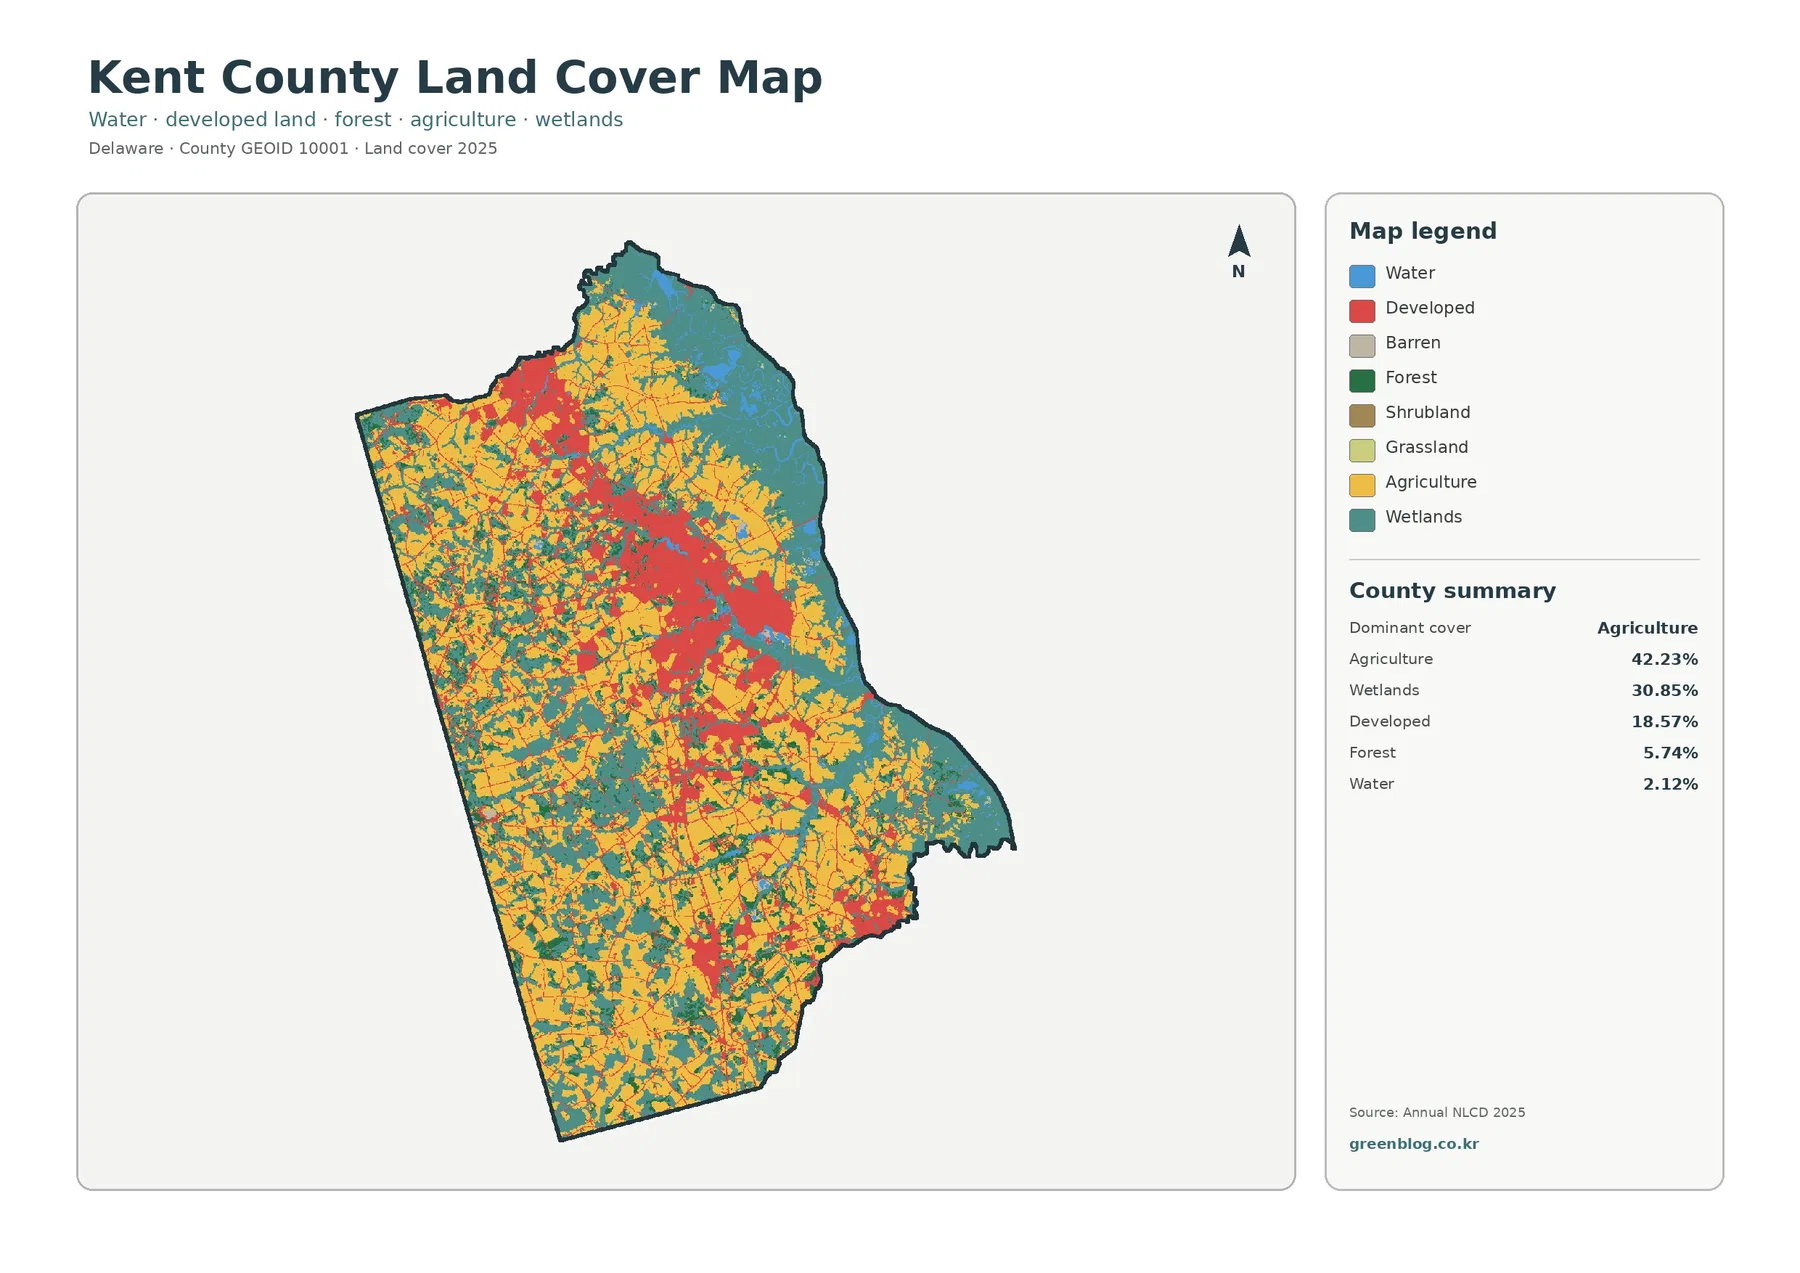
The general land-cover map is the best place to understand the county as a whole. Yellow agricultural areas spread across much of the interior, while teal wetland cover becomes especially extensive on the eastern side and appears in many smaller patches elsewhere. Red developed land creates a pronounced central concentration and several additional clusters toward the northwest and southeast. Forest is present throughout the county, but it appears mainly as smaller green pieces interspersed with farmland and wetlands.
That pattern matters because the 18.57% developed category is broader than pavement and rooftops. Developed NLCD classes can include lawns, trees, soil, and other pervious surfaces within built environments. A suburban neighborhood may therefore be mapped as developed even though much of its surface still absorbs water. The separate impervious-surface view later on the page narrows the question to hard surfaces and helps distinguish developed landscape from the actual density of pavement and buildings.
The large wetland share deserves similar care. Wetland cover in a national land-cover classification is not a substitute for a regulatory wetland delineation. It is useful for seeing broad patterns, comparing parts of the county, and identifying places that may deserve closer examination. A permit, property transaction, drainage project, or site design requires more detailed wetland information from the appropriate state and federal sources. The map should be treated as regional reference rather than a parcel decision tool.
Farmland is broad, while forest remains fragmented
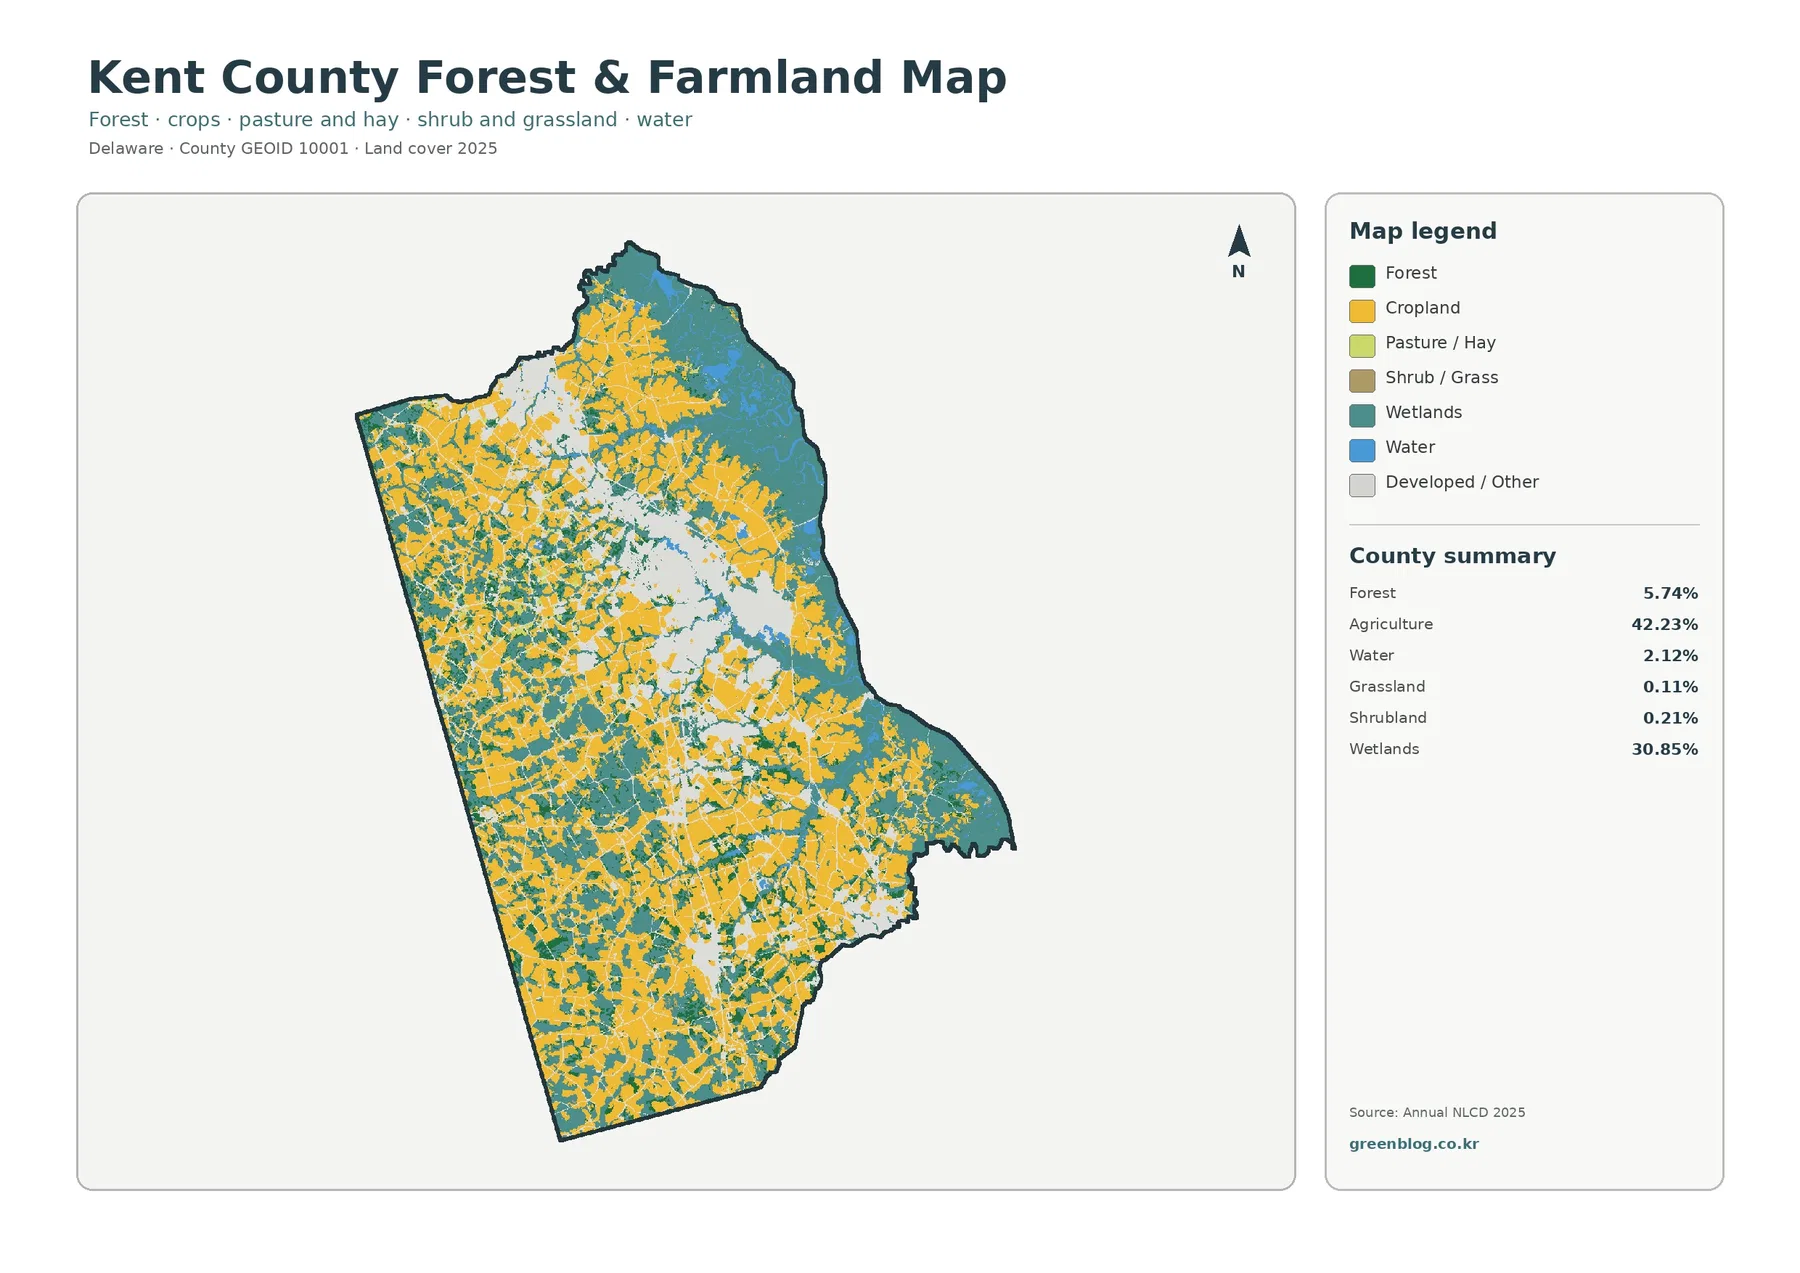
The forest-and-farmland map removes much of the visual competition from developed classes and makes the agricultural pattern much easier to follow. Agriculture still covers 42.23% of the county, extending through large portions of the west, center, and south. Wetlands at 30.85% create a very different texture, especially toward the east. Forest is 5.74%, while water is 2.12%. Grassland and shrubland are minor classes in the summary, at 0.11% and 0.21% respectively.
Instead of appearing as isolated farms, agricultural cover forms a repeated countywide pattern. Fields are interrupted by wetlands, streams, developed places, and smaller forest patches, yet they remain the largest single mapped category. That broad footprint makes the map useful for agricultural education, rural landscape presentations, and comparisons with county planning material about farmland preservation. It does not identify farm ownership, crop type, enrolled preservation districts, or agricultural easements; those questions require separate records.
Forest tells a different story. The 5.74% share is small compared with agriculture and wetlands, and the green areas are visibly broken into many pieces rather than one continuous forest block. Some patches border wetlands and fields, while others sit between developed areas. The map can help locate those broad forest patterns, but it cannot establish habitat quality or ecological priority on its own. A small forest patch may be important locally even though it contributes little to the countywide percentage.
Impervious cover highlights the built-up centers
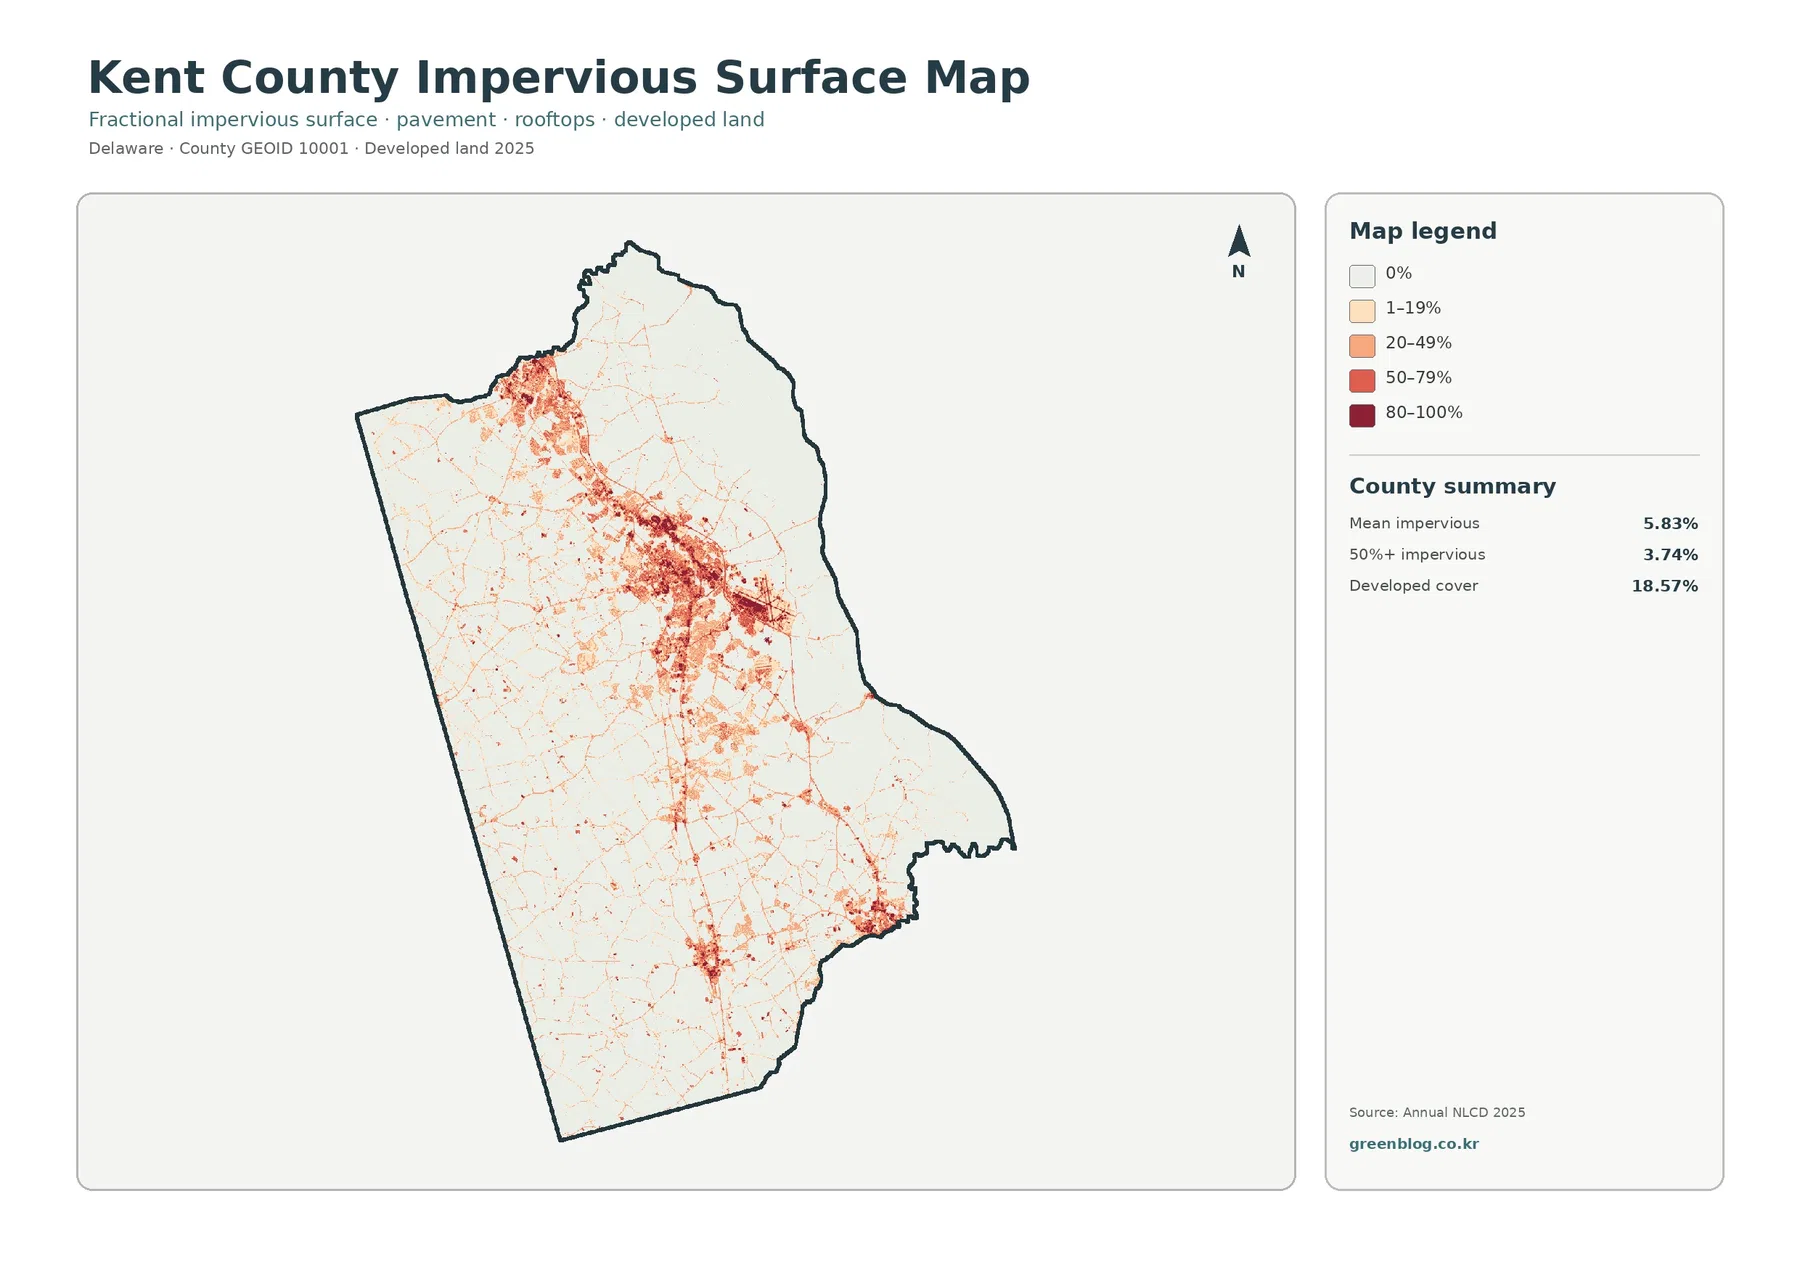
Impervious surface means ground covered by materials such as pavement and rooftops that do not readily absorb rainfall. Kent County’s mean impervious value is 5.83%, and 3.74% of the mapped county is in areas with at least 50% impervious cover. Those values are far below the 18.57% developed-land share because developed classes can contain many pervious surfaces. The difference is useful when a reader wants to separate general settlement patterns from the locations with the densest hard surface.
The strongest impervious concentration lies in the central part of the map, with a corridor-like extension and several adjacent clusters. Smaller concentrations appear toward the northwest and near the southeastern edge. Because the supplied image has no municipal boundary overlay, these shapes should not be converted directly into city statistics. The central concentration is consistent with the Dover area, but a precise Dover-only value would require clipping the raster to an official municipal boundary.
Kent County also publishes a separate Growth Zone layer through its planning GIS. The county describes that overlay as a way to direct growth toward areas with public sewer and other infrastructure. That planning layer and the impervious map answer different questions. One describes a planning policy area; the other describes the physical surface mapped in 2025. Comparing them can be informative, but the current land-cover map should never be used as a replacement for zoning or growth-zone information.
Mapped differences from 1985 to 2025
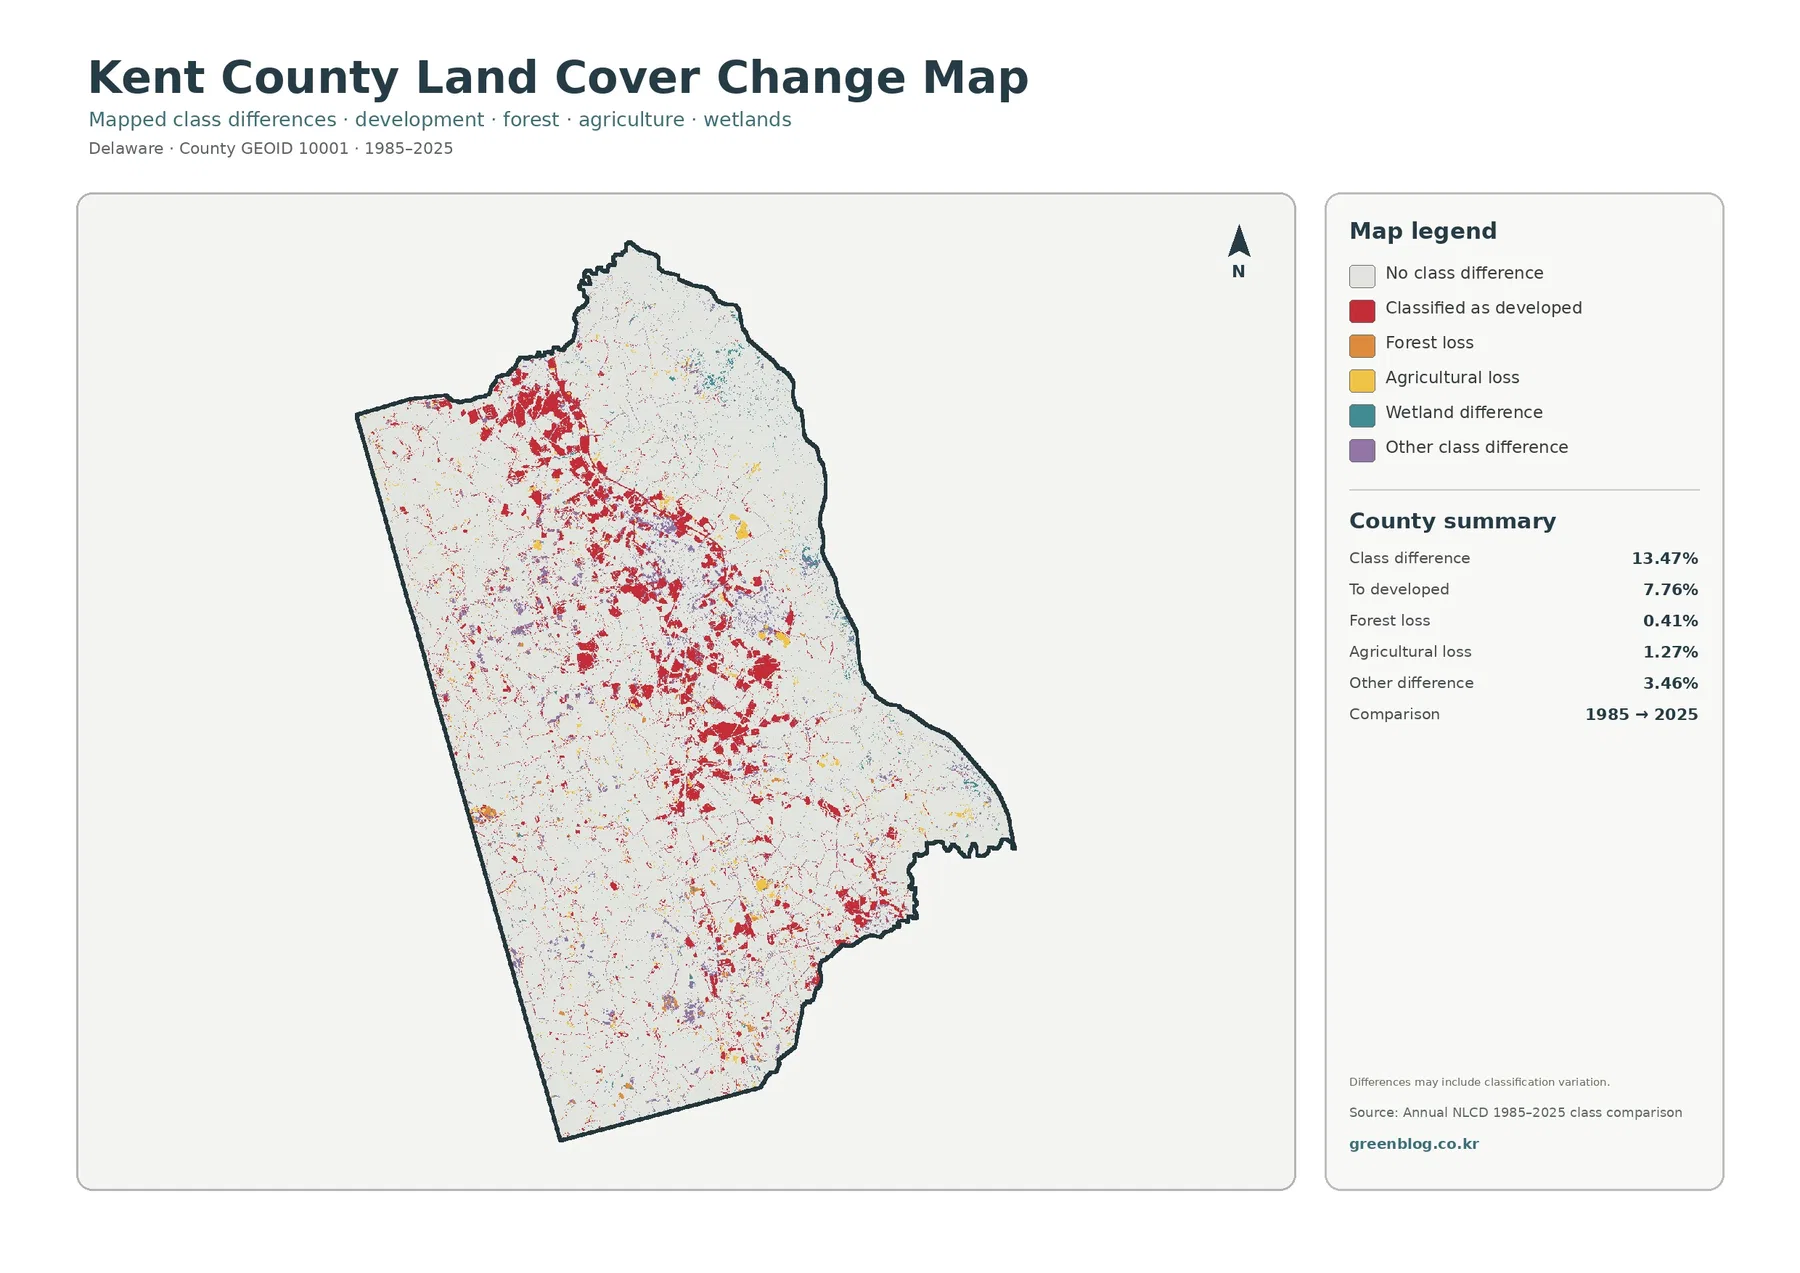
The change view compares mapped classes in 1985 and 2025 rather than showing a single-year condition. The summary reports a 13.47% class difference across the county. Areas classified as developed in 2025 account for 7.76% of the change summary, agricultural loss is 1.27%, forest loss is 0.41%, and other differences are 3.46%. Red change cells are especially noticeable across the central and northwestern parts of the county, with additional clusters in the south and southeast.
Those percentages need a careful label. A 13.47% class difference is not the same thing as saying that 13.47% of Kent County was newly developed. The map compares classifications from two dates, and the graphic itself warns that differences may include classification variation. Sensor characteristics, mixed pixels, edge placement, and classification methods can all create differences in addition to real land-cover change. Actual development history should be checked against aerial imagery, subdivision records, permits, and local planning sources.
The map is still valuable as a screening tool. Large red clusters show where a reader might begin investigating places that are classified as developed in 2025 but were another class in 1985. Yellow agricultural-loss cells and orange forest-loss cells identify different types of mapped change, while wetland differences are shown separately in the legend. The summary does not provide a standalone percentage for wetland differences, so a precise wetland-change figure should not be invented from visual inspection.
How the four views work together
Each map becomes more useful when it is read beside the others. The general land-cover map establishes the dominant countywide pattern: large agricultural and wetland areas with focused development. The forest-and-farmland view makes rural and natural cover easier to compare. Impervious surface narrows the developed category to the density of hard surfaces, and the change map adds a time comparison. This sequence prevents a common mistake of treating the red developed class as if every developed cell were fully paved.
The contrast between western and eastern portions of the county is also clearer in combination. Agricultural cover is widespread across the interior and west, while wetlands occupy much larger continuous areas toward the east. Development is concentrated in a few obvious centers rather than spread evenly across the county. These are spatial associations, not proof of cause. The maps do not establish that roads caused growth, that wetlands prevented farming, or that a particular policy produced a specific change unless separate evidence supports that conclusion.
DNREC’s wetland information adds useful context because it describes wetlands as a major Delaware habitat found along shores, rivers, streams, ponds, forests, and fields. The agency also reports that Kent County contains a substantial portion of the state’s wetlands. That statewide statement uses a different denominator from the 30.85% county land-cover share shown here, so the two percentages should not be merged. One describes where Delaware wetlands are distributed among counties; the other describes how much of this mapped county falls into wetland classes.
Using the JPG maps in reports, classes, and local comparisons
For a general county introduction, start with the full land-cover map because its legend preserves all major categories and the summary provides the key percentages. An agriculture or conservation lesson can follow with the forest-and-farmland view, while a stormwater or urban-development discussion benefits from the impervious map. The change map works best after the current-condition maps because readers can first see what exists in 2025 and then examine where the 1985 classification differs.
The original JPG files in the download are 2480 by 1754 pixels according to the supplied asset manifest. The package does not mark them as meeting its A3 high-resolution reference, so very large printing should be tested before use. In ordinary documents and slide presentations, retaining the original aspect ratio and keeping the legend visible is more important than enlarging the map until labels become soft. Cropping away the county summary can also remove important context for the percentages.
Always attach the correct date to quoted values. The general land-cover, forest-and-farmland, and impervious maps describe 2025, while the change product compares 1985 with 2025. If a presentation is updated later, the map date should remain visible so the audience does not assume it represents conditions after 2025. The same caution applies to development: the change categories are land-cover classifications, not a substitute for annual permit totals or parcel-level construction records.
Limits of the 30-meter classification
Annual NLCD is designed for consistent land-cover analysis across large areas, not parcel surveying. Its Landsat-based 30-meter grid means a single cell can contain several real-world surfaces at once. A narrow road, tree line, yard, ditch, and field edge may fall into the same cell and be represented by one dominant class or an impervious percentage. Zooming farther into the image does not create parcel-scale precision that was not present in the source raster.
Changes after the 2025 observation period may also be absent. New construction, field conversion, wetland restoration, road work, or vegetation changes should be checked against newer aerial imagery and local records when current conditions matter. For legal or financial decisions, use authoritative zoning, parcel, wetland, floodplain, and permitting data instead of treating the land-cover map as a final determination.
Countywide percentages should remain countywide. The supplied maps do not provide separate values for Dover, Harrington, Milford, Smyrna, or other municipalities. A city-level percentage requires a separate analysis using an official city boundary and the source raster. Keeping that distinction clear is especially important when the central developed cluster looks visually dominant, because the county summary still includes broad agricultural and wetland areas outside that cluster.
Frequently Asked Questions
What is the largest land-cover class in Kent County in 2025?
Agriculture is the largest class in the supplied 2025 summary at 42.23%, followed by wetlands at 30.85%. Developed land is 18.57%, forest is 5.74%, and water is 2.12%.
Why is developed land 18.57% while mean impervious cover is only 5.83%?
Developed land can include lawns, trees, soil, and other pervious surfaces within built areas. Impervious cover measures hard surfaces such as pavement and rooftops separately, so its countywide mean can be much lower than the developed-class share.
Does the 13.47% class difference mean Kent County grew by 13.47% from 1985 to 2025?
No. It is the share of mapped cells with a different class between the two dates. The summary identifies 7.76% as changes classified as developed in 2025, and some differences may reflect classification variation rather than a documented land-use event.
Sources and reference material
- MRLC Annual NLCD Data – land-cover and impervious-surface data reference
- USGS Annual NLCD Land Cover Classification – class definitions and interpretation
- U.S. Census Bureau TIGER/Line Shapefiles – county boundary reference
- Kent County Comprehensive Plan – local context for agriculture, conservation, and growth planning
- Delaware DNREC Habitat Condition – statewide and Kent County wetland context
Map File Information
Download the four original JPG maps in one ZIP: 2025 land cover, forest and farmland, impervious/developed land, and the 1985–2025 land-cover change map.
- Included Files: 4 JPG maps
Related Maps
Green Map creates custom-edited map images using open geographic data sources such as geoBoundaries, Natural Earth, OpenStreetMap, and government open data.
These maps are edited visual materials, not raw data files, and are provided for education, documents, presentations, and graphic reference.