Weld County has a broader mix of open land, farming, river corridors, and urban development than a single countywide percentage can suggest. The 2025 summary is led by grassland at 65.26%, followed by agriculture at 24.51%, developed cover at 6.76%, wetlands at 1.44%, and shrubland at 1.06%. The strongest visual contrast is between the open north and east and the denser farm-and-development pattern in the western and southwestern part of the county.
This page brings together four views of the same county: current land cover, forest and farmland, impervious surface and developed land, and a 1985–2025 class-change comparison. The four original JPG maps are available in one download, so you can keep the complete set for county comparison, classroom work, presentations, or closer review of agriculture, settlement, and river-related cover.
Table of Contents
From open northeastern plains to a much denser western landscape
The current land-cover map is dominated by a pale grassland color across the northern and eastern portions of Weld County. Grassland accounts for 65.26% of the county, making it by far the largest single class. Agricultural blocks interrupt that open cover in many places, but the pattern becomes substantially more complicated toward the west. There, crop fields, developed areas, water, and wetlands appear much closer together.
Weld County’s own geographic overview describes the eastern land surface as fairly level and notes rolling prairie and low hills closer to the western border. The land-cover map does not measure elevation, so those physical descriptions should not be read directly from its colors. Still, the official geographic context helps explain why it is useful to treat the county as a collection of different landscape settings rather than as one uniform block of plains.
Agriculture is the second-largest mapped class at 24.51%. It appears as many rectangular or angular patches, with a noticeably greater concentration in the western half and in portions of the south. The northern and eastern sections still contain cultivated areas, but grassland remains much more continuous there. This arrangement makes the county a useful example of how a large agricultural region can still have grassland as its dominant land-cover category.
Developed cover reaches 6.76%, and its distribution is highly uneven. The largest red cluster sits in west-central Weld County around Greeley, with additional concentrations extending through the southwest. County information identifies Greeley as the county seat and principal city and notes that much of the population is concentrated within roughly 20 to 30 miles of it, while the northeastern part of the county is sparsely populated. That official description matches the broad contrast visible in the developed-cover pattern without requiring the map to serve as a population map.
Impervious surfaces reveal how concentrated the urban footprint really is
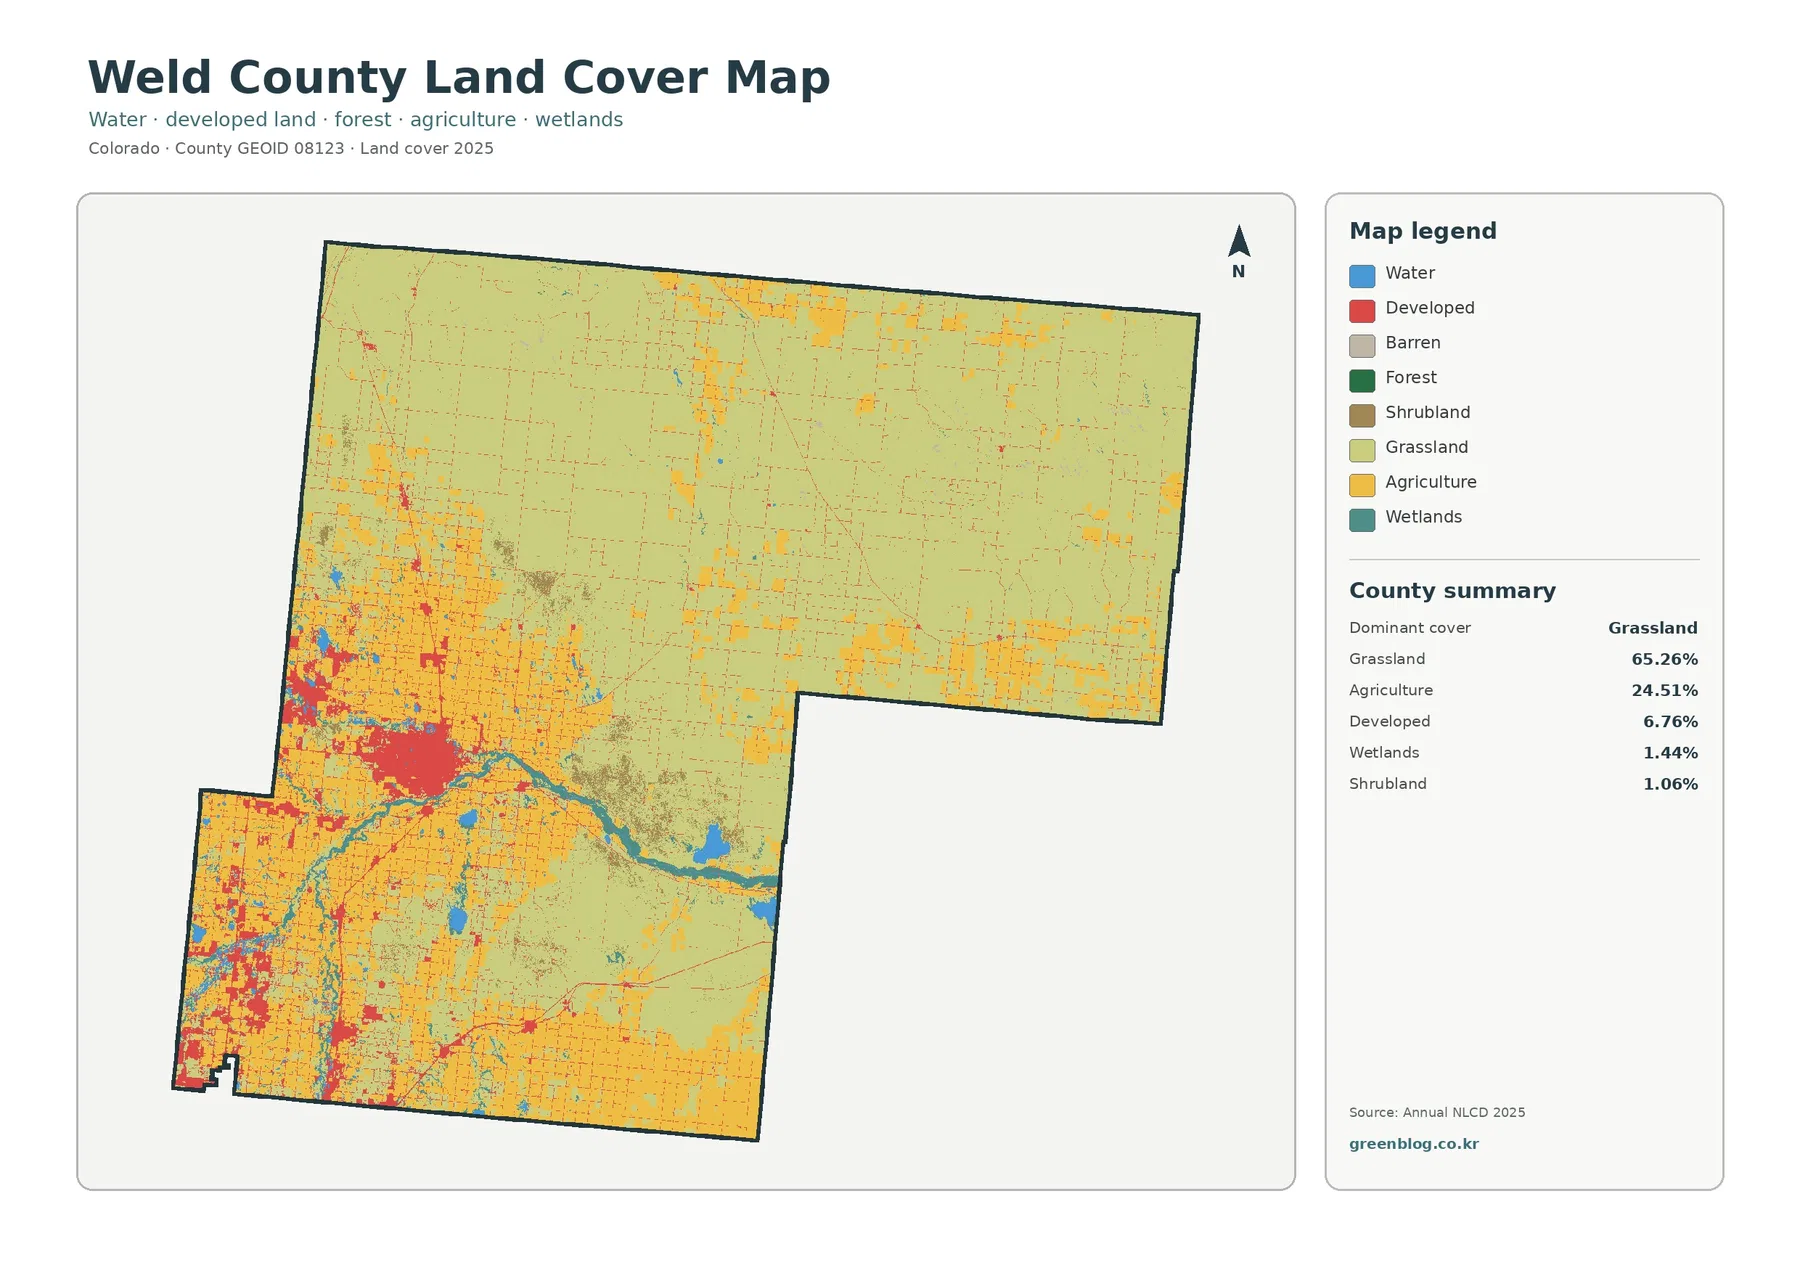
Impervious surface means pavement, rooftops, parking areas, and other hard surfaces that prevent most water from soaking directly into the ground. Weld County’s mean impervious value is 1.91%, and 1.23% of the county is mapped at 50% or greater imperviousness. Those numbers are much lower than the 6.76% developed-cover share because developed land can include lawns, trees, open soil, and other surfaces that remain partly permeable.
The impervious map makes Greeley’s west-central concentration immediately visible. Darker orange and red cells form the largest compact cluster there, while additional developed concentrations appear to the south and southwest. In contrast, most of the north and east is nearly white, indicating little hard-surface cover at county scale. This is one of the clearest maps in the set for showing the sharp difference between the urbanized west and the open northeastern plains.
Thin lines and small dots extend beyond the main clusters. Some resemble road corridors or scattered development, but the image alone does not identify a road name or confirm the function of an individual feature. Weld County GIS provides official mapping resources for that kind of follow-up. Using the two sources together is safer than assigning names to fine linear features based only on the land-cover image.
Comparing this map with the general land-cover map is particularly helpful in Weld County. The general map outlines a broader developed class, while the impervious map pulls attention toward the hardest-surfaced parts of those areas. Around Greeley and the southwestern municipal corridor, that distinction separates a wider developed footprint from the most intensely paved or built cells. On the eastern plains, both products remain sparse, reinforcing how limited the built surface is across much of the county.
Agriculture becomes easier to read along the South Platte system
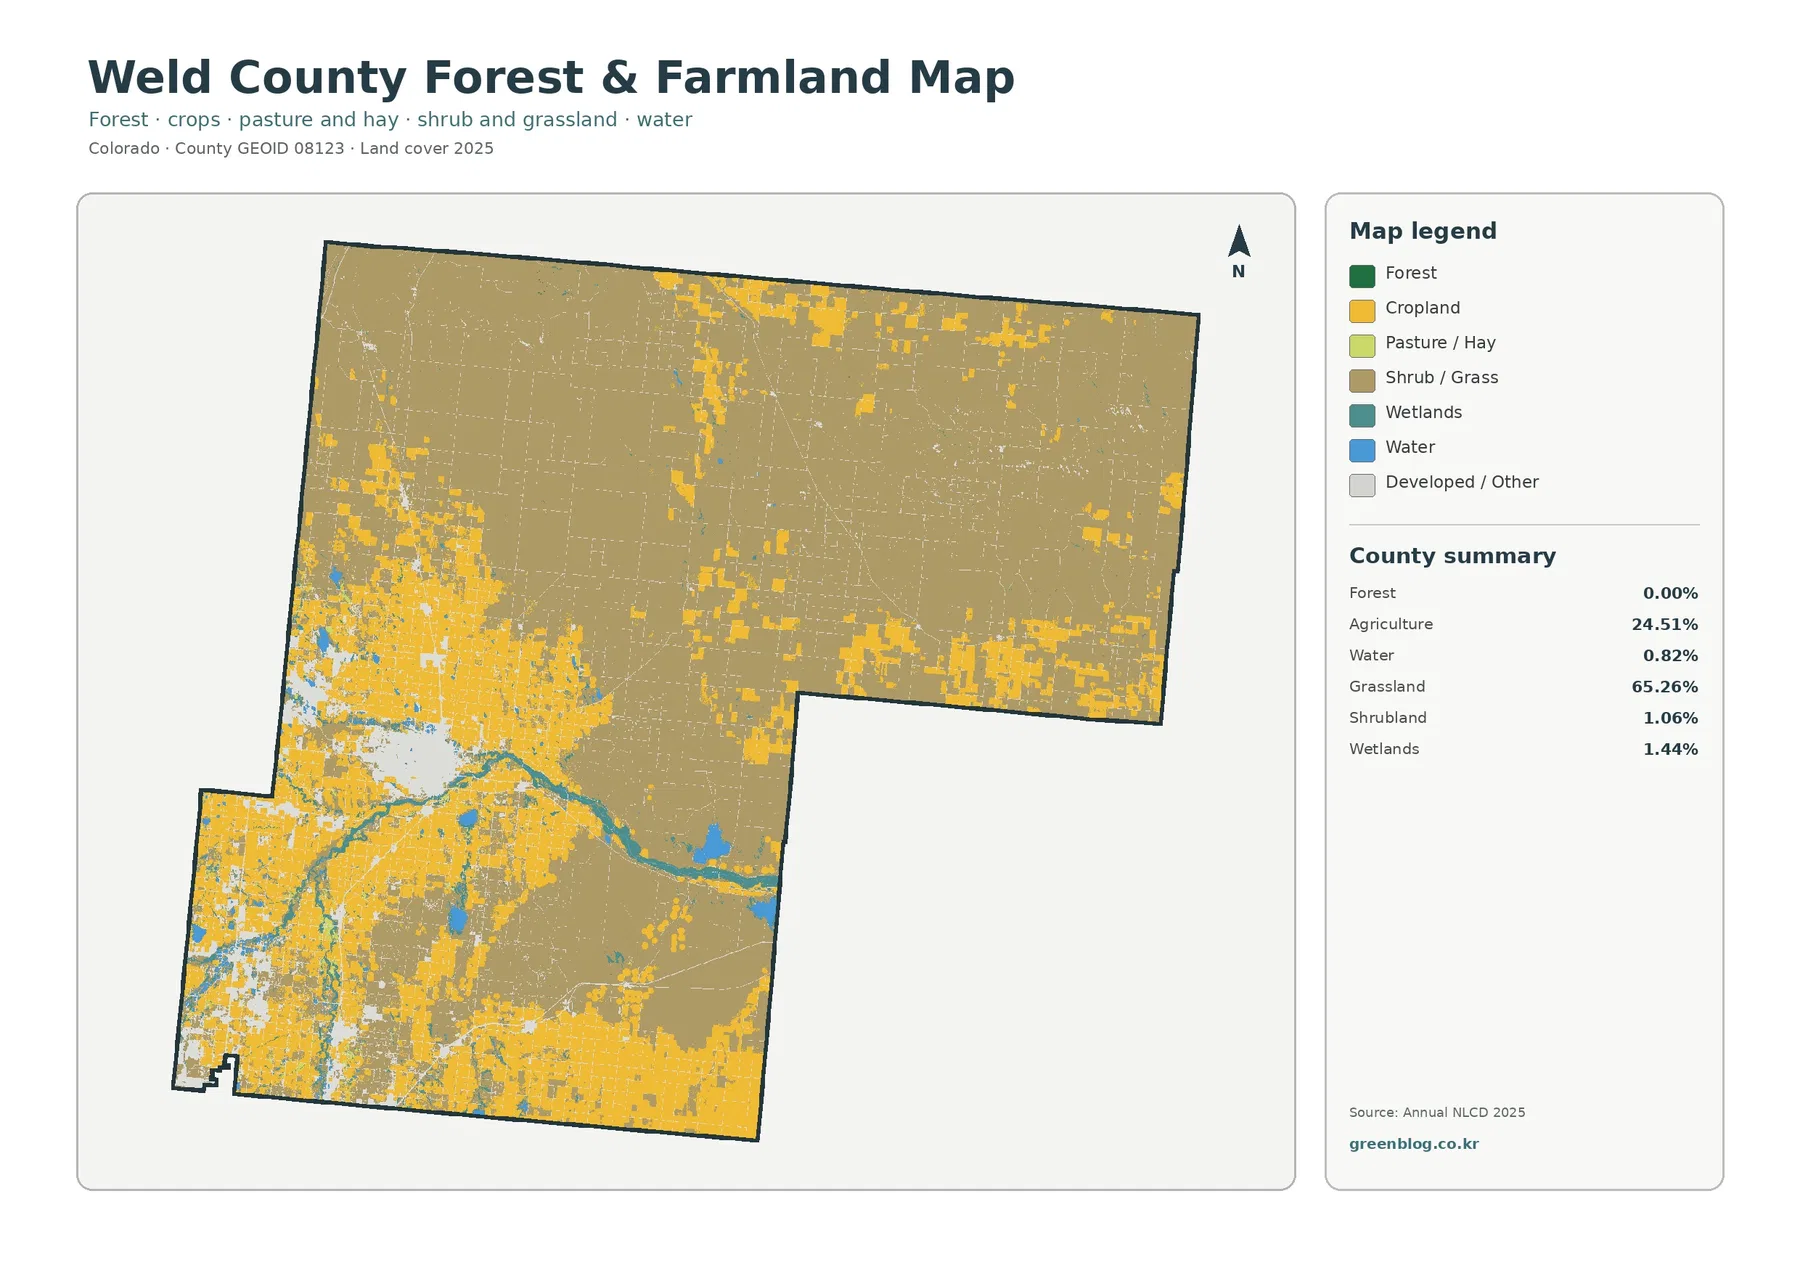
The forest-and-farmland view simplifies the county and makes the relationship among fields, open grassland, water, and wetlands much easier to follow. A broad blue and teal corridor enters from the southwest, crosses the south-central portion of the county, and continues eastward. Weld County’s official overview identifies the South Platte River and several tributaries—including the Cache la Poudre, Big Thompson, Little Thompson, and St. Vrain—as streams that enter from the south and west and leave the county to the east.
Water is listed at 0.82% in the forest-and-farmland summary, and wetlands account for 1.44%. Those percentages are small, but the long shape of the river and wetland corridor makes the feature visually important. Agricultural blocks sit close to the blue and teal areas through parts of the west and south-central county. Farther north and east, crop fields remain present but are surrounded by much larger areas of open grassland.
An official Weld County comprehensive-plan summary provides useful background for this pattern. It describes irrigation systems, ditches, and reservoirs tied to the South Platte River and its tributaries as important to agricultural productivity. That source supports using the river system as agricultural context, but the land-cover map cannot identify which individual field receives irrigation, what water right applies, or which ditch serves a parcel. Those questions require dedicated water and property records.
Forest is reported as 0.00% in the supplied 2025 county summary. That figure does not mean every tree is absent from Weld County. Small tree groups, riparian vegetation, shelterbelts, and landscaped trees can be too narrow or too mixed with neighboring surfaces to form a county-scale forest class in a 30-meter raster product. For this county, the forest-and-farmland map is therefore most informative when used to compare agriculture, grassland, water, and wetlands rather than to search for large forest blocks.
A 20.60% class difference with agricultural change spread across the county
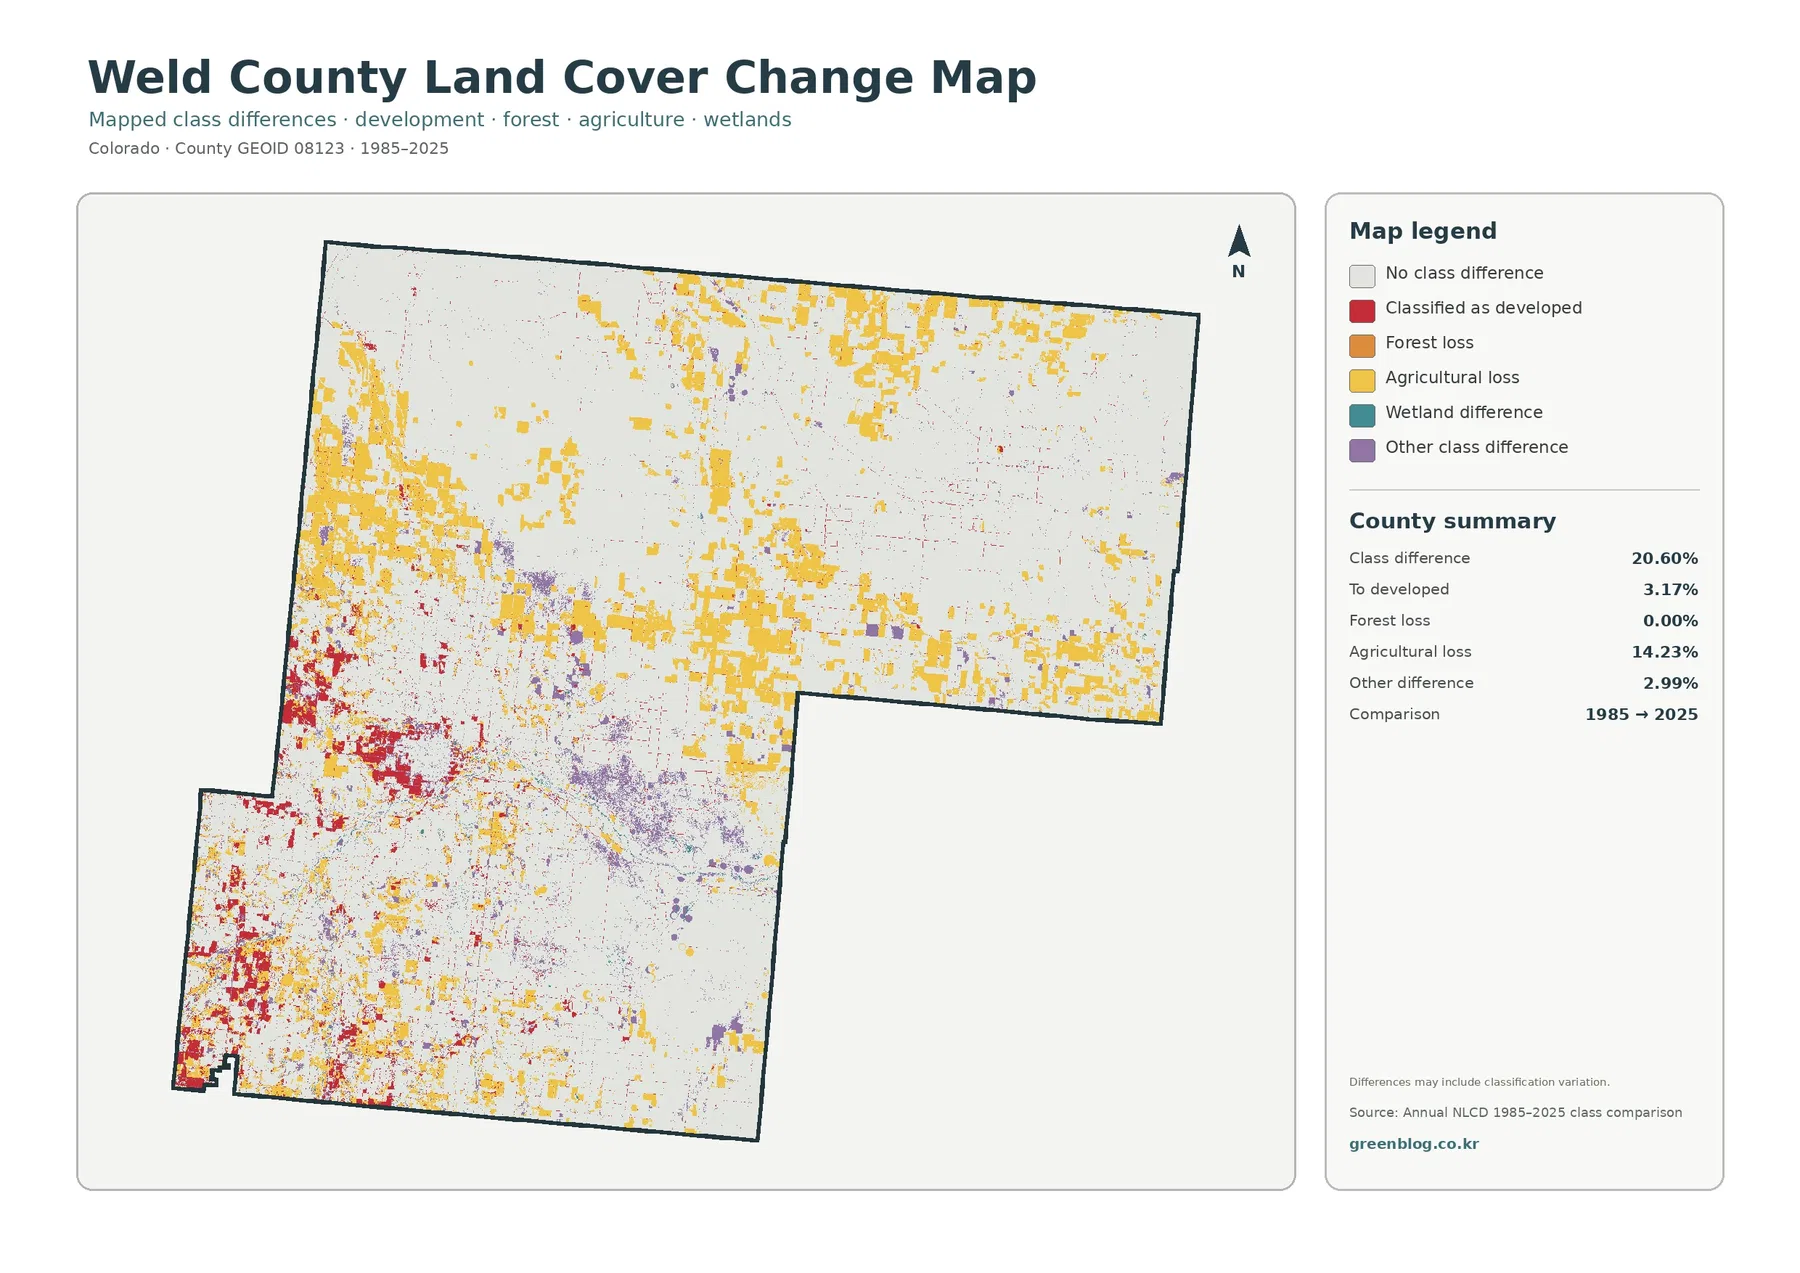
The 1985–2025 comparison reports a total class difference of 20.60%. Agricultural loss is the largest labeled category at 14.23%, followed by change to developed cover at 3.17% and other class difference at 2.99%. Forest loss is 0.00%. The key point is not simply that Weld County changed, but that the agricultural-loss category occupies a much larger share of the comparison than the developed-change category.
Yellow agricultural-loss patches appear across the north, center, east, and west rather than forming one continuous zone. Some of the largest groups lie in parts of the northern and eastern agricultural mosaic. The western side contains a different mix, where yellow agricultural-loss cells are interspersed with red developed-change areas and purple other differences. That pattern makes the change map useful for separating widespread agricultural classification differences from the more geographically concentrated expansion of developed cover.
Developed-change cells are most visible in the same broad western and southwestern areas that hold the county’s strongest current impervious concentrations. The comparison is informative, but the two products answer different questions. The change map identifies cells that were classified differently between 1985 and 2025; the impervious map measures hard-surface intensity in 2025. A location can therefore be important in one map without having the same value or meaning in the other.
The 14.23% agricultural-loss value should not be read as a direct measure of permanently abandoned farmland. It is a classification result from two dates, not a record of land-use decisions or the cause of every change. Crop rotation, vegetation conditions, mixed pixels, classification variation, and real conversion can all influence a two-date comparison. The map itself notes that the differences may include classification variation, so intermediate Annual NLCD years or historical aerial imagery are needed for a stronger conclusion about a specific location.
Three useful geographic contexts: urban west, river corridor, open east
A practical way to read Weld County is to divide the map visually into three broad contexts without treating them as formal planning districts. First is the western and southwestern developed area centered on Greeley and nearby municipalities. Second is the South Platte and tributary corridor, where water, wetlands, agriculture, and settlement appear close together. Third is the expansive north and east, where grassland dominates and hard surfaces are sparse.
That framework helps explain why the four maps should not be treated as interchangeable. The current land-cover map is best for the countywide balance among grassland, agriculture, development, water, and wetlands. The forest-and-farmland map strips away some of the urban complexity and makes field patterns easier to compare. The impervious map focuses attention on settlement intensity, while the 1985–2025 map adds a time dimension that is absent from the other three.
For an agriculture-focused project, begin with the forest-and-farmland image and locate crop blocks around the river system and across the northern plains. Then return to the general map to see where developed cover or wetlands share those areas. For an urban-development discussion, start with the impervious map around Greeley and the southwest, then compare those clusters with current developed cover and the red change-to-developed cells on the historical comparison.
Water and wetlands deserve attention even though their percentages are small. A long river corridor can influence how a reader understands the arrangement of agricultural land, communities, and open space more than a simple countywide percentage would suggest. At the same time, proximity on the map should not be converted into a causal statement unless another source supports it. The official county planning material provides irrigation context, but a specific field, wetland, or development proposal requires more detailed local records.
What the 30-meter classification can and cannot tell you
Annual NLCD is a raster product, meaning the county is divided into small grid cells and each cell receives a land-cover classification. At roughly 30-meter scale, one cell can contain more than one real-world surface. A farm lane, ditch, narrow tree line, small pond, yard, and field edge may overlap the same cell. The final class is therefore a generalized representation rather than a survey boundary.
This matters in Weld County because so many fine features are embedded in a large agricultural and grassland landscape. A narrow wetland strip can look simplified, and a shelterbelt may disappear into the surrounding class. The same limitation helps explain why the county summary can report 0.00% forest even though individual trees or small wooded strips exist. It also means that a single colored pixel should not be treated as proof of a parcel’s legal land use.
Time is another limitation. The current maps describe 2025 classifications, while the change product compares 1985 with 2025. They do not show construction, crop changes, or vegetation shifts that occurred after the observation year. The two-date map also does not reveal when within the forty-year interval a change happened or whether the class changed more than once. Intermediate years are the right next step when timing matters.
Land cover is also different from zoning, ownership, permitted use, or property value. A cell labeled agriculture describes the visible cover class, not a legal agricultural designation. A developed cell does not confirm a building permit or municipal boundary. When a project depends on parcel lines, ownership, zoning, or current permits, Weld County’s GIS and department records should be consulted instead of using these maps as a substitute.
Download notes and the numbers worth keeping together
The current summary is led by 65.26% grassland, 24.51% agriculture, 6.76% developed cover, 1.44% wetlands, and 1.06% shrubland. The forest-and-farmland view also reports 0.82% water and 0.00% forest. Mean impervious surface is 1.91%, with 1.23% of the county at 50% or greater imperviousness. In the 1985–2025 comparison, total class difference is 20.60%, agricultural loss is 14.23%, change to developed cover is 3.17%, and other difference is 2.99%. Current-cover percentages and change percentages describe different measurements and should not be added together.
The best map order depends on the purpose. A county overview usually works well with current land cover first. A farm-and-grassland discussion can begin with the simplified forest-and-farmland view. The impervious map is the clearest choice for the Greeley-centered urban footprint, while the change map is most useful after readers already understand the present pattern. Keeping all four JPGs together makes it easier to switch among those questions without treating one map as a complete description of the county.
The supplied asset manifest lists each original JPG at 2480 × 1754 pixels. The package does not certify those files as meeting an A3 high-resolution reference, so inspect legend text and fine boundaries at the intended size before making a large-format print. For normal documents and screen use, the originals provide a convenient way to keep all four views of Weld County together.
Frequently Asked Questions
What is the largest land-cover class in Weld County?
Grassland is the largest 2025 class at 65.26%. Agriculture follows at 24.51%, and developed cover is 6.76%. The percentages describe the county as a whole, but the maps show a strong internal contrast: farming and development are denser in the west and southwest, while grassland is much more continuous across the north and east.
Why is developed cover 6.76% while mean impervious surface is only 1.91%?
Developed land and impervious surface measure different things. A developed cell can include lawns, trees, and other permeable surfaces around buildings, while impervious data focuses on hard surfaces such as rooftops and pavement. That is why the countywide impervious mean can be much lower even though developed cover occupies a larger mapped area.
Does 14.23% agricultural loss mean that much farmland was permanently removed?
No. The 14.23% value is a class-comparison category between 1985 and 2025. It does not by itself identify the cause, timing, or permanence of the change. Intermediate Annual NLCD years, aerial imagery, agricultural records, and local planning information are needed before making a parcel- or trend-specific conclusion.
Map File Information
Download the four original Weld County JPG maps together in one ZIP archive for offline reference.
- Included Files: Use only the versions confirmed in the article and supplied images
- File Type: Use the confirmed download contents
- Intended Use: Printing, education, presentations, and map-based projects
Related Maps
- Adams County Colorado Land Cover Map
- Alamosa County Colorado Land Cover Map
- Arapahoe County Colorado Land Cover Map
Sources and References
- MRLC Annual NLCD Data – access to land-cover and impervious-surface products
- USGS Annual NLCD Land Cover Classification – class definitions and interpretation guidance
- U.S. Census Bureau TIGER/Line Shapefiles – county boundary and geographic reference data
- Weld County Live & Work – official county overview of Greeley, terrain, rivers, and settlement pattern
- Weld County Comprehensive Plan Existing Conditions Summary – official agricultural and irrigation context
- Weld County Geographic Information Systems – official GIS maps and local geographic data resources
Green Map creates custom-edited map images using open geographic data sources such as geoBoundaries, Natural Earth, OpenStreetMap, and government open data.
These maps are edited visual materials, not raw data files, and are provided for education, documents, presentations, and graphic reference.