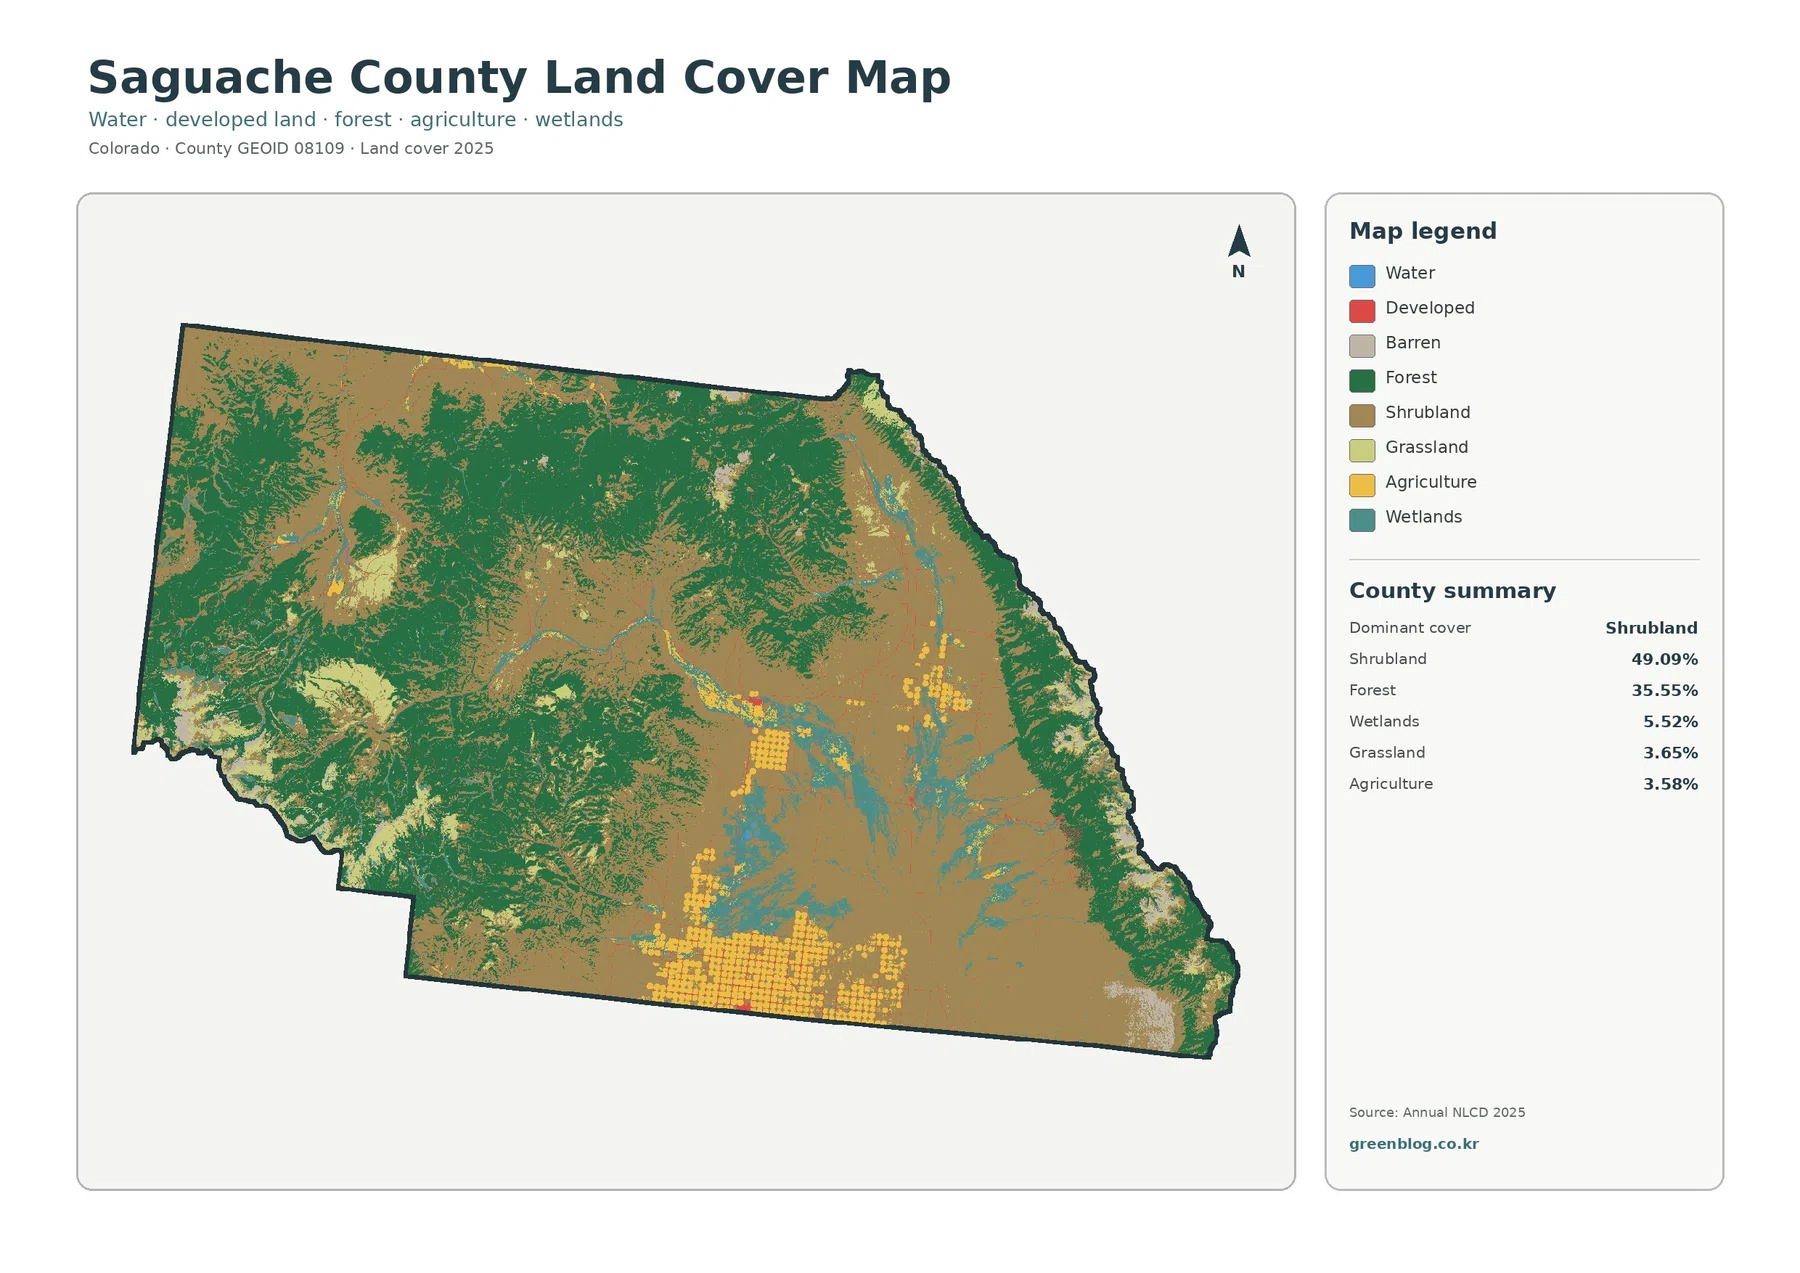
Saguache County presents a land-cover pattern shaped far more by shrubland, forest, wetlands, and open valley surfaces than by built-up land. In the 2025 summary, shrubland accounts for 49.09% of the county and forest for 35.55%, while wetlands make up 5.52%, grassland 3.65%, agriculture 3.58%, and water 0.04%.
This page compares four views of that landscape: current land cover, forest and farmland, impervious surface and developed land, and mapped class differences from 1985 to 2025. The four original JPG maps are also available together in one ZIP for classroom work, presentations, county comparisons, and environmental reference.
Table of Contents
A county split between broad shrubland and large forested uplands
The general 2025 map is dominated by two colors. Shrubland spreads across much of the central and eastern interior, while forest covers extensive areas in the west, north, and along higher terrain near the eastern edge. Together, those two classes exceed 84% of the county, so the overall map reads as a largely natural landscape rather than a county organized around a broad urban footprint.
Shrubland is the single largest class at 49.09%. It forms wide, connected areas and also fills many openings between forested blocks. Forest reaches 35.55% and appears in larger, darker-green masses, especially along the mountainous sides of the county. Where the two meet, the boundary is often irregular rather than straight, which makes the transition between wooded and more open vegetation easy to see at county scale.
Wetlands are a smaller share at 5.52%, but they are visually important because they form teal bands and patches through lower parts of the interior and toward the south. Water itself is only 0.04%, so the blue class is limited to narrow or small features. Reading those two classes separately is useful: wet ground with vegetation can cover far more area than open water even when both are associated with the same broad lowland setting.
Agriculture covers 3.58% and is not evenly spread across the county. The strongest farm pattern appears in the south, where yellow blocks form a much more regular geometry than the surrounding shrubland and forest. Smaller agricultural patches occur elsewhere, but the southern concentration is the clearest. Grassland, at 3.65%, is more scattered and often appears between shrubland, wetlands, and agricultural areas.
Barren land is included in the map legend and can be seen in a few mountain and dry-surface patches, but the supplied county summary does not provide a separate percentage for it. For that reason, this article does not invent a numeric share. The same rule applies to any class that is visible but not assigned a verified value in the package.
The forest and farmland view makes the southern farm pattern easier to isolate
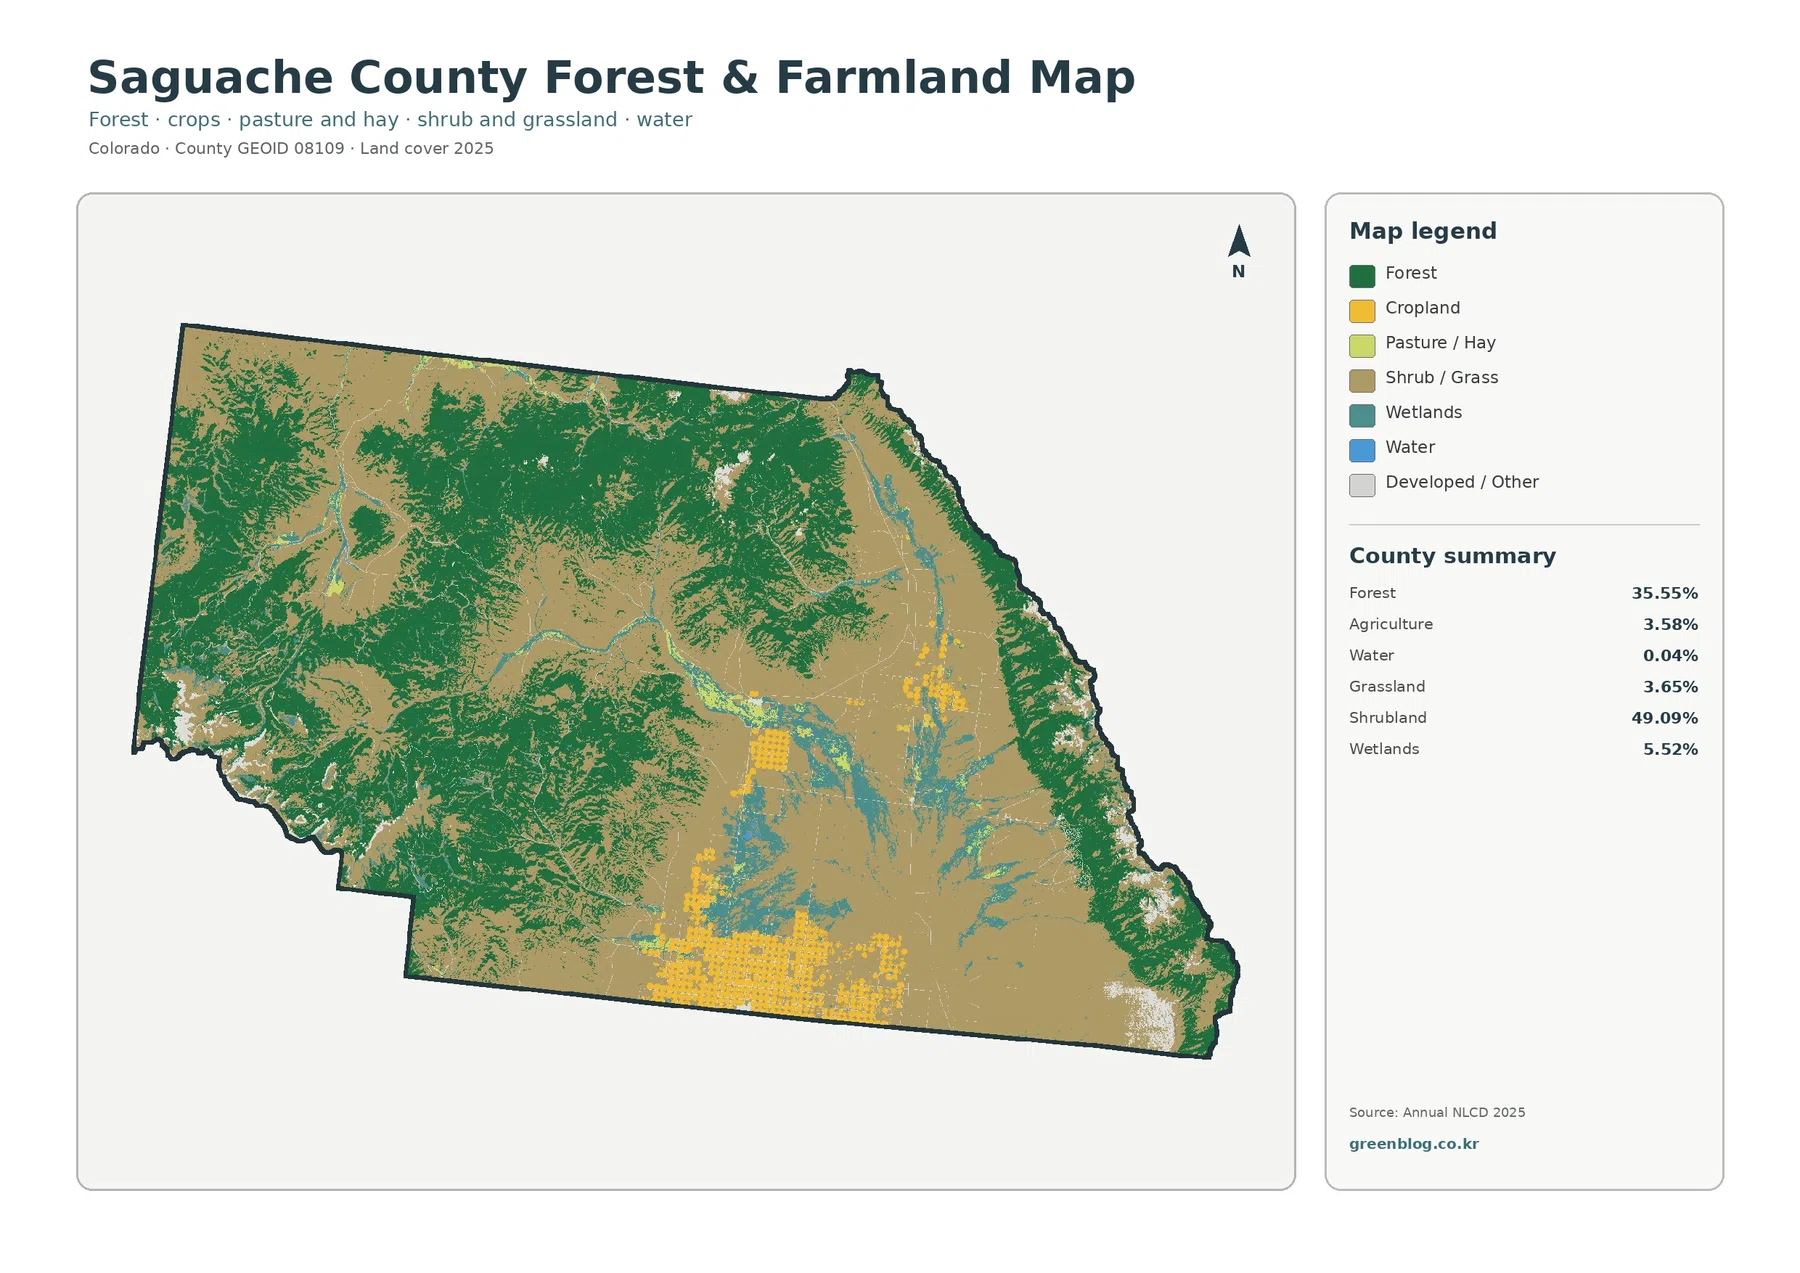
Reducing the legend to forest, agriculture, pasture or hay, shrub and grass, wetlands, water, and developed or other land changes what stands out first. Large forest tracts remain obvious in the west and north, but the yellow agricultural blocks in the south become much easier to follow. Their straight edges and repeated shapes contrast strongly with the irregular outlines of surrounding natural vegetation.
The 3.58% agricultural share is therefore best understood as a countywide percentage, not as a measure of how dominant farming looks in every local area. A class can occupy a modest share of a very large county and still be highly concentrated within a particular valley or plain. The map is useful precisely because it shows where that concentration occurs instead of reducing the county to one number.
Wetlands also become easier to compare in this simplified view. They extend through parts of the central and southern lowlands and sometimes sit near agricultural blocks. That adjacency should not be treated as proof that one caused the other. It simply identifies places where water-related land cover and farming occur near one another and where a watershed, habitat, or agricultural study might benefit from more detailed local data.
Saguache County’s Land Development Code uses separate administrative definitions for agricultural crop land, agricultural rangeland, and natural vegetation. Those terms serve land-use and regulatory purposes and are not equivalent to Annual NLCD land-cover classes. A 3.58% agricultural land-cover value therefore should not be treated as the total share of the county involved in farming, ranching, grazing, or agricultural ownership.
Impervious cover remains sparse across nearly the entire county
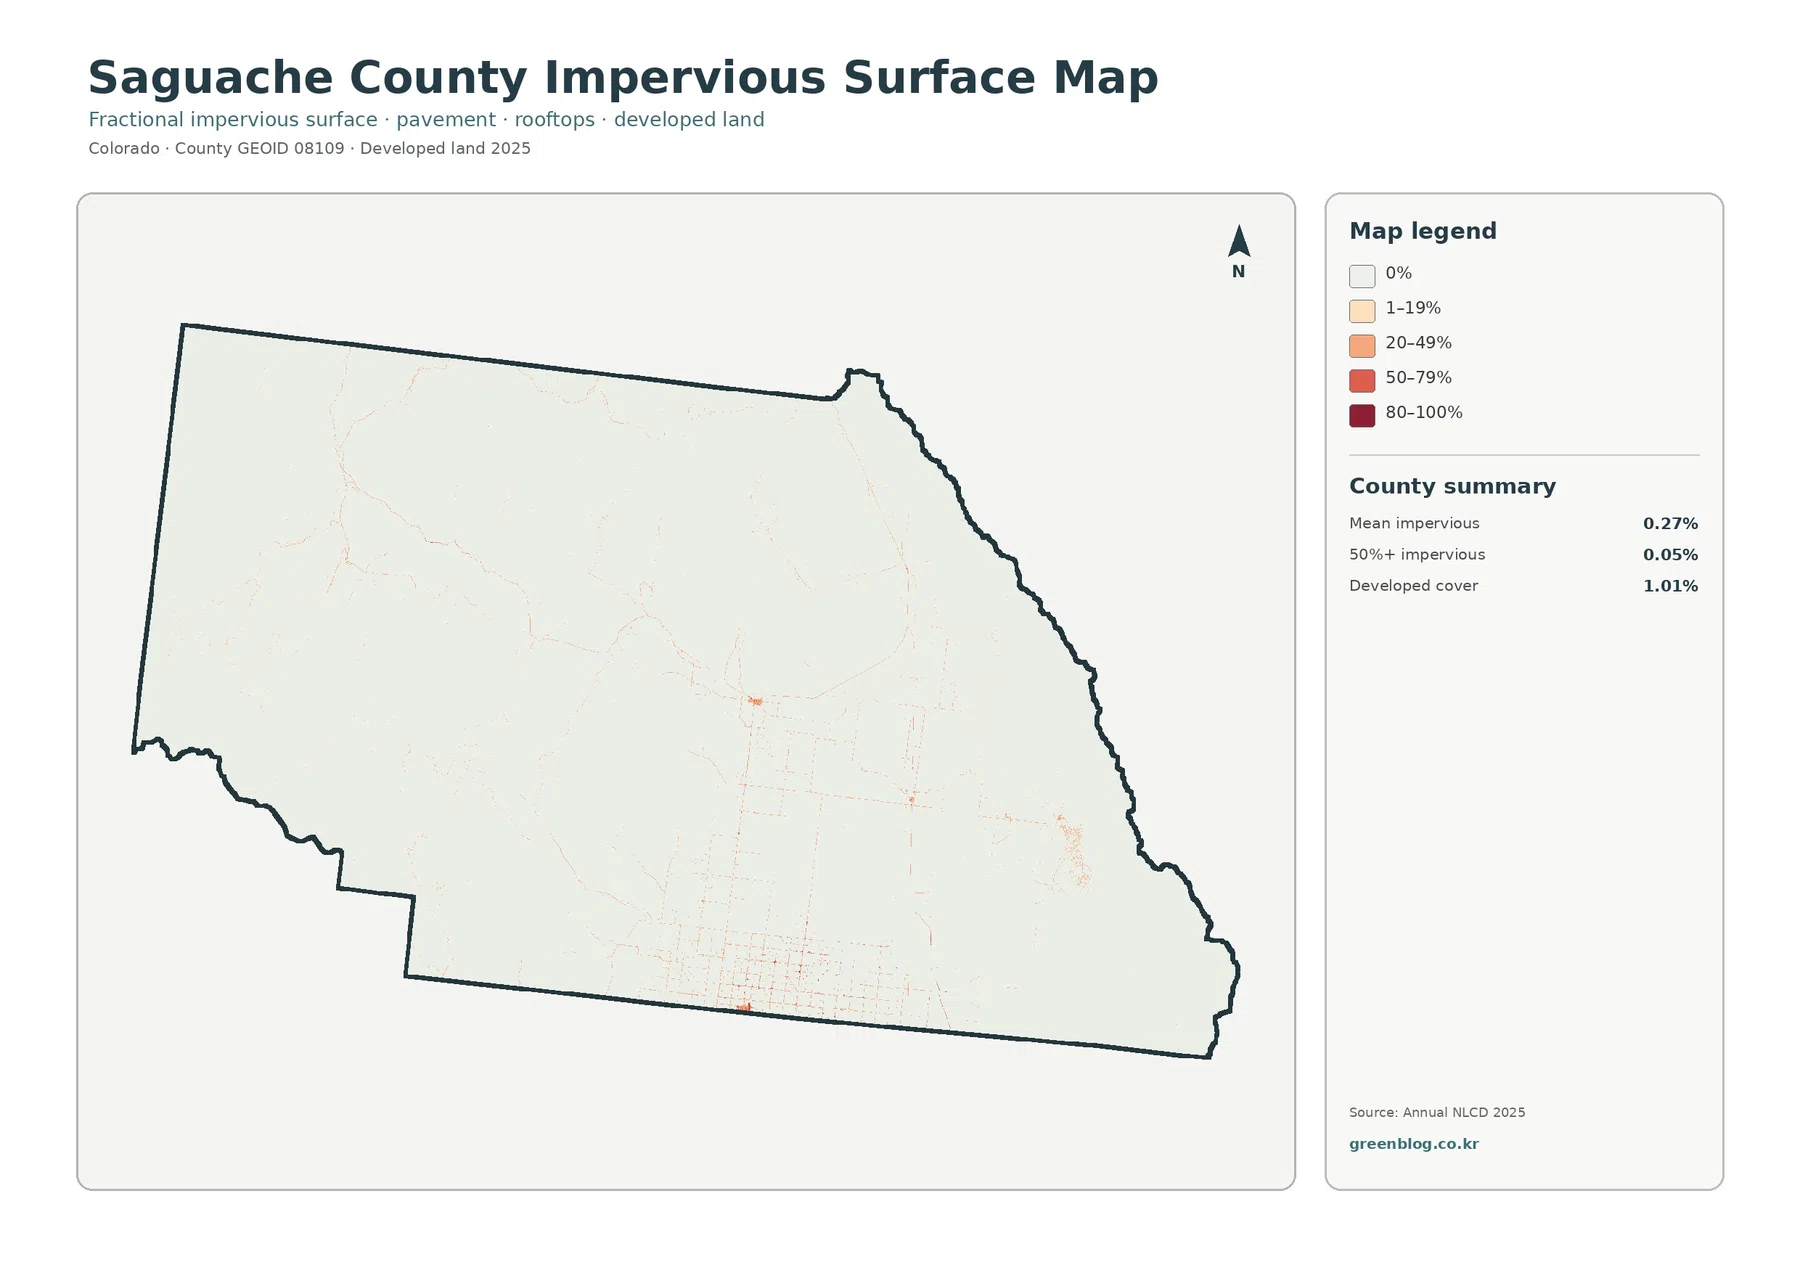
Impervious surface means hard material such as pavement and rooftops that does not readily absorb rainfall. Saguache County has a mean impervious value of only 0.27%, and just 0.05% of the county is mapped at 50% impervious or higher. Developed cover is 1.01%. Those values match the visual impression of a map that is mostly pale, with only small orange and red marks where built surfaces are concentrated.
Rather than one large urban area, the map shows several small clusters and thin linear traces. Some of the clearest marks occur in the south, where a broader road grid is faintly visible, while additional compact concentrations appear in the central and eastern portions of the county. The pattern is useful for seeing where built surfaces are grouped, but the map does not label individual streets, parcels, or municipal boundaries.
Developed cover and imperviousness answer different questions. A developed land-cover class may contain lawns, bare soil, vegetation, driveways, buildings, and roads within the same raster cell. The impervious product estimates the hard-surface fraction more directly. That is why a county can have 1.01% developed cover while its mean imperviousness is only 0.27%.
This distinction matters when comparing the impervious map with the southern agricultural grid. Rectangular farm fields and straight property patterns can look highly organized, yet they are not automatically impervious or urban. The impervious layer helps separate cultivated land from places where pavement and structures form a measurable hard-surface signal.
At the same time, this raster product should not be used to measure the footprint of a single building or the width of a road. Small features can be mixed with surrounding vegetation or soil inside a cell and represented by a generalized value. Countywide planning context, environmental education, and broad runoff comparisons are appropriate uses; parcel-level decisions require more detailed local mapping.
The 1985–2025 map identifies class differences, not a single measure of land loss
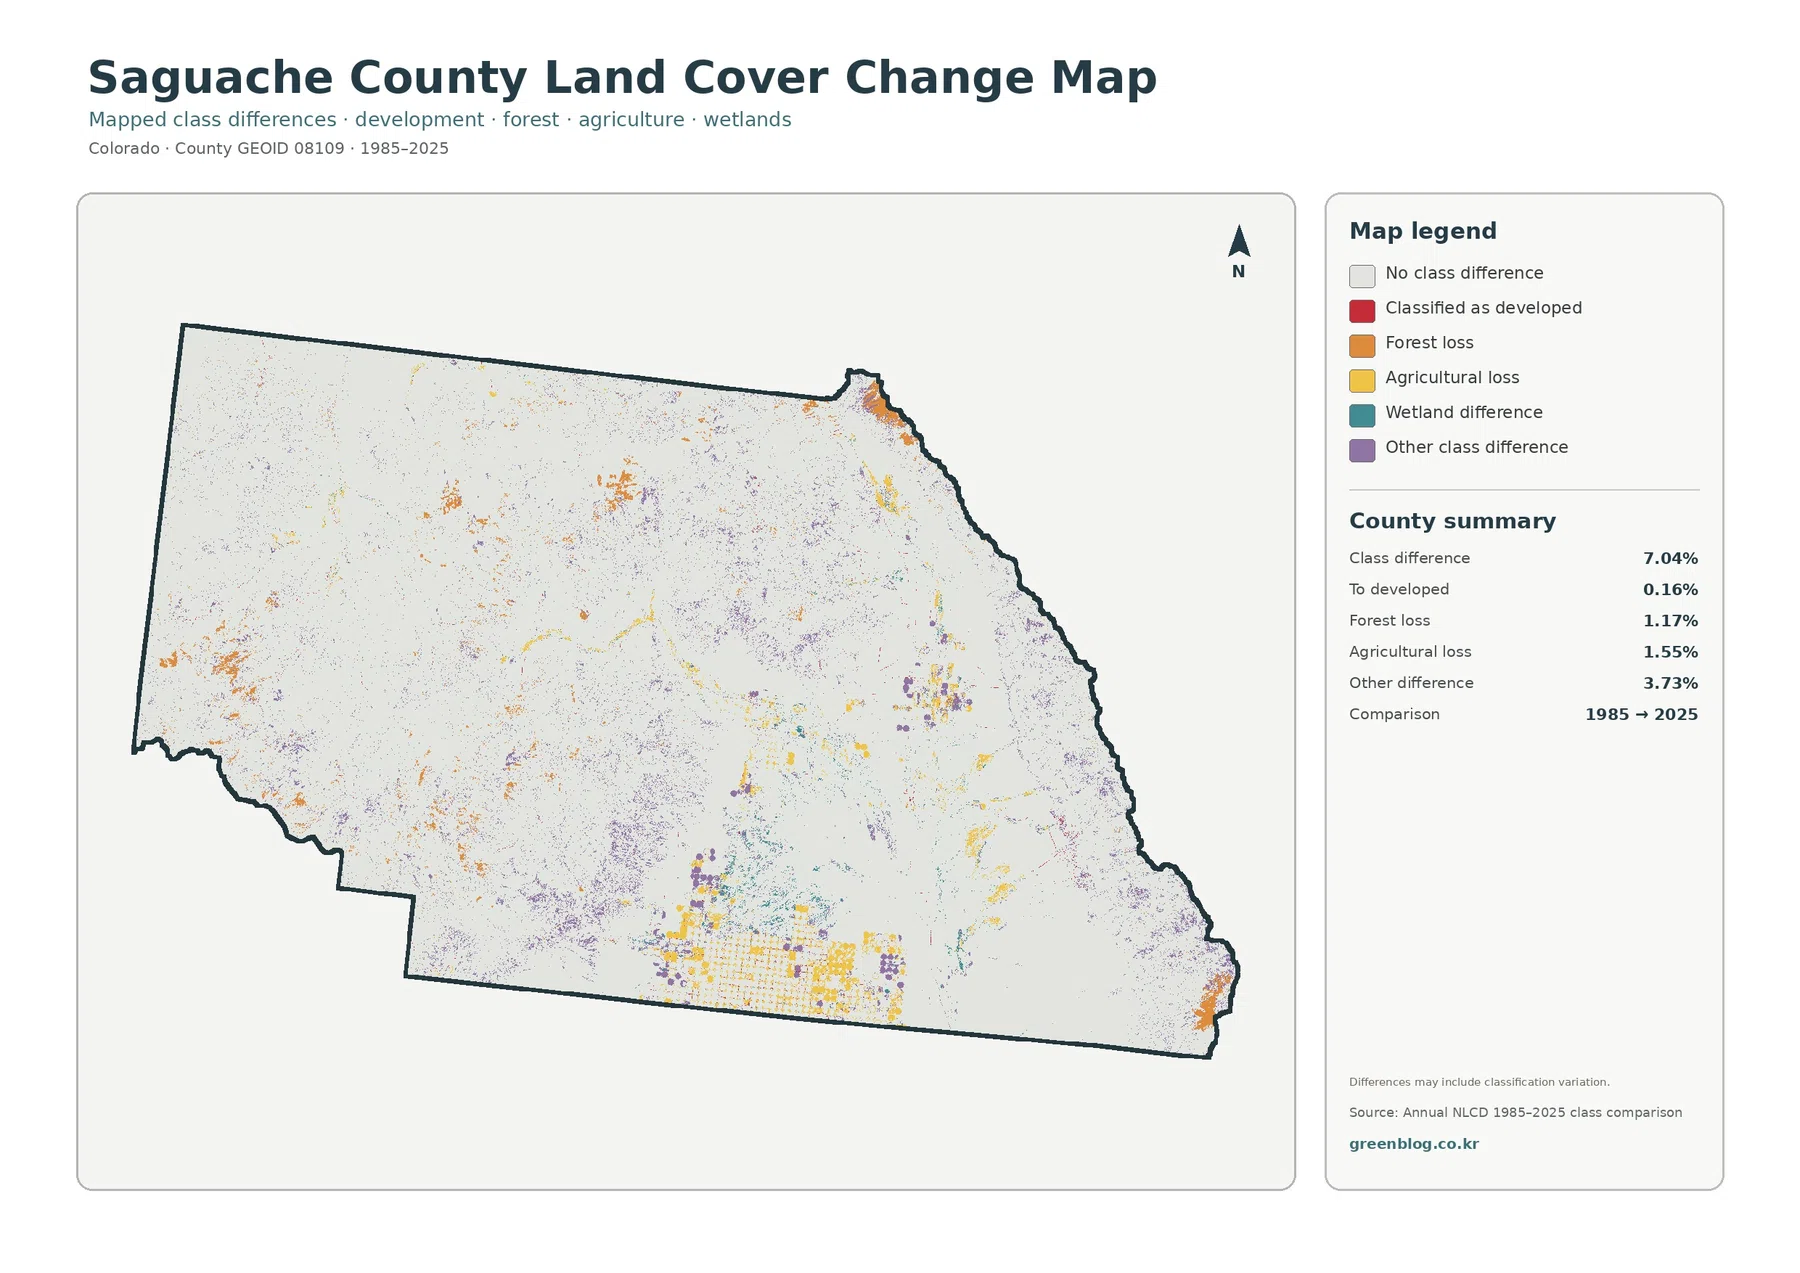
The change map compares how the same raster cells were classified in 1985 and 2025. The county summary reports a 7.04% overall class difference. Within the mapped categories, 0.16% is classified as change to developed land, 1.17% as forest loss, 1.55% as agricultural loss, and 3.73% as other class difference. Additional wetland-related differences are shown in the legend as a separate category.
Those values should not be read as a 7.04% destruction rate. A class can change because the land itself changed, but satellite timing, vegetation condition, soil moisture, disturbance and recovery, image quality, or classification methods can also influence the result. The note printed on the map explicitly warns that mapped differences may include classification variation.
The most useful approach is to treat colored cells as places to investigate. Orange forest-loss patches can be compared with the current forest map. Yellow agricultural-loss patches in the south can be checked against the 2025 agricultural pattern. Red cells mapped as developed can be cross-checked with the impervious-surface layer to see whether hard surfaces are present today.
Forest loss at 1.17% does not mean that precisely 1.17% of the county’s forest was permanently removed. It means cells previously classified as forest received another class in 2025. The same caution applies to the 1.55% agricultural-loss category. Determining a cause or confirming permanence would require intermediate Annual NLCD years, aerial imagery, field observations, and relevant land-management records.
How the four maps work together
Start with the general land-cover map when the goal is to understand the county as a whole. It shows why shrubland and forest dominate, where wetlands become important, and where the agricultural blocks sit within that larger natural landscape. The forest and farmland version then removes some visual complexity so the contrast between wooded uplands, farm areas, and wet lowlands becomes easier to explain.
The impervious map adds a different kind of evidence. It shows that the regular geometry of the southern agricultural area does not translate into a broad hard-surface footprint. Developed signals remain small. This is a useful comparison for students or readers who might otherwise assume that any strongly patterned land surface is urban or heavily paved.
The change map should come last because it is easier to interpret after the current landscape is familiar. Once a reader knows where forest, agriculture, wetlands, and developed land are located in 2025, the colored difference cells can be compared with their present-day class instead of being treated as unexplained change symbols.
Land cover is not zoning, ownership, a parcel survey, or a development-rights map. Saguache County’s own land-use documents use legal and administrative definitions that serve different purposes. The Census TIGER/Line boundary data can help with official geographic boundaries, while county regulations and parcel records should be consulted for legal land-use questions.
Practical uses and reading limits
- Use the 2025 land-cover map for a broad comparison of shrubland, forest, wetlands, agriculture, grassland, water, barren land, and developed cover.
- Use the forest and farmland map when the main question is where wooded terrain ends and concentrated farming begins.
- Use the impervious map to compare hard-surface concentration among small settlement and road clusters.
- Use the 1985–2025 difference map to select locations for follow-up research rather than to assign a cause from the map alone.
For classroom use, the general map works well as the first image because it introduces the major classes without hiding smaller wetland and agricultural areas. A second slide using the simplified forest-and-farmland view can focus attention on the southern farm blocks. The impervious map can then show how little of the county is dominated by hard surfaces.
For environmental or watershed presentations, keeping the legend and year visible is especially important. The current maps are labeled 2025, while the difference map compares 1985 with 2025. Cropping away those labels can make a current percentage look like a change percentage or make a difference category look like a measured loss rate.
Annual NLCD is a raster classification, so each cell represents a generalized surface class rather than a surveyed parcel boundary. Mixed pixels can contain more than one real-world material. Narrow streams, small wetlands, minor roads, isolated buildings, or edges between vegetation types may therefore be simplified. The maps are strongest for county-scale comparison and weaker for site-specific measurement.
Download the four Saguache County JPG maps
The ZIP below contains all four original JPG maps described on this page. Each image is 2480×1754 pixels and can be used in documents, classroom materials, presentations, or county-to-county comparisons. The supplied asset manifest does not mark these files as meeting its A3 high-resolution reference, so large-format printing or detailed spatial analysis should use the original Annual NLCD data or another higher-resolution source when necessary.
Frequently Asked Questions
What is the dominant land cover in Saguache County?
Shrubland is the largest 2025 class at 49.09%, followed by forest at 35.55%. Together they account for most of the county.
Which map is best for comparing agriculture and wetlands?
The forest and farmland map makes the southern agricultural blocks and central-to-southern wetlands easy to compare, while the general map adds surrounding shrubland and forest.
Does the 7.04% class difference mean 7.04% of the county was damaged?
No. It is the share of cells assigned different land-cover classes in 1985 and 2025. Real change, vegetation condition, observation timing, and classification variation can all contribute.
Map File Information
The ZIP includes four original JPG maps: 2025 land cover, forest and farmland, impervious surface and developed land, and 1985–2025 class differences.
- Included Files: Use only the versions confirmed in the article and supplied images
- File Type: Use the confirmed download contents
- Intended Use: Printing, education, presentations, and map-based projects
Related Maps
- Adams County Colorado Land Cover Map
- Alamosa County Colorado Land Cover Map
- Arapahoe County Colorado Land Cover Map
Sources and References
- MRLC Annual NLCD Data – land-cover and impervious-surface data
- USGS Annual NLCD Land Cover Classification – descriptions of land-cover classes
- U.S. Census Bureau TIGER/Line Shapefiles – county boundary reference
- Saguache County Land Development Code Definitions – county definitions for agricultural land and natural vegetation
Green Map creates custom-edited map images using open geographic data sources such as geoBoundaries, Natural Earth, OpenStreetMap, and government open data.
These maps are edited visual materials, not raw data files, and are provided for education, documents, presentations, and graphic reference.