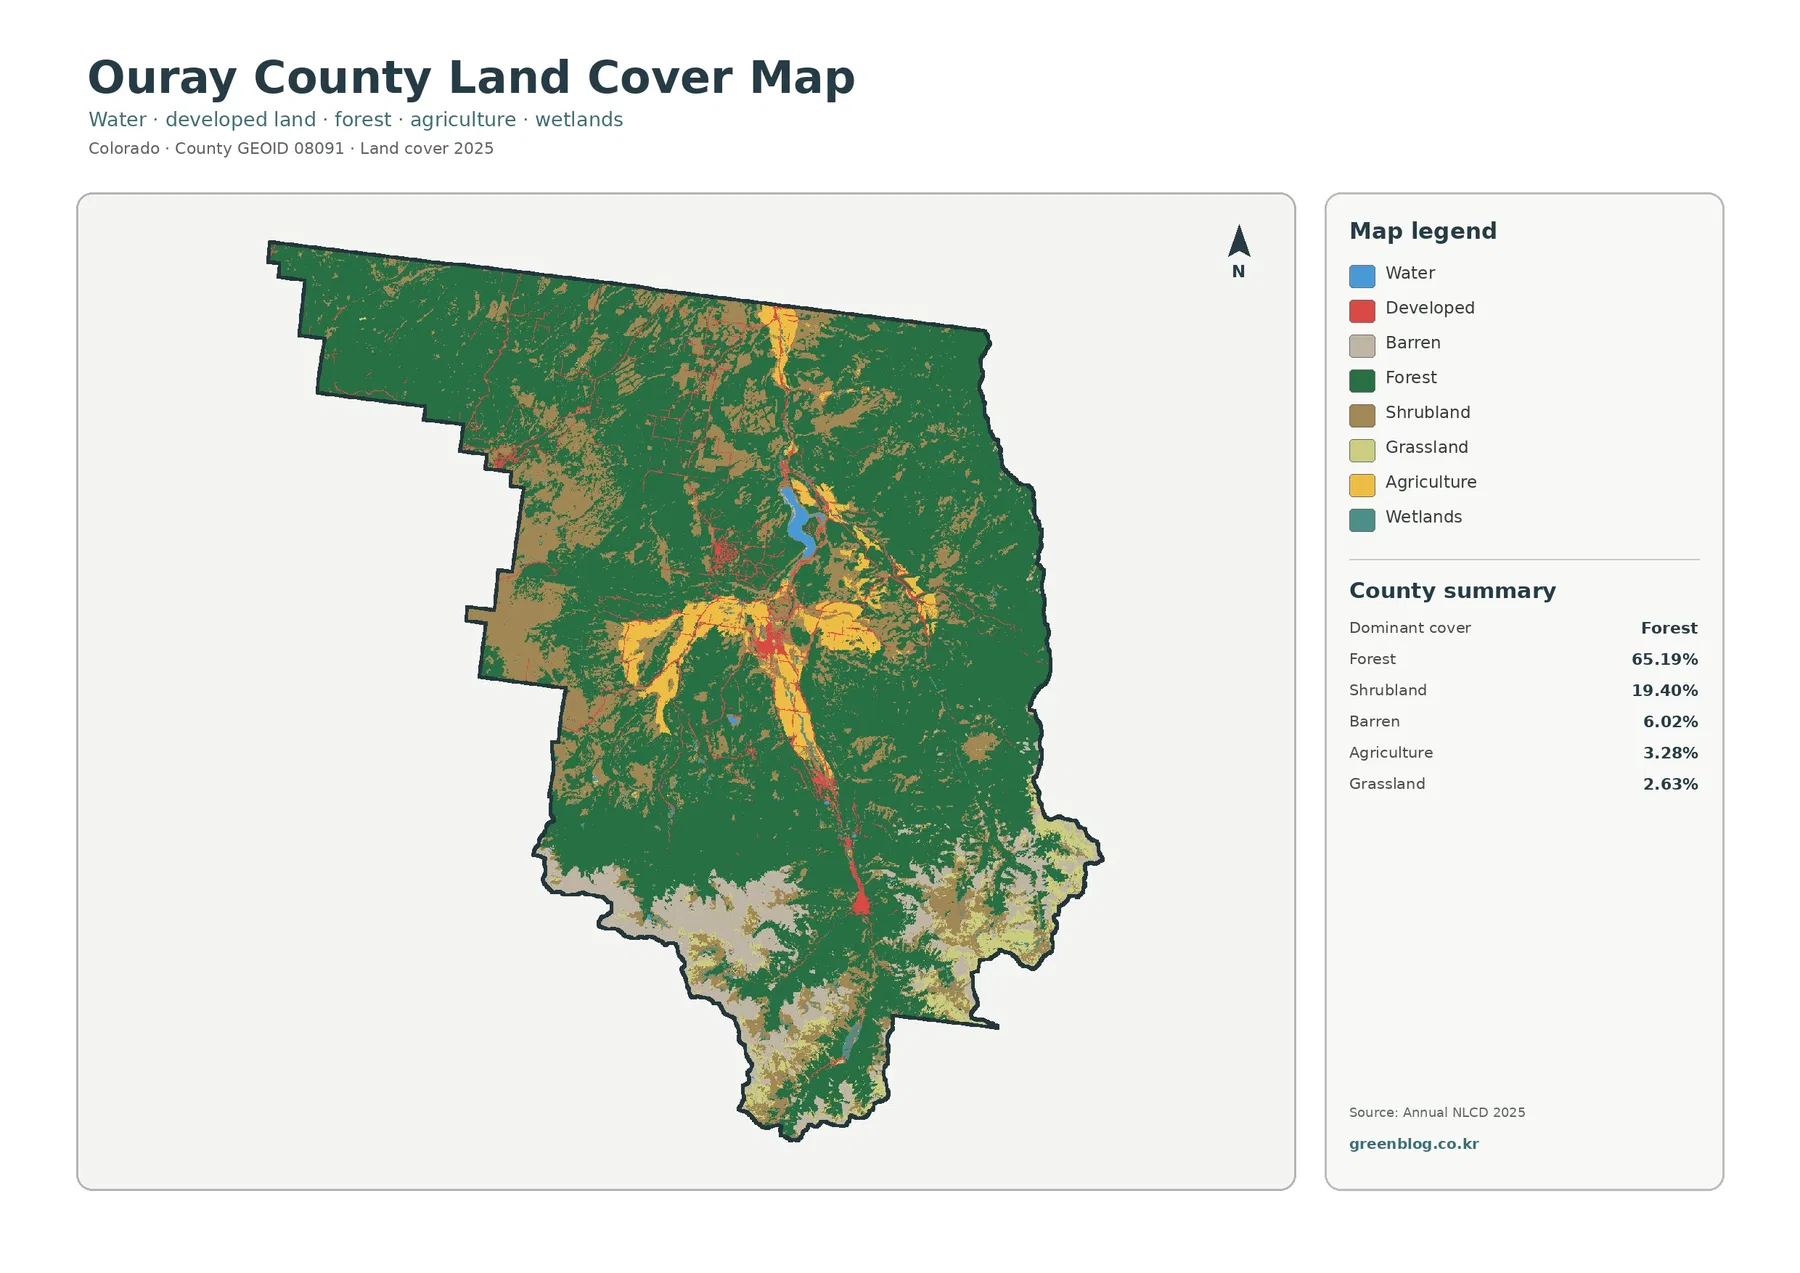
Ouray County is a mountain county in southwestern Colorado where forested slopes cover most of the land while the Uncompahgre River Valley forms a much narrower band of farms, water, roads, and settlements. In the supplied 2025 summary, forest accounts for 65.19% of the county, followed by shrubland at 19.40%, barren land at 6.02%, agriculture at 3.28%, and grassland at 2.63%. That contrast is visible before any labels are added: broad green mountain cover surrounds a more varied central valley.
The page brings together four views of the same county: current land cover, forest and farmland, impervious surface and developed land, and mapped class differences between 1985 and 2025. The original four JPG maps are available in one download below. Using them together makes it easier to compare the high-country forest, the valley floor, the small developed clusters associated with Ouray and Ridgway, and places where the two comparison years were assigned different land-cover classes.
Table of Contents
A county where the high country controls the land-cover pattern
The most important fact on the 2025 map is not a town or a road but the sheer continuity of forest. Dark green covers much of the western projection, the eastern side, and large portions of the south. Ouray County’s official overview describes a landscape that includes the San Juan Mountains, the headwaters and valley of the Uncompahgre River, and mesa country farther north. The land-cover map fits that geography: mountain terrain is mostly forested, while the valley and high exposed areas break the green cover into a more complicated mix.
Forest makes up 65.19% of the mapped county. That percentage describes physical surface cover in the 2025 classification, not forest ownership, public land, timber availability, or legal protection. A land-cover class answers a simple question about what the surface looked like to the classification system. It does not say who owns a parcel or what development rules apply there.
Shrubland is the second-largest class at 19.40%. It appears in broad patches mixed with forest, especially where the green cover becomes less continuous. Barren land is 6.02% and is most noticeable in the southern high country and other exposed mountain areas. On a countywide map those light areas may look empty, but the class can include rocky or sparsely vegetated surfaces rather than unused land. Grassland is much smaller at 2.63% and occurs in scattered openings rather than as a dominant plain.
Why the Uncompahgre Valley stands out on the forest and farmland map
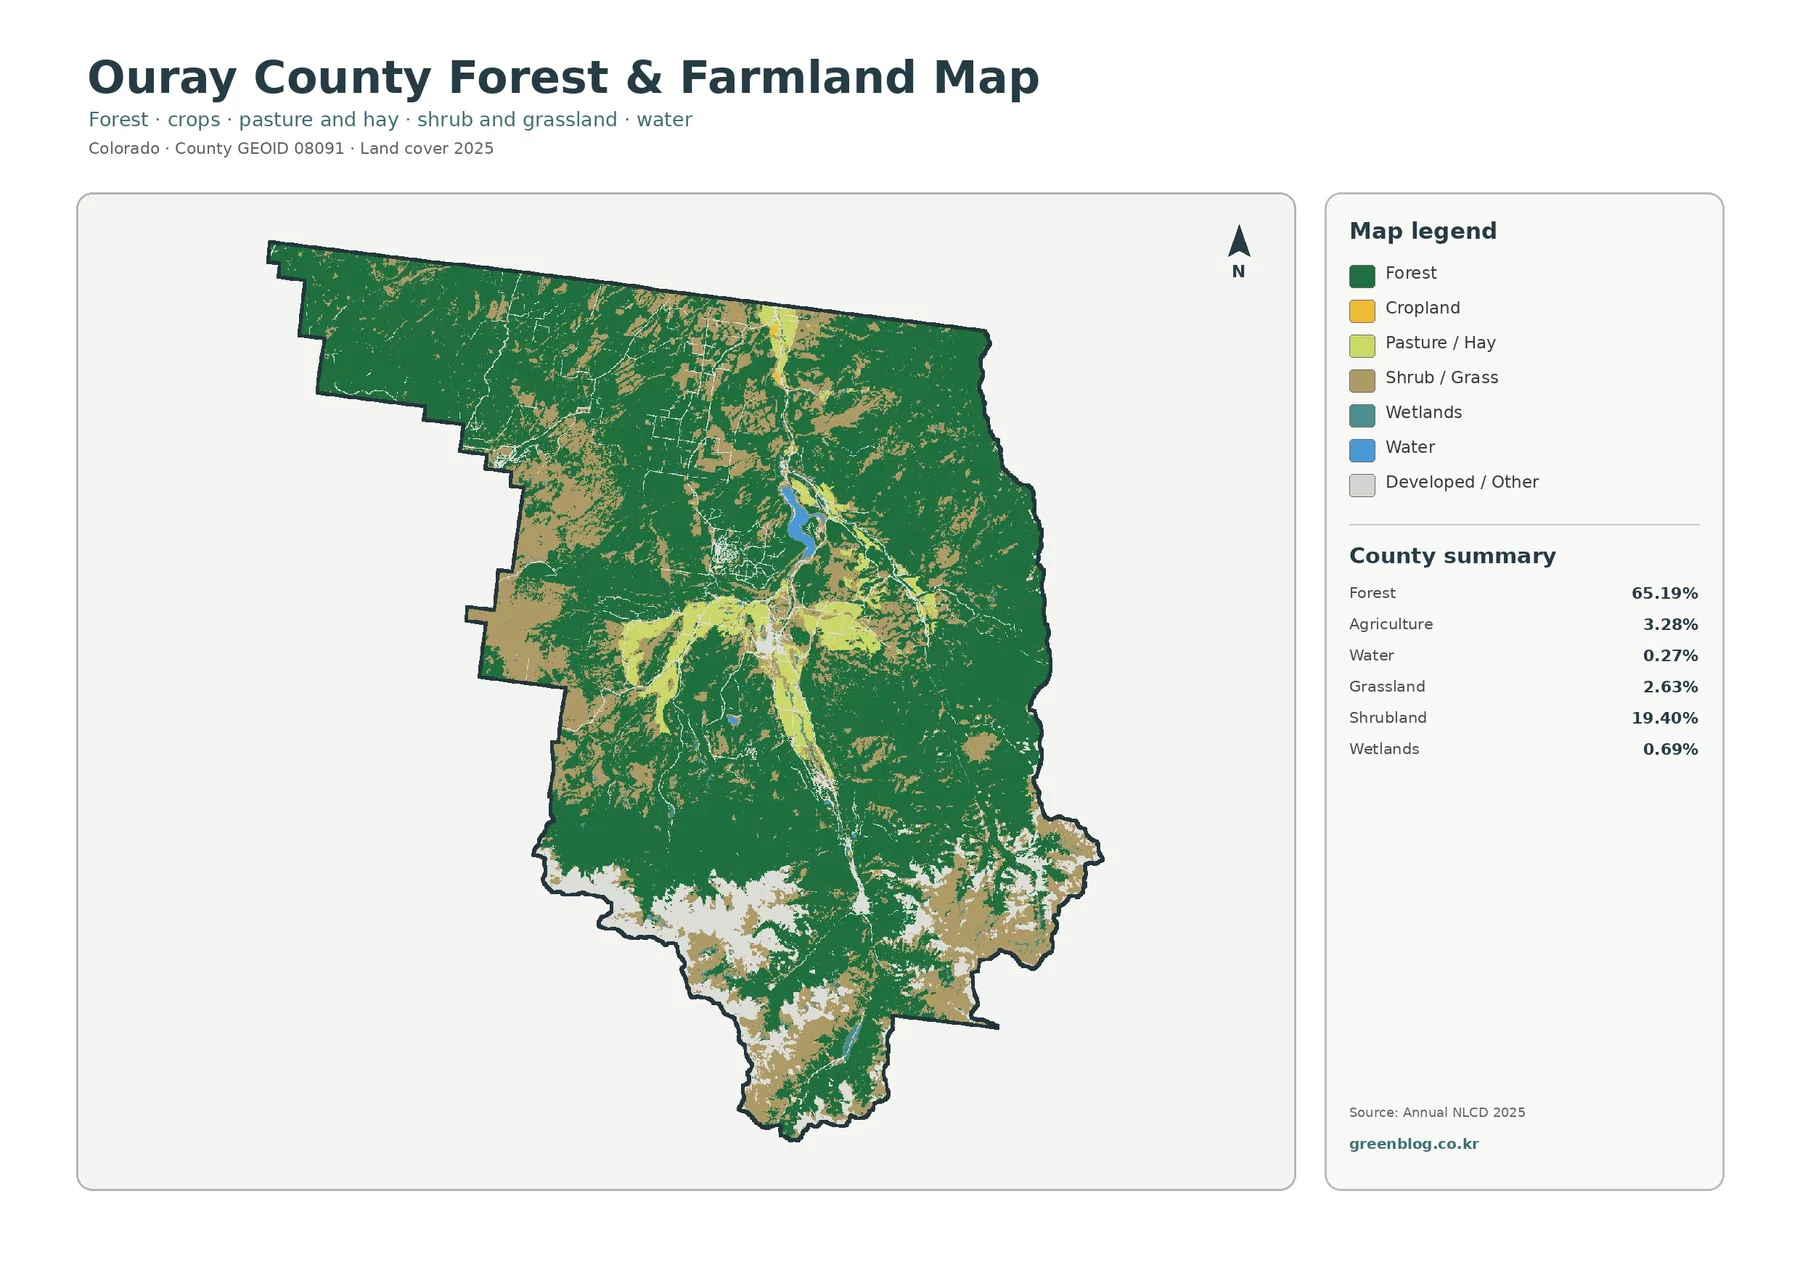
Agriculture represents only 3.28% of the county, yet it is easy to locate because it is concentrated rather than evenly scattered. On the forest and farmland map, yellow and light green agricultural classes gather in the central valley and in flatter pockets that interrupt the surrounding forest. The narrow shape matters. A small countywide percentage can still be visually important when most of it occupies one recognizable corridor.
The official county description identifies the Uncompahgre River Valley as a major part of the local landscape. That helps explain how to read the map without turning the land-cover colors into a claim about legal land use. The agricultural pixels sit mainly in the valley context, while the mountain sides around them remain strongly forested or shrubby. The map does not identify individual ranches or fields, and a yellow agricultural class should not be treated as a parcel boundary.
Water covers 0.27% and wetlands 0.69%. Those values are small, but the map includes a noticeable blue water body in the north-central part of the valley and narrower water or wetland features extending through the same general corridor. Because the surrounding mountain cover is so extensive, these blue and teal features make the valley easier to follow. They are useful reference points for watershed teaching or countywide comparison, but not substitutes for a hydrography map that shows named streams, flow direction, or seasonal conditions.
Readers comparing forest and agriculture should also keep the scale in mind. A countywide raster map generalizes small fields, narrow riparian strips, and roads into cells. Where several surface types share a cell, the assigned class may reflect the dominant signal rather than every feature on the ground. That is why the forest and farmland view is best for broad pattern recognition, not field-by-field measurement.
Development appears as a few concentrated valley footprints
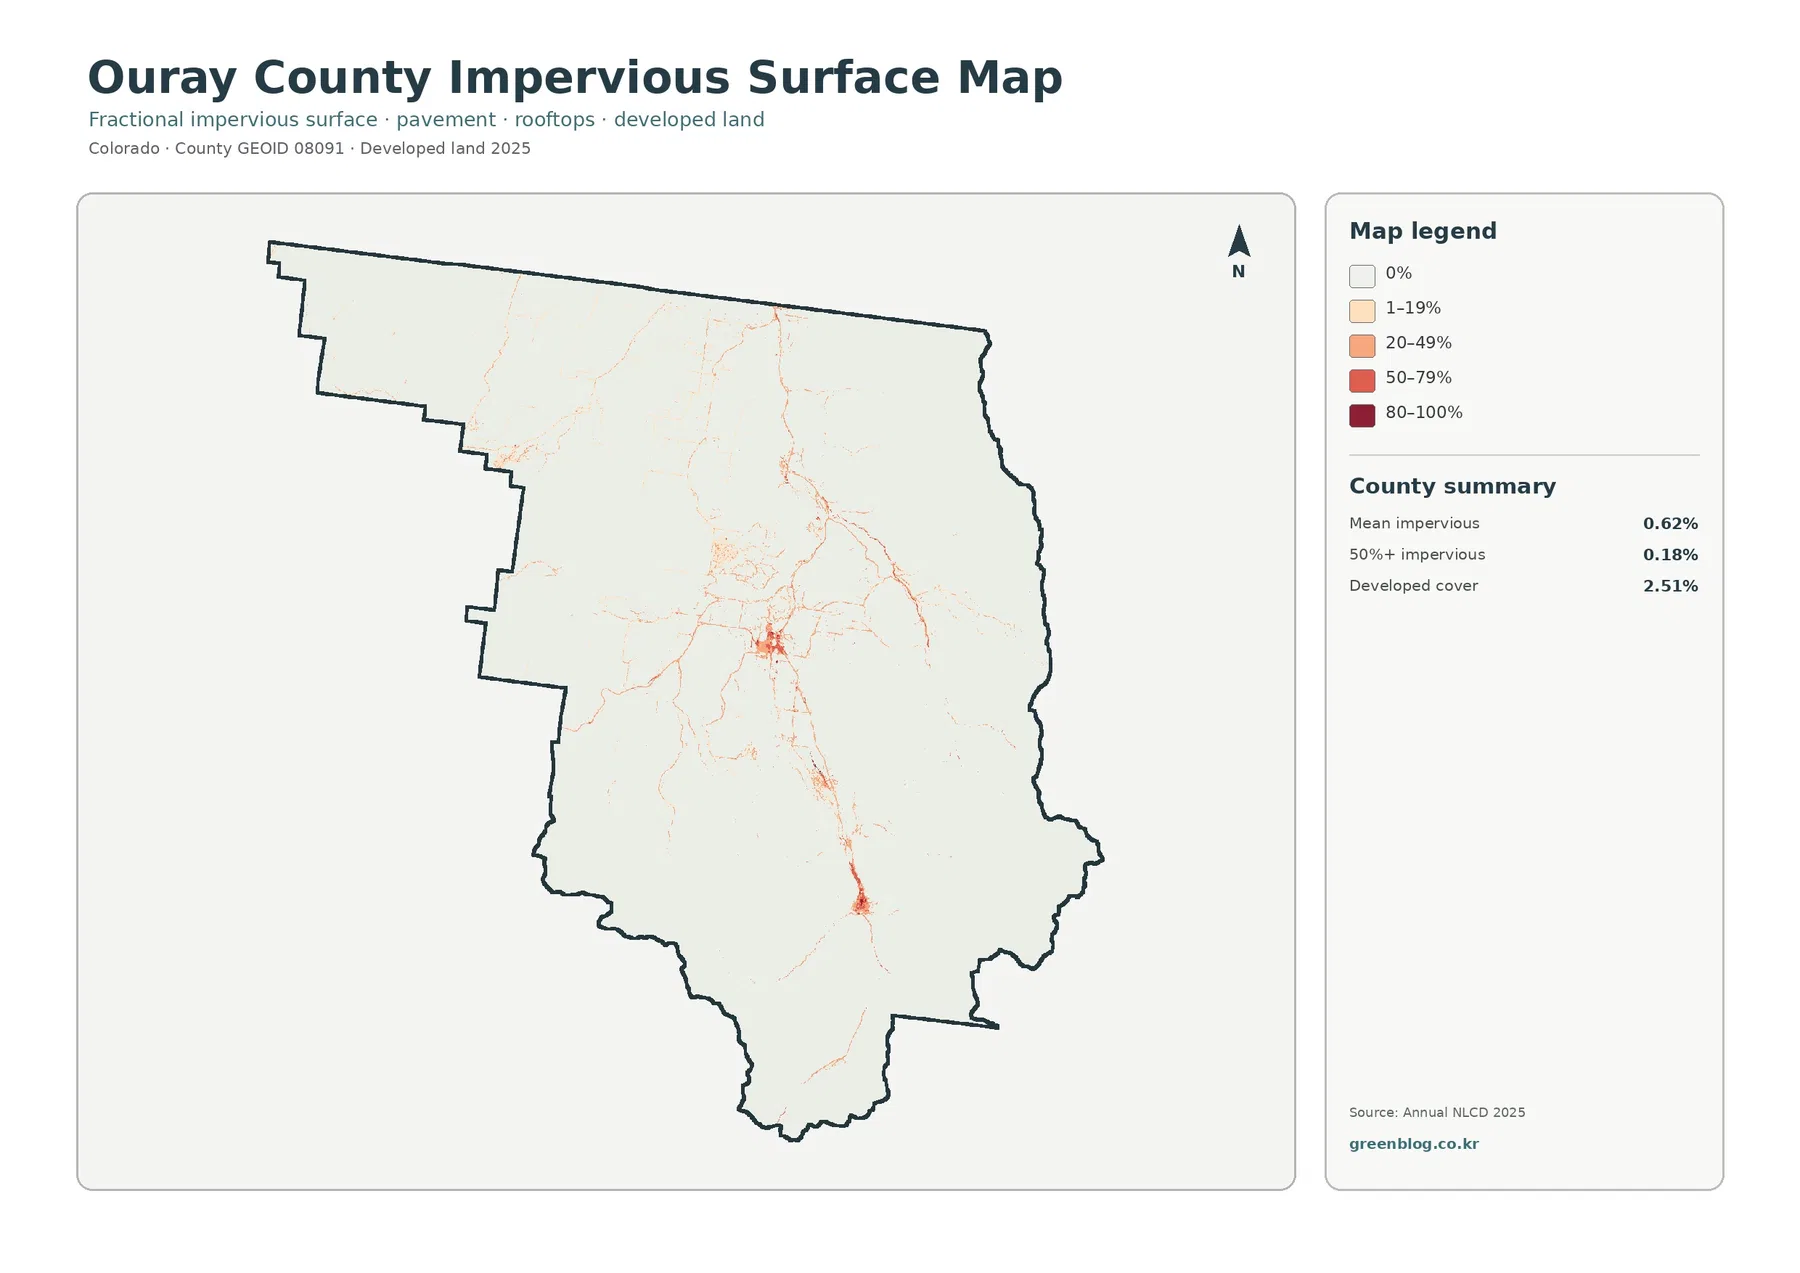
The impervious surface map removes most natural-cover detail and focuses on pavement, rooftops, and other hard surfaces that do not absorb water easily. Ouray County’s mean impervious value is 0.62%, and only 0.18% of the county is mapped at 50% impervious or higher. Developed cover is 2.51%. Those numbers are low because forest, shrubland, barren high country, and other natural surfaces occupy most of the county.
Even so, the hard-surface map is not blank. A stronger cluster appears near the center of the valley, another is visible farther south, and thin red or orange lines connect smaller built features. Ouray County officially lists two municipalities, the City of Ouray and the Town of Ridgway. The map itself does not draw municipal boundaries, so the colored clusters should not be treated as city limits, but the county context helps explain why the strongest impervious signals occur in a few valley locations rather than across the mountains.
This map is especially useful when the general land-cover map makes development look too small to notice. A developed class can include lawns and other permeable surfaces, while the impervious layer highlights the harder parts of the built environment. Comparing both views separates the broader developed category from the most intensely paved or roofed surfaces. The result is a clearer picture of where settlement is concentrated without implying anything about population density or zoning.
For watershed discussions, the impervious layer can be placed beside the water and wetland pattern. That comparison shows where hard surfaces and the valley corridor occur near one another, but proximity alone does not establish flood risk or water-quality impact. Those questions require slope, drainage, soils, precipitation, infrastructure, and other hydrologic information that is not contained in this map set.
Reading the 7.07% mapped difference without turning it into a damage rate
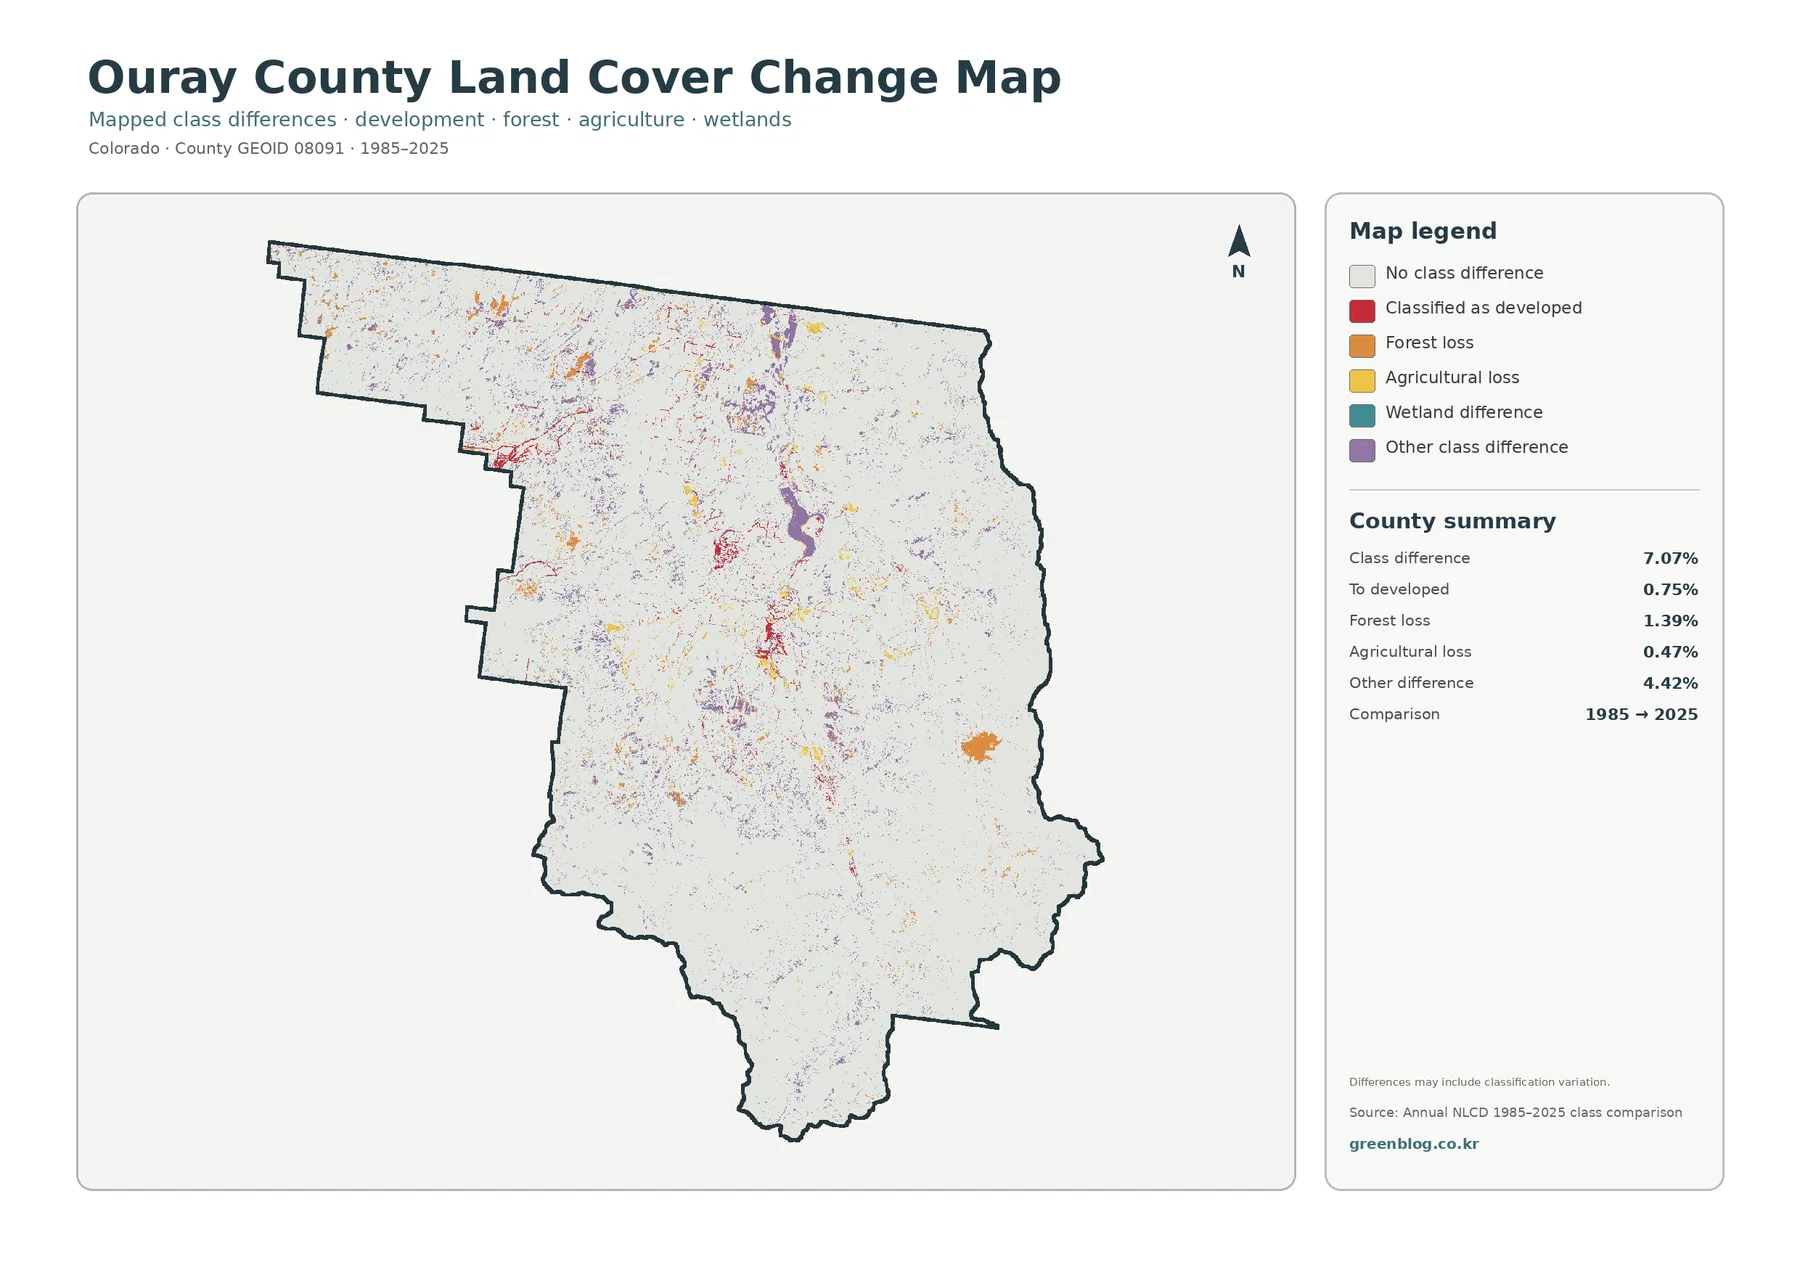
The 1985–2025 comparison map reports a class difference across 7.07% of the county. The supplied summary separates that total into 0.75% classified as developed, 1.39% forest-loss classification, 0.47% agricultural-loss classification, and 4.42% other class difference. Colored patches are scattered through both mountain and valley areas, with some more noticeable concentrations in the central corridor and isolated high-country locations.
The 7.07% figure is not a statement that 7.07% of Ouray County was damaged. It means that mapped cells received different land-cover labels in the two comparison years. Genuine landscape change may be part of the result, but mountain imagery can also be sensitive to snow, seasonal vegetation, moisture, shadows, mixed pixels, and differences in classification. The safe interpretation is to treat the map as a locator for changed classifications, not as a complete history of what happened.
The 1.39% forest-loss category needs the same caution. It should not automatically be labeled logging, fire damage, or permanent forest removal. A highlighted cell can be checked against the 2025 land-cover map and then against intermediate Annual NLCD years, aerial imagery, or documented disturbance records. Only that broader evidence can support a conclusion about cause and duration.
The developed-change category can be cross-checked with the impervious map. Where a red change patch lines up with a current concentration of hard surfaces, the two maps provide complementary evidence that the present landscape is more built than the older classification. Where the layers do not line up clearly, classification uncertainty or a different transition deserves closer review instead of a quick conclusion.
Using the four maps for a mountain-and-valley comparison
Ouray County is easier to explain when the four maps are used in sequence. Start with the 2025 land-cover map to establish the forest-dominated mountain setting. Move to the forest and farmland view to isolate the narrow valley agriculture. The impervious map then reveals the small developed footprints that are easy to miss against the countywide natural cover. Finish with the change map only after the current pattern is familiar, so a highlighted difference is not mistaken for a proven cause.
- Use the 2025 land-cover map for the overall forest, shrubland, barren, agricultural, grassland, water, and wetland pattern.
- Use the forest and farmland map when the main question is how the Uncompahgre Valley differs from the surrounding mountain cover.
- Use the impervious surface map to locate the small concentration of pavement and rooftops associated with valley settlements and roads.
- Use the change map to identify cells assigned to different classes in 1985 and 2025 before consulting more detailed evidence.
The same sequence works well in classroom handouts and presentations because every image uses the same county outline and orientation. A reader can track the valley from one map to the next without learning a new geography each time. At the same time, the maps are generalized raster products, not parcel surveys. Small wetlands, narrow roads, and fine boundaries can be affected by mixed pixels, and changes after the 2025 observation year are not included.
Ouray County’s GIS office also warns that county maps and GIS products are intended for reference and can produce unintended results when used at the wrong scale or for a purpose they were not designed to serve. The same caution applies here. These countywide land-cover maps are suitable for visual comparison and general reference, but property boundaries, legal land use, building decisions, engineering, and detailed habitat work require more precise and current sources.
Download the four Ouray County land cover JPG maps
The ZIP below contains the four original JPG maps described on this page: 2025 land cover, forest and farmland, impervious surface and developed land, and the 1985–2025 class comparison. Each image is 2480×1754 pixels. The supplied asset manifest does not mark them as meeting the A3 high-resolution reference, so they are best used for documents, web publishing, classroom material, and ordinary presentations rather than very large printing or detailed GIS analysis.
Frequently Asked Questions
What is the dominant land cover in Ouray County?
Forest is the dominant 2025 class at 65.19%. Shrubland accounts for 19.40%, barren land 6.02%, agriculture 3.28%, and grassland 2.63%. The forest class covers much of the mountain terrain.
Which map is best for developed areas near Ouray and Ridgway?
Use the impervious surface map. The countywide mean is only 0.62%, but several concentrated spots and narrow road-like lines appear along the Uncompahgre Valley. Compare it with the general land cover map to see the surrounding forest and agricultural cover.
Does the 7.07% difference from 1985 to 2025 mean that 7.07% of the county was damaged?
No. The figure is the share of mapped cells assigned to different land cover classes in the two comparison years. Real change may be included, but image timing, mixed pixels, vegetation condition, and classification differences can also affect the result.
Sources and reference material
Percentages and mapped differences on this page come from the supplied Ouray County Annual NLCD-based map assets. County geography and municipal context are drawn from official Ouray County pages. The federal references below document the land-cover classification and boundary datasets used to understand the map products.
- MRLC Annual NLCD Data
- USGS Annual NLCD Land Cover Classification
- U.S. Census Bureau TIGER/Line Shapefiles
- Ouray County official overview – San Juan Mountains and Uncompahgre River Valley
- Ouray County GIS – map and GIS information
Map File Information
Download all four Ouray County JPG maps in one ZIP: 2025 land cover, forest and farmland, impervious surface and developed land, and the 1985–2025 class comparison.
- Included Files: Use only the versions confirmed in the article and supplied images
- File Type: Use the confirmed download contents
- Intended Use: Printing, education, presentations, and map-based projects
Related Maps
- Adams County Colorado Land Cover Map
- Alamosa County Colorado Land Cover Map
- Arapahoe County Colorado Land Cover Map
Green Map creates custom-edited map images using open geographic data sources such as geoBoundaries, Natural Earth, OpenStreetMap, and government open data.
These maps are edited visual materials, not raw data files, and are provided for education, documents, presentations, and graphic reference.