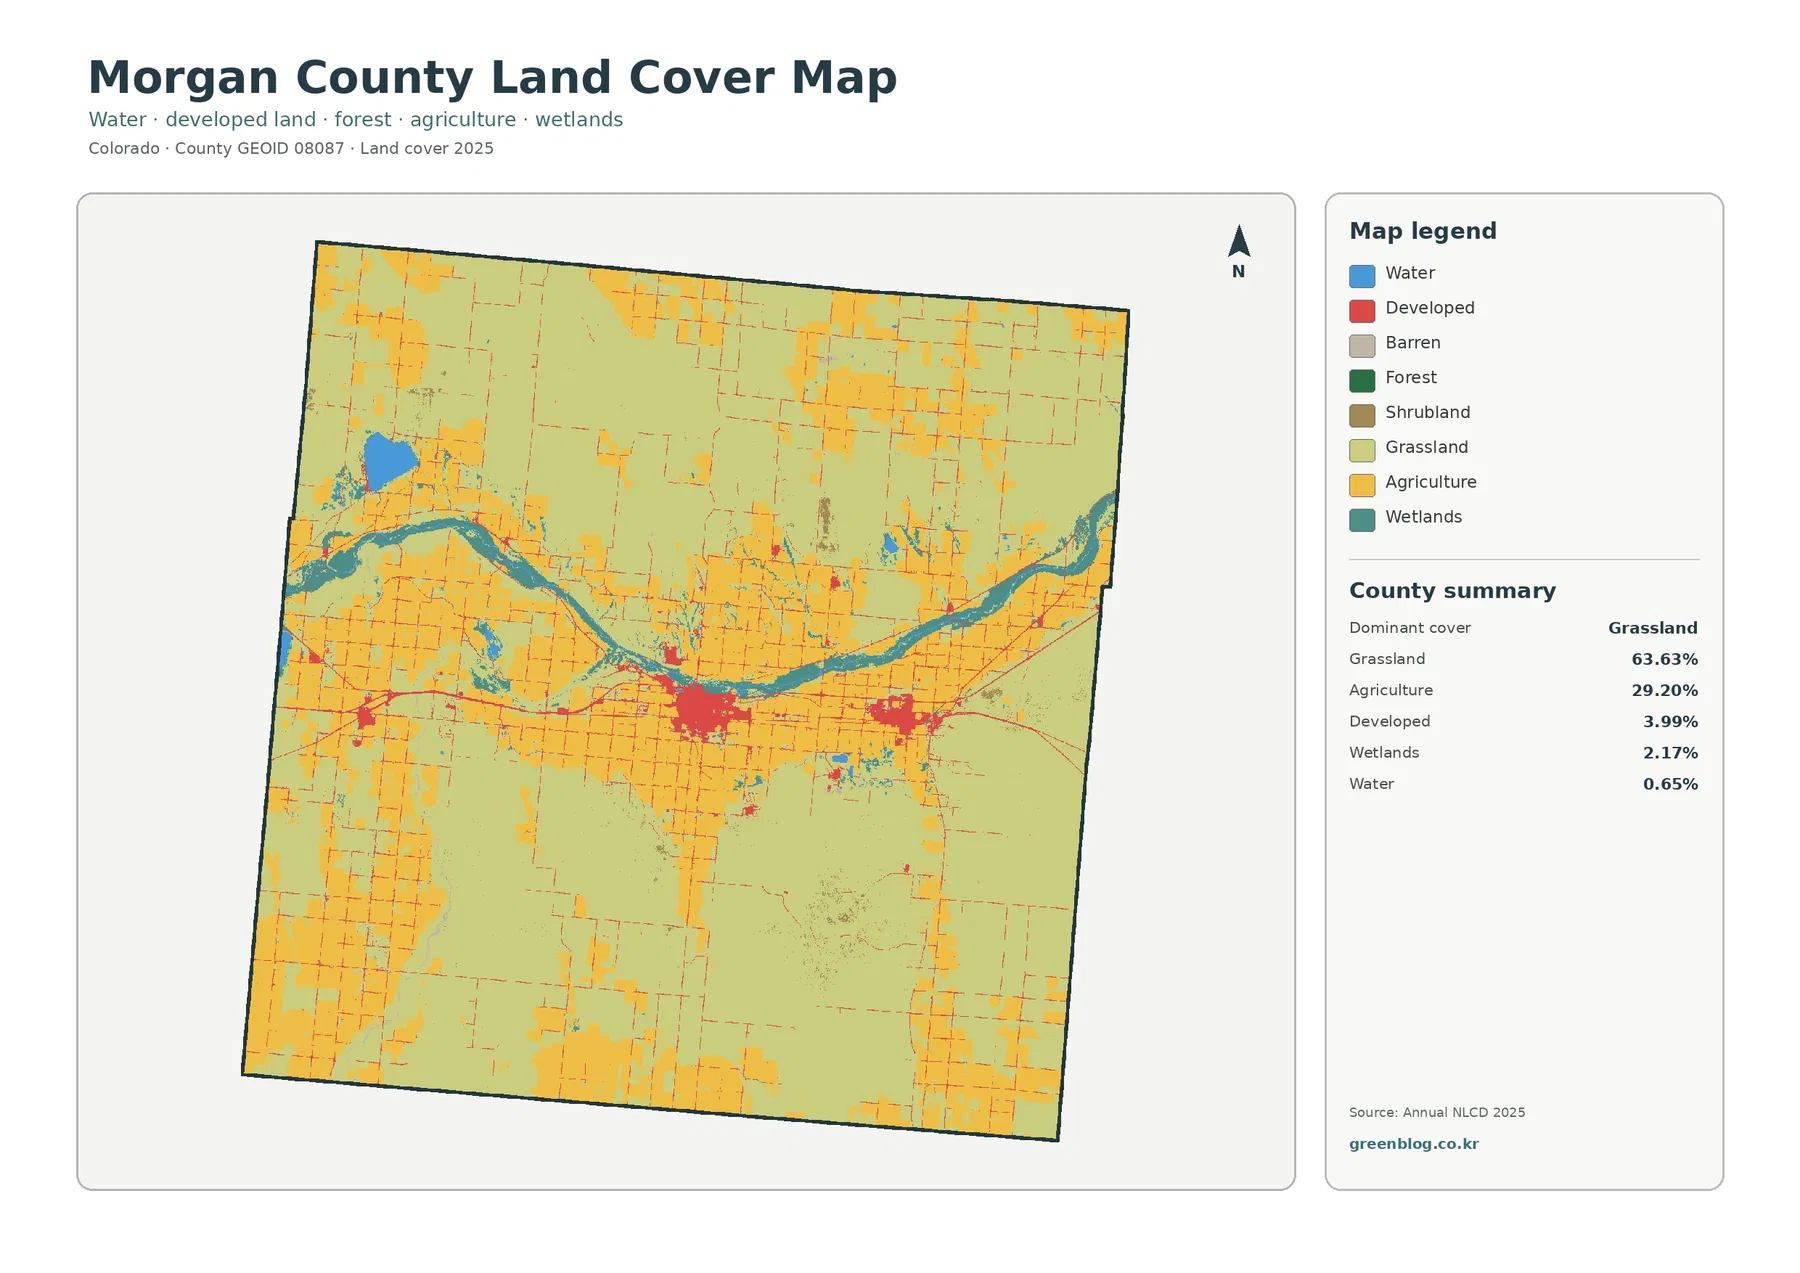
Morgan County lies on Colorado’s northeastern plains, where grassland and cultivated fields dominate the county while the South Platte River adds a narrow band of water and wetlands through the middle of the landscape. The 2025 land-cover summary shows grassland at 63.63% and agriculture at 29.20%. Developed land accounts for 3.99%, wetlands for 2.17%, and water for 0.65%, while forest is mapped at 0.00%. Those numbers immediately separate Morgan County from the forest-heavy mountain counties farther west and make the plains character of the county easy to see.
This page brings together four views of the same county boundary: current land cover, forest and farmland, impervious surface and developed land, and mapped class differences between 1985 and 2025. The WebP images are intended for quick viewing on the page, while the download section provides four original JPG files in one ZIP archive. Because the maps use the same county extent, you can compare farmland blocks, the river corridor, developed areas around Fort Morgan and Brush, and long-term classification differences without trying to align separate maps yourself.
Table of Contents
A plains county shaped by grassland and farm blocks
The current land-cover map is dominated by two colors. Grassland covers broad continuous areas, while agricultural land appears in rectangular and square blocks distributed across much of the county. Farmed areas are especially easy to pick out around the central river corridor and near settled areas, but they also extend north and south into the open plains. The result is not a simple division between farming and grassland. Instead, the two covers form a patchwork that changes gradually across the county.
Grassland and agriculture together account for more than 92% of the 2025 summary. That makes their relationship more important here than the forest-to-development contrast that defines many western Colorado counties. The 29.20% agriculture figure should not be read as a legal land-use percentage, a measure of farm ownership, or a count of active farms. It is a satellite-based land-cover classification describing what the ground surface was mapped as at the time of the dataset.
Water and wetlands occupy much smaller shares of the county, yet their shape makes them visually important. Water covers 0.65% and wetlands 2.17%. Instead of forming large blocks, these classes often appear as narrow, curving features that stand out against the straight-edged farm fields and broad grassland background. Small percentages can therefore have a strong visual presence when they are concentrated along a river and its associated lowlands.
The South Platte corridor breaks up the farm-and-grass pattern
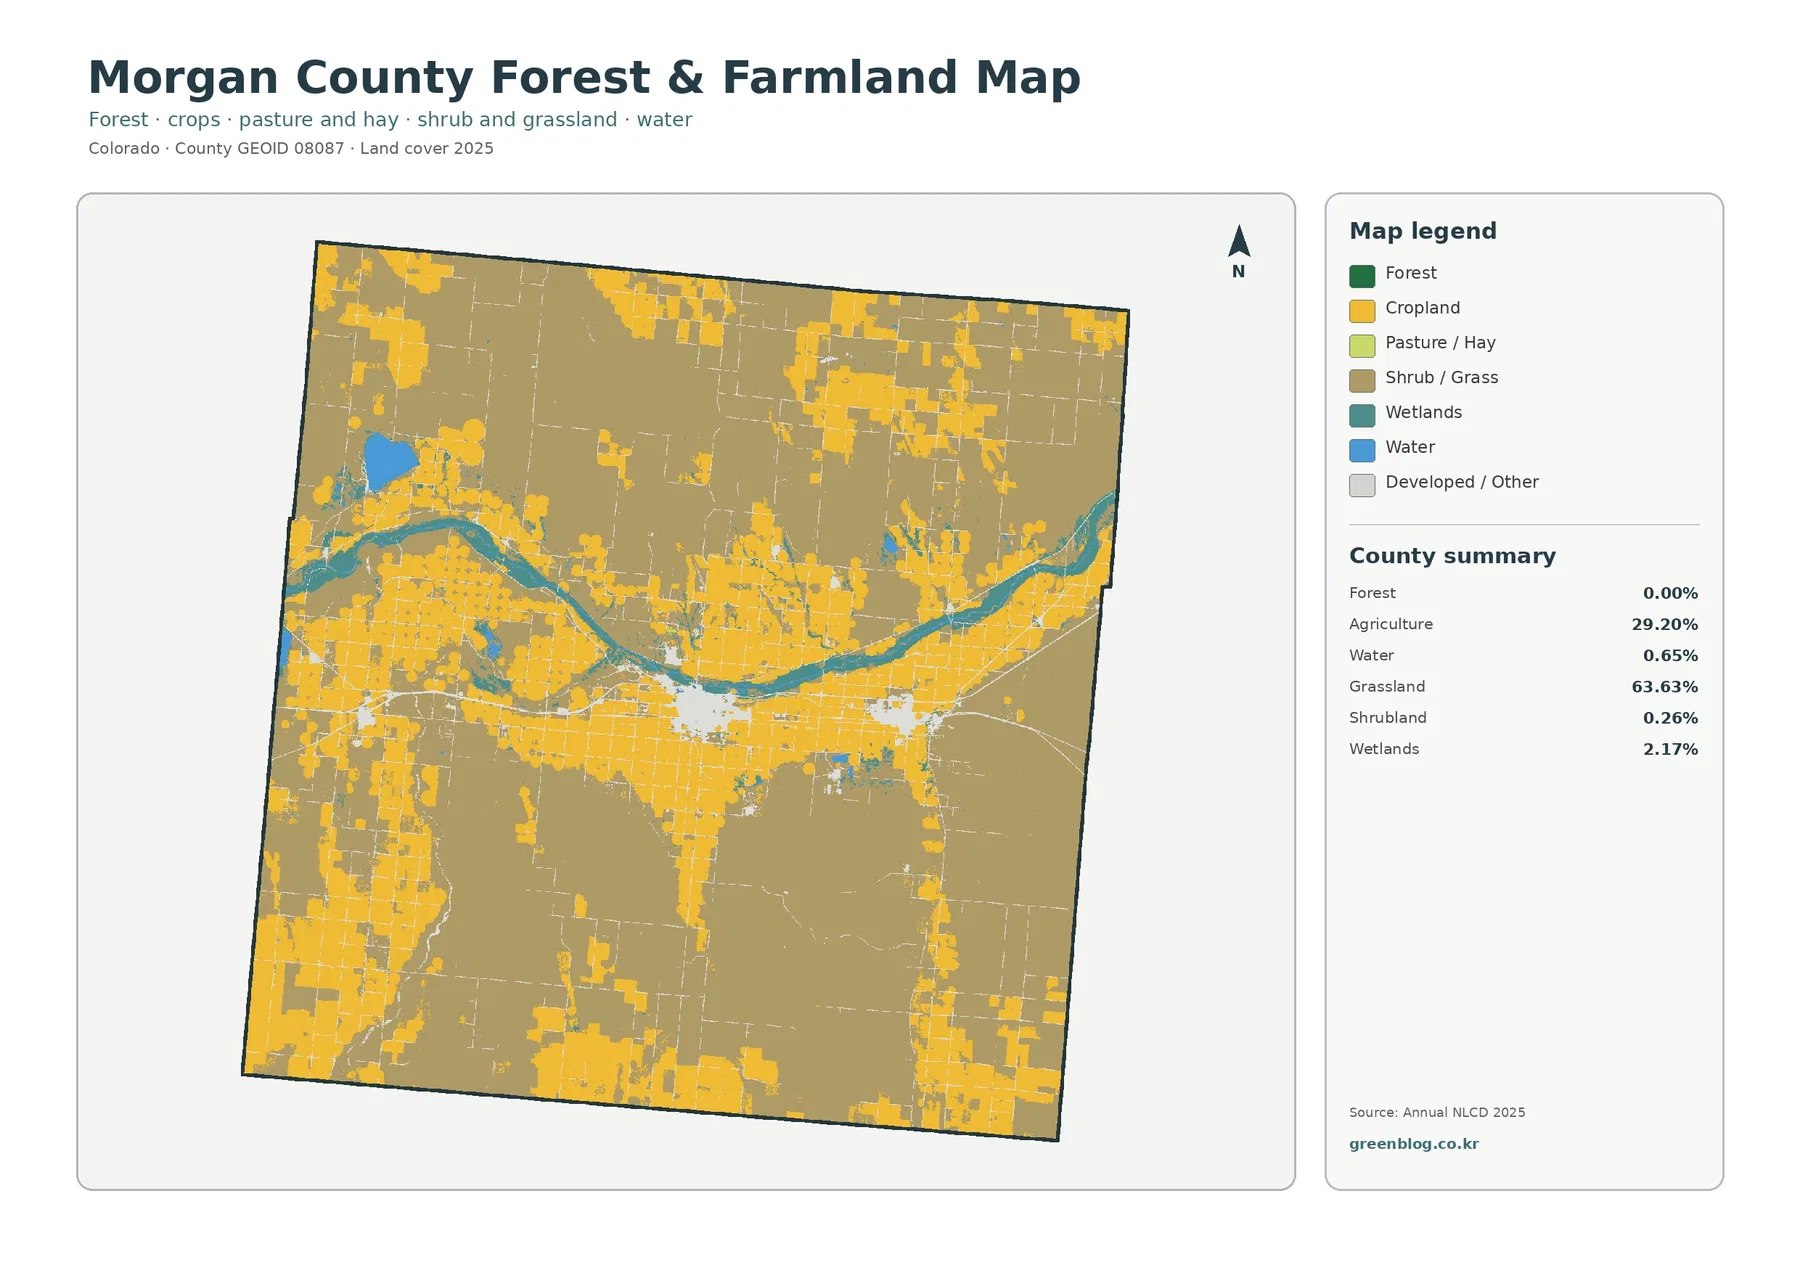
The South Platte River creates the clearest natural line across Morgan County. On the general land-cover map, water and wetlands form a curved east-west band through the central part of the county. The same corridor remains visible on the forest-and-farmland map because its blue and teal classes contrast sharply with the yellow agricultural blocks and the muted grassland background.
The forest-and-farmland view reports forest at 0.00%, so there is little value in searching for large woodland tracts on this map. The useful comparison is among agriculture at 29.20%, grassland at 63.63%, shrubland at 0.26%, wetlands at 2.17%, and water at 0.65%. Agricultural parcels tend to have regular boundaries, while the river and wetland areas follow curved natural shapes. That difference in geometry helps separate managed fields from the water corridor even before reading the legend.
Farm classifications become denser around the central part of the county and continue in blocks toward both the northern and southern plains. The map is useful for identifying where agricultural cover is concentrated, but it does not identify crop type, irrigation source, ownership, or whether a field was actively cultivated throughout the year. Those questions require agricultural statistics, parcel information, or field-level data beyond the land-cover image.
Wetlands near the South Platte are also worth comparing with the change map, but the colors should be interpreted cautiously. A mapped difference between 1985 and 2025 does not by itself prove that a wetland was physically lost or created. Water level, seasonal conditions, image timing, vegetation state, and classification methods can all affect the category assigned to a pixel.
Fort Morgan and Brush stand out on the impervious-surface map
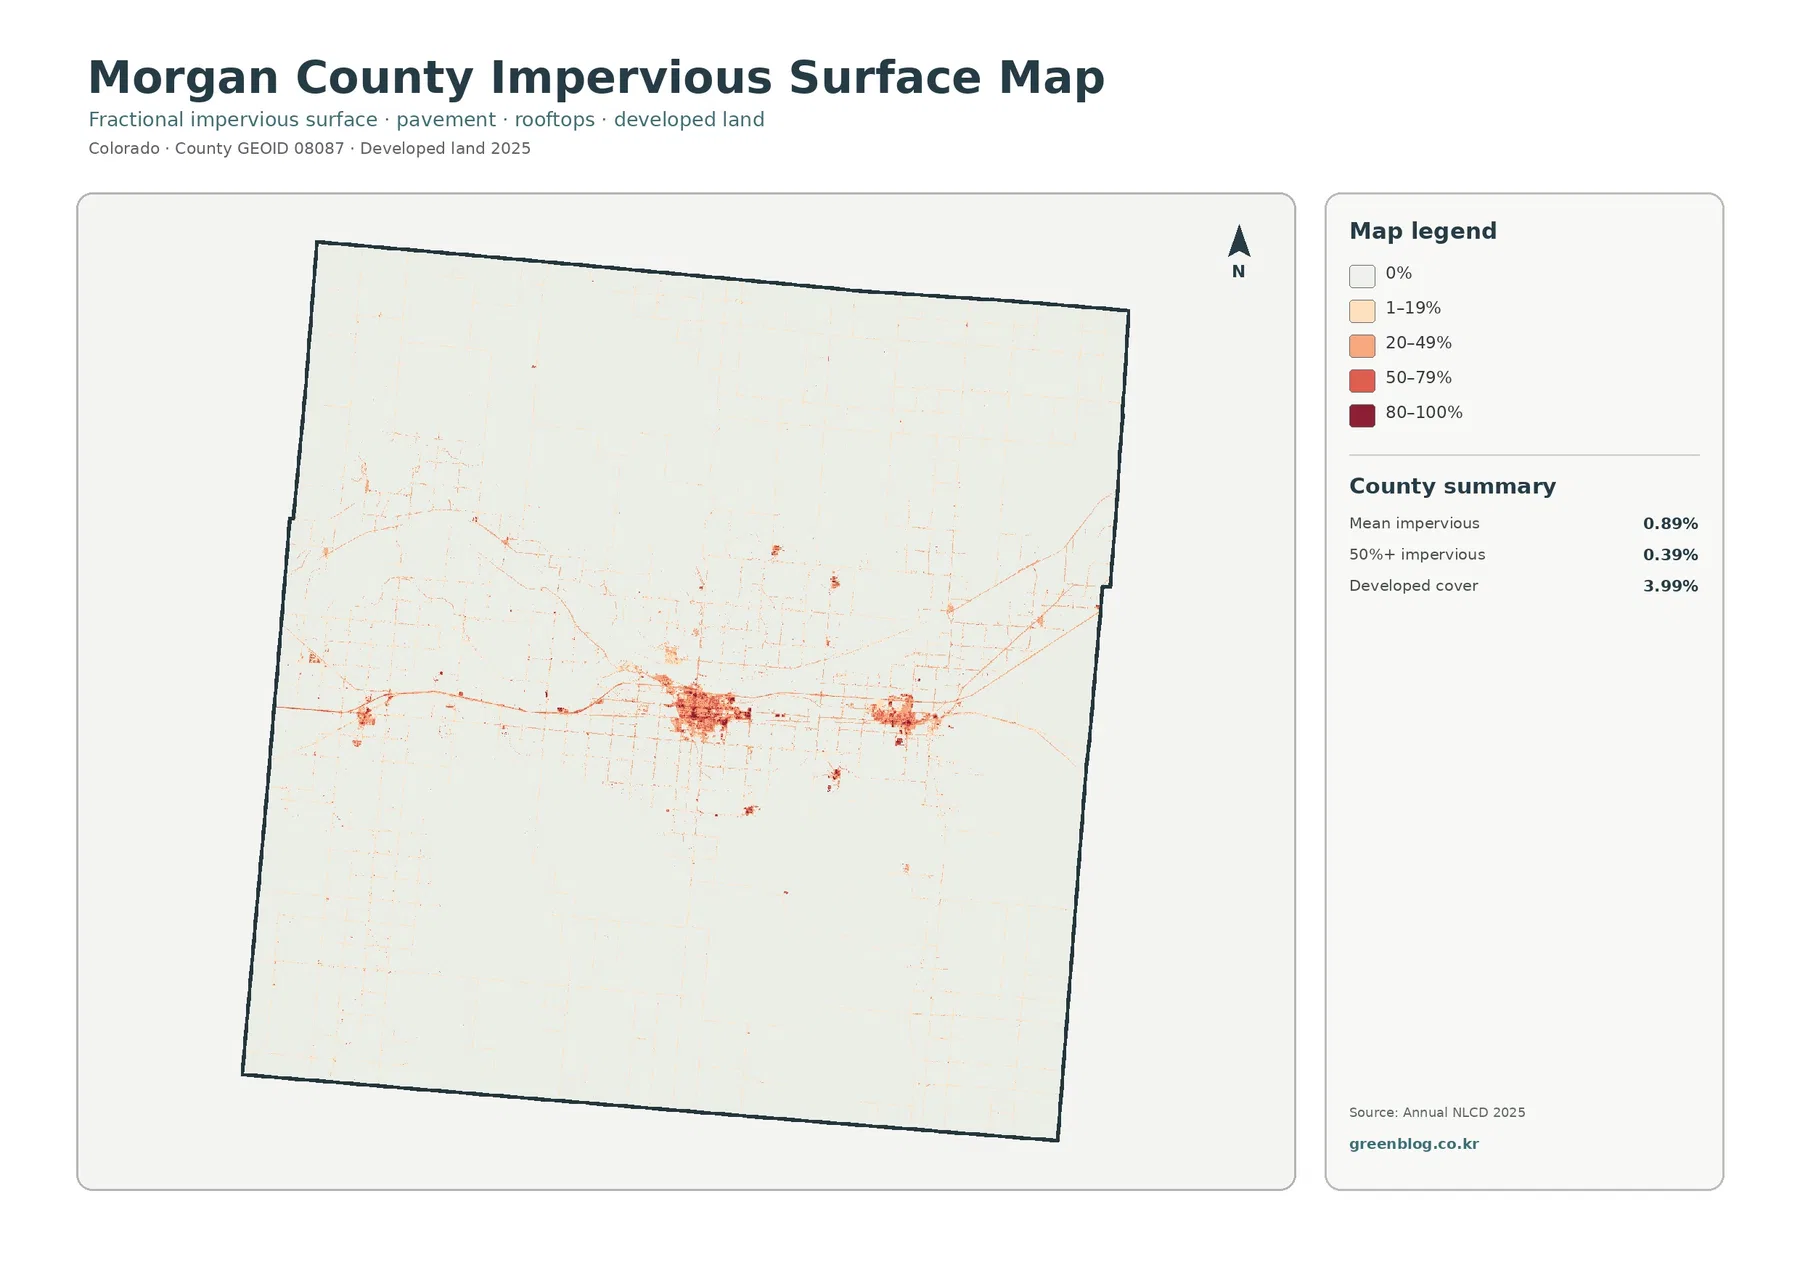
Developed land covers only 3.99% of Morgan County, but the impervious-surface map makes that small share easy to locate. The strongest concentration appears around Fort Morgan, with another distinct cluster around Brush. Narrow lines extend outward from the developed areas, reflecting roads and other hard surfaces that connect settled places across an otherwise lightly impervious county.
The mean impervious value is 0.89%, and only 0.39% of the county is mapped at 50% or more impervious cover. Those countywide numbers are low because Morgan County contains so much open grassland and agricultural land. Within the towns and along major roads, however, the local values are much higher than the average. Looking only at the mean would hide that concentration, which is why the map itself is more informative than the single countywide statistic.
Impervious surface is not the same thing as a municipal boundary or zoning map. It estimates surfaces such as rooftops, pavement, and other hard areas where water does not readily soak into the ground. A park inside a town may therefore appear less impervious than nearby blocks, while a road or facility outside a town can still register as a hard-surface feature.
The impervious map works best when paired with the general land-cover view. The first map shows developed land mixed with agricultural and grassland classes, while the impervious map isolates the hard-surface pattern around Fort Morgan, Brush, and connecting routes. Together they show both the land-cover category and the intensity of built surfaces without treating the two measures as interchangeable.
What the 13.84% class difference from 1985 to 2025 means
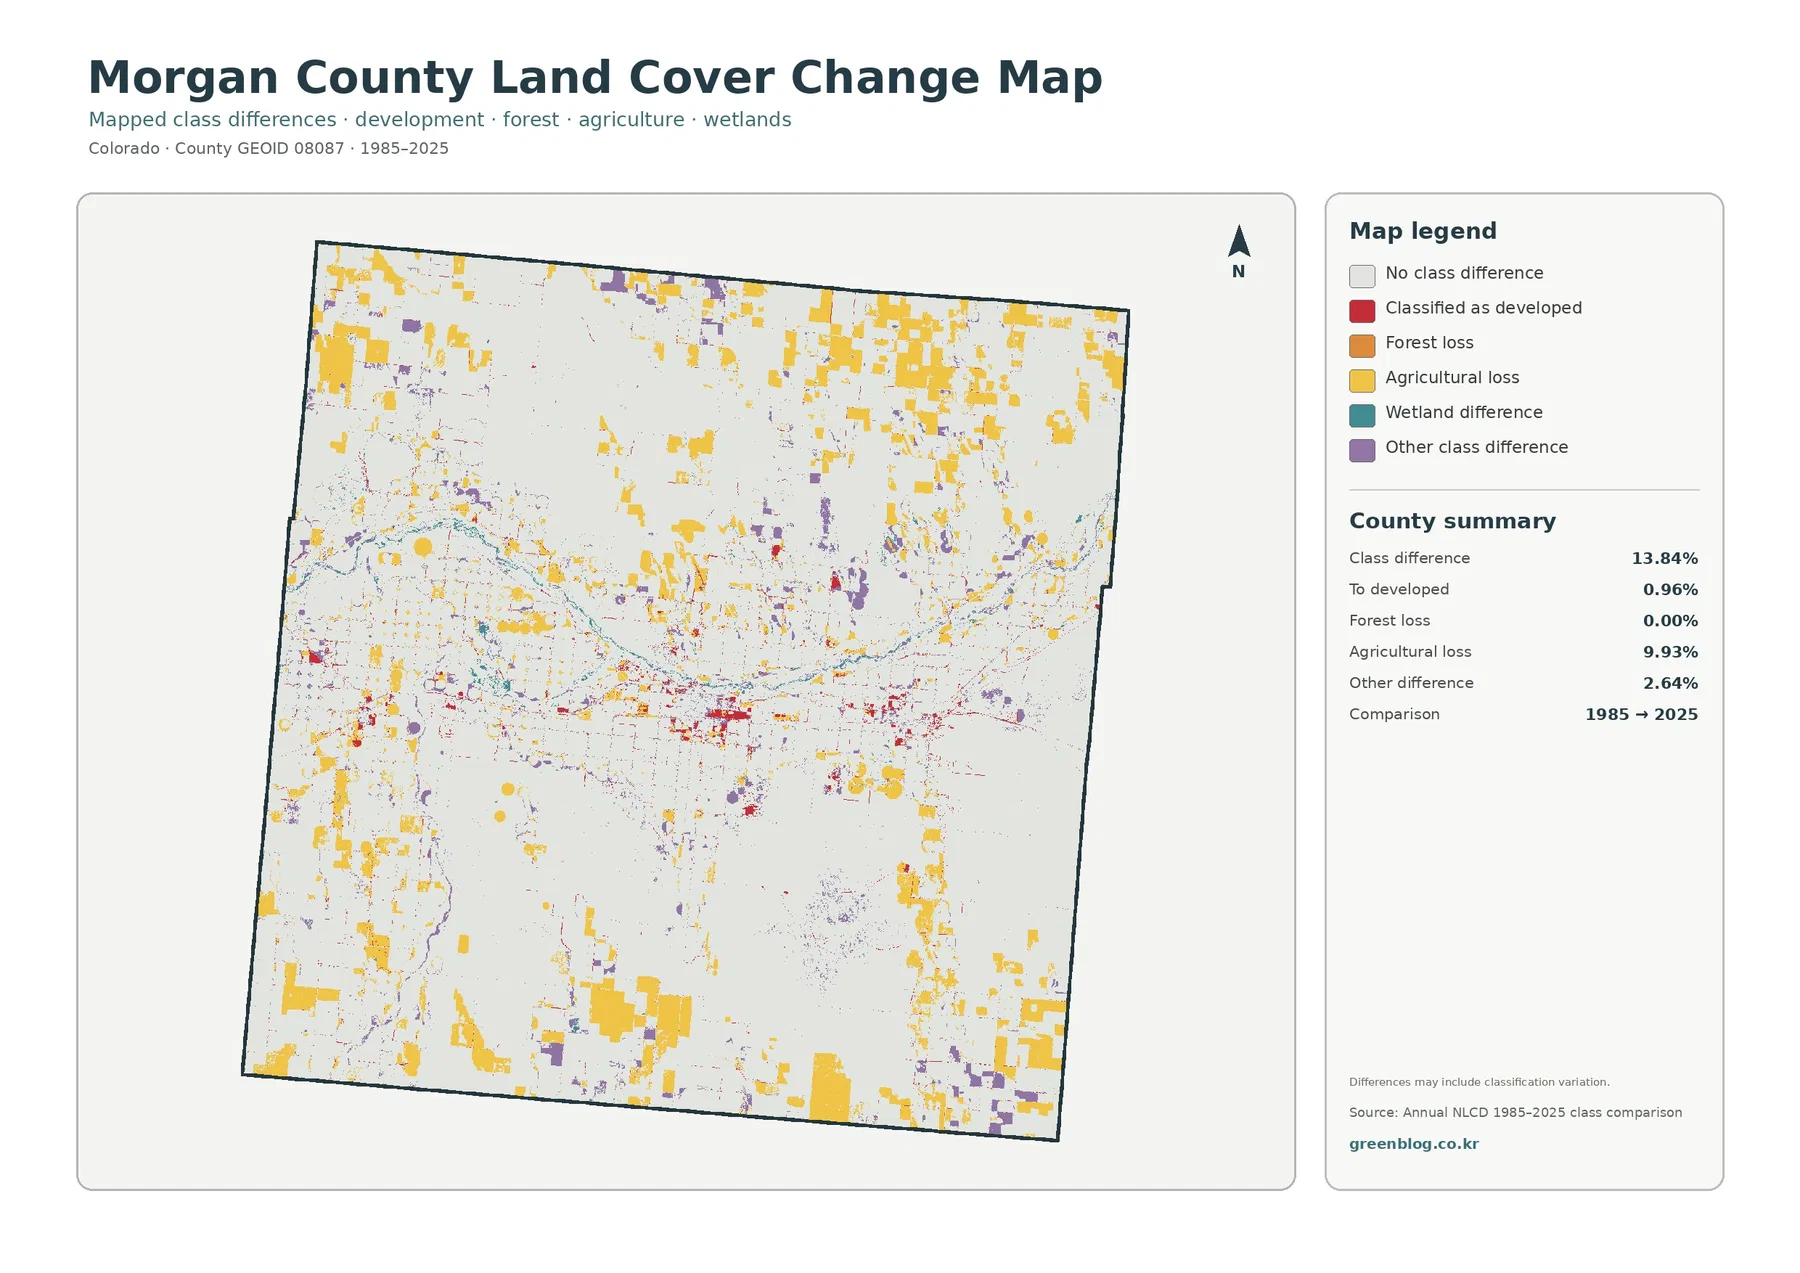
The change map compares the 1985 and 2025 classifications and marks 13.84% of the county as having a different mapped class. The summary identifies 0.96% as classified to developed, 9.93% as agricultural loss, 0.00% as forest loss, and 2.64% as other class difference. Agricultural-loss colors are therefore the most widespread named change category on the map.
That 13.84% should not be described as a damage rate or a direct measure of land conversion. It is the share of cells whose mapped land-cover class differs between the two comparison years. Real conversion can be part of the pattern, but crop condition, fallow fields, seasonal moisture, image quality, mixed pixels, and differences in classification can also change the category assigned to a location. Agricultural landscapes are especially sensitive to the timing of imagery because a field can look very different from one season to another.
A practical way to use the map is to locate the largest change patches first and then compare those places with the 2025 land-cover map. If a location marked as agricultural loss is now grassland, developed land, or another class, the current map helps describe the direction of the classification difference. Confirming why it changed requires more evidence, such as intermediate-year imagery, agricultural records, planning documents, or development permits.
Around Fort Morgan and Brush, the areas classified to developed can be compared with the current impervious-surface concentrations. In the outer plains, the broader yellow patches are more useful for finding places where agricultural classification differs between the two years. Treating the change layer as a screening map rather than a final explanation produces a more accurate reading of the data.
How to use the four Morgan County maps together
Start with the 2025 general land-cover map when you need a quick overview. It shows the balance between 63.63% grassland and 29.20% agriculture, the South Platte water-and-wetland corridor, and the small developed areas in one frame. Once that broad pattern is clear, the other maps answer more focused questions without losing geographic context.
Use the forest-and-farmland view when field patterns are the main interest. With forest mapped at 0.00%, the simplified legend makes agricultural blocks, grassland, shrubland, wetlands, and water easier to compare. Use the impervious-surface map for Fort Morgan, Brush, roads, rooftops, and other hard surfaces. Save the change map for last, after you know what the current cover looks like, because its colors describe differences between years rather than current land cover.
- Use the 2025 land-cover map for the full county pattern and percentage context.
- Use the forest-and-farmland map to separate agricultural blocks from grassland, wetlands, and water.
- Use the impervious-surface map to locate concentrated hard surfaces around Fort Morgan, Brush, and road corridors.
- Use the 1985–2025 change map to screen for places where the mapped class differs between the two comparison years.
For a classroom handout or a county comparison, placing the four maps in this order also works well. The first image establishes the current landscape, the second simplifies the farm-versus-natural-cover relationship, the third isolates built surfaces, and the fourth adds a time comparison. Because the maps share the same county outline, readers can move from one map to the next without having to reorient the location.
Download the four Morgan County land-cover JPG maps
The ZIP below contains the four Morgan County JPG maps described on this page. Each image is 2480×1754 pixels, which is useful for documents, presentations, and moderate-size printing. The supplied asset manifest does not mark these files as meeting the project’s A3 high-resolution reference, so they should not be presented as full A3 production files. For detailed GIS analysis or larger cartographic output, use the underlying Annual NLCD data rather than the rendered JPGs.
Frequently Asked Questions
What is the dominant land cover in Morgan County, Colorado?
Grassland is the largest 2025 class at 63.63%, followed by agriculture at 29.20%. Together they cover more than 92% of the county, while developed land, wetlands, and water occupy much smaller shares.
Which map is best for Fort Morgan and Brush development?
Use the impervious surface and developed land map to locate pavement, rooftops, and other hard surfaces around Fort Morgan and Brush. Compare it with the general land cover map to see how developed areas sit within the surrounding agricultural and grassland landscape.
Does the 13.84% 1985–2025 class difference mean that much land was damaged?
No. The 13.84% value is the share of cells assigned different land cover classes in the two comparison years. Real change can be included, but image timing, crop condition, moisture, mixed pixels, and classification differences can also affect the result.
Sources and reference material
The percentages and change summaries on this page come from the supplied Morgan County map assets based on Annual NLCD data. Land cover describes the physical surface observed by the classification and should not be treated as a legal land-use, ownership, or zoning map. Use the county regulations and official data portals below when you need planning, floodplain, boundary, or source-data details.
- MRLC Annual NLCD Data
- USGS Annual NLCD Land Cover Classification
- U.S. Census Bureau TIGER/Line Shapefiles
- Morgan County Zoning Regulations
Map File Information
Download the 2025 land cover, forest and farmland, impervious surface, and 1985–2025 class-difference maps together in one ZIP file.
- Included Files: Use only the versions confirmed in the article and supplied images
- File Type: Use the confirmed download contents
- Intended Use: Printing, education, presentations, and map-based projects
Related Maps
- Adams County Colorado Land Cover Map
- Alamosa County Colorado Land Cover Map
- Arapahoe County Colorado Land Cover Map
Green Map creates custom-edited map images using open geographic data sources such as geoBoundaries, Natural Earth, OpenStreetMap, and government open data.
These maps are edited visual materials, not raw data files, and are provided for education, documents, presentations, and graphic reference.