Moffat County is dominated by open shrub-covered country rather than cropland or urban development. In the 2025 summary, shrubland accounts for 79.25 percent of the county, followed by forest at 15.50 percent. Grassland is 2.39 percent, agriculture 1.24 percent, and developed cover 0.91 percent. The broad brown interior is broken by larger forest patches along the west and south, a few open grass areas, narrow river-related features, and one conspicuous developed cluster around Craig.
Four matching maps are provided here: current land cover, forest and farmland, impervious/developed land, and mapped class differences between 1985 and 2025. The WebP versions are intended for on-page comparison, while the four original JPG maps are available together in the download ZIP. Because every layer uses the same county outline, a reader can move from the dominant shrubland pattern to the Yampa River corridor, the Craig built footprint, and long-term class differences without having to realign separate maps.
Table of Contents
Start with the 2025 pattern: shrubland covers nearly four-fifths of the county
The general land-cover map makes Moffat County look very different from an irrigated plains county or a Front Range urban county. Shrubland fills 79.25 percent of the mapped area and forms the continuous background across much of the center and north. Forest, at 15.50 percent, appears in larger blocks rather than as an even countywide cover. The strongest green areas sit along parts of the western and southern margins, with another substantial forested area near the eastern edge.
The smaller classes matter because they help locate changes in terrain and human activity. Grassland represents 2.39 percent and appears as scattered lighter patches within the shrub-dominated interior. Agriculture is only 1.24 percent and is concentrated in small areas rather than a broad farming belt. Developed cover is 0.91 percent, with the clearest red patch near Craig. Water is 0.20 percent and wetlands 0.33 percent, so they occupy little total area but create narrow features that stand out against the much larger upland classes.
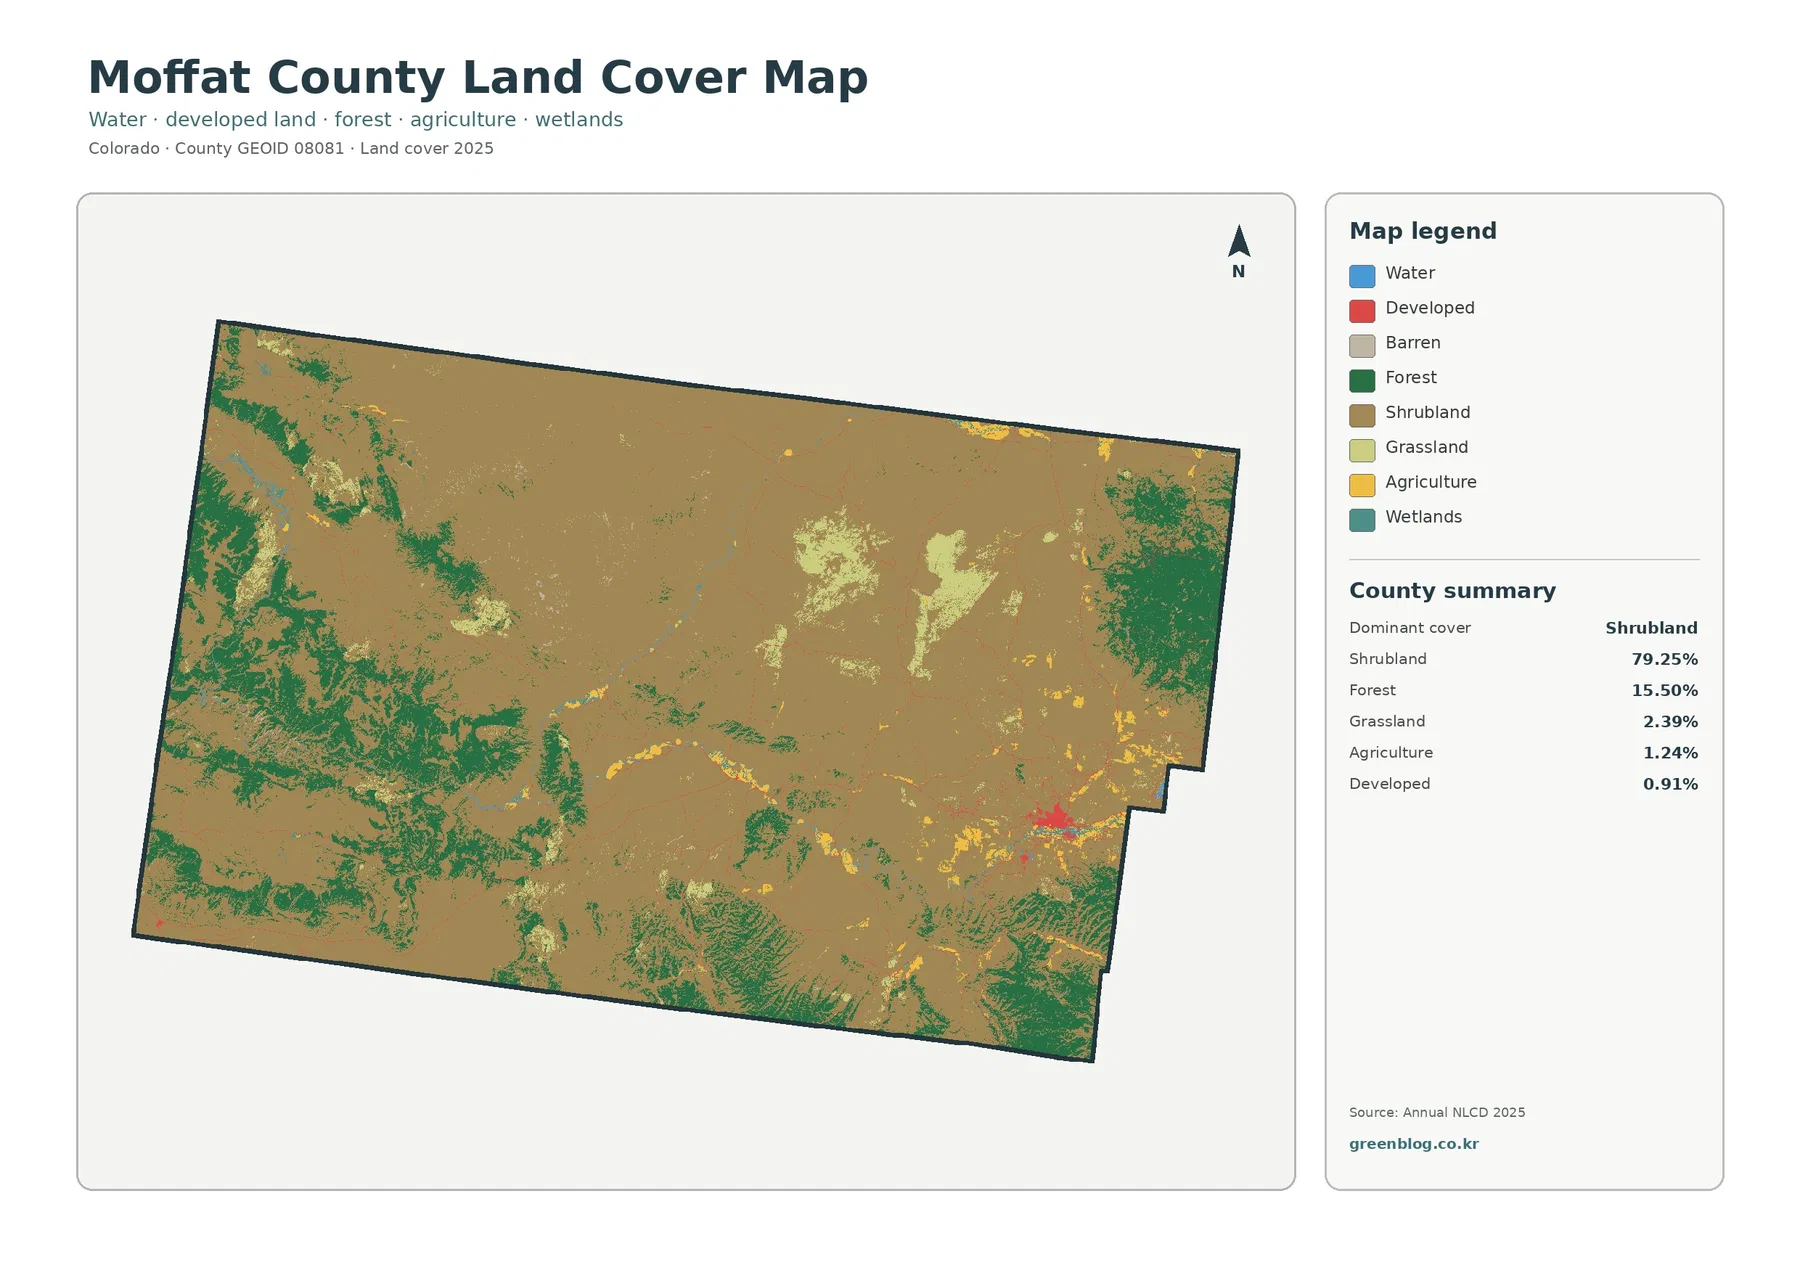
Shrubland should not be read as vacant or unused land. Annual NLCD classifies the physical surface, and BLM descriptions of western Moffat County mention sagebrush, native grass, pinyon-juniper woodland, ponderosa pine, and related vegetation communities. That regional context fits the map’s large shrub-dominated areas and forest patches, but the land-cover layer does not identify plant species at each pixel. It is best used to show broad surface cover, not detailed vegetation inventories.
The forest-and-farmland view separates a small agricultural footprint from extensive natural vegetation
A simplified vegetation map is useful here because the current land-cover layer contains several natural classes that can be hard to compare at once. In the forest-and-farmland version, the county is still overwhelmingly shrub-dominated, while forest stands out clearly in the west, southwest, south, and parts of the east. The contrast is not subtle: 79.25 percent shrubland and 15.50 percent forest together account for most of the county.
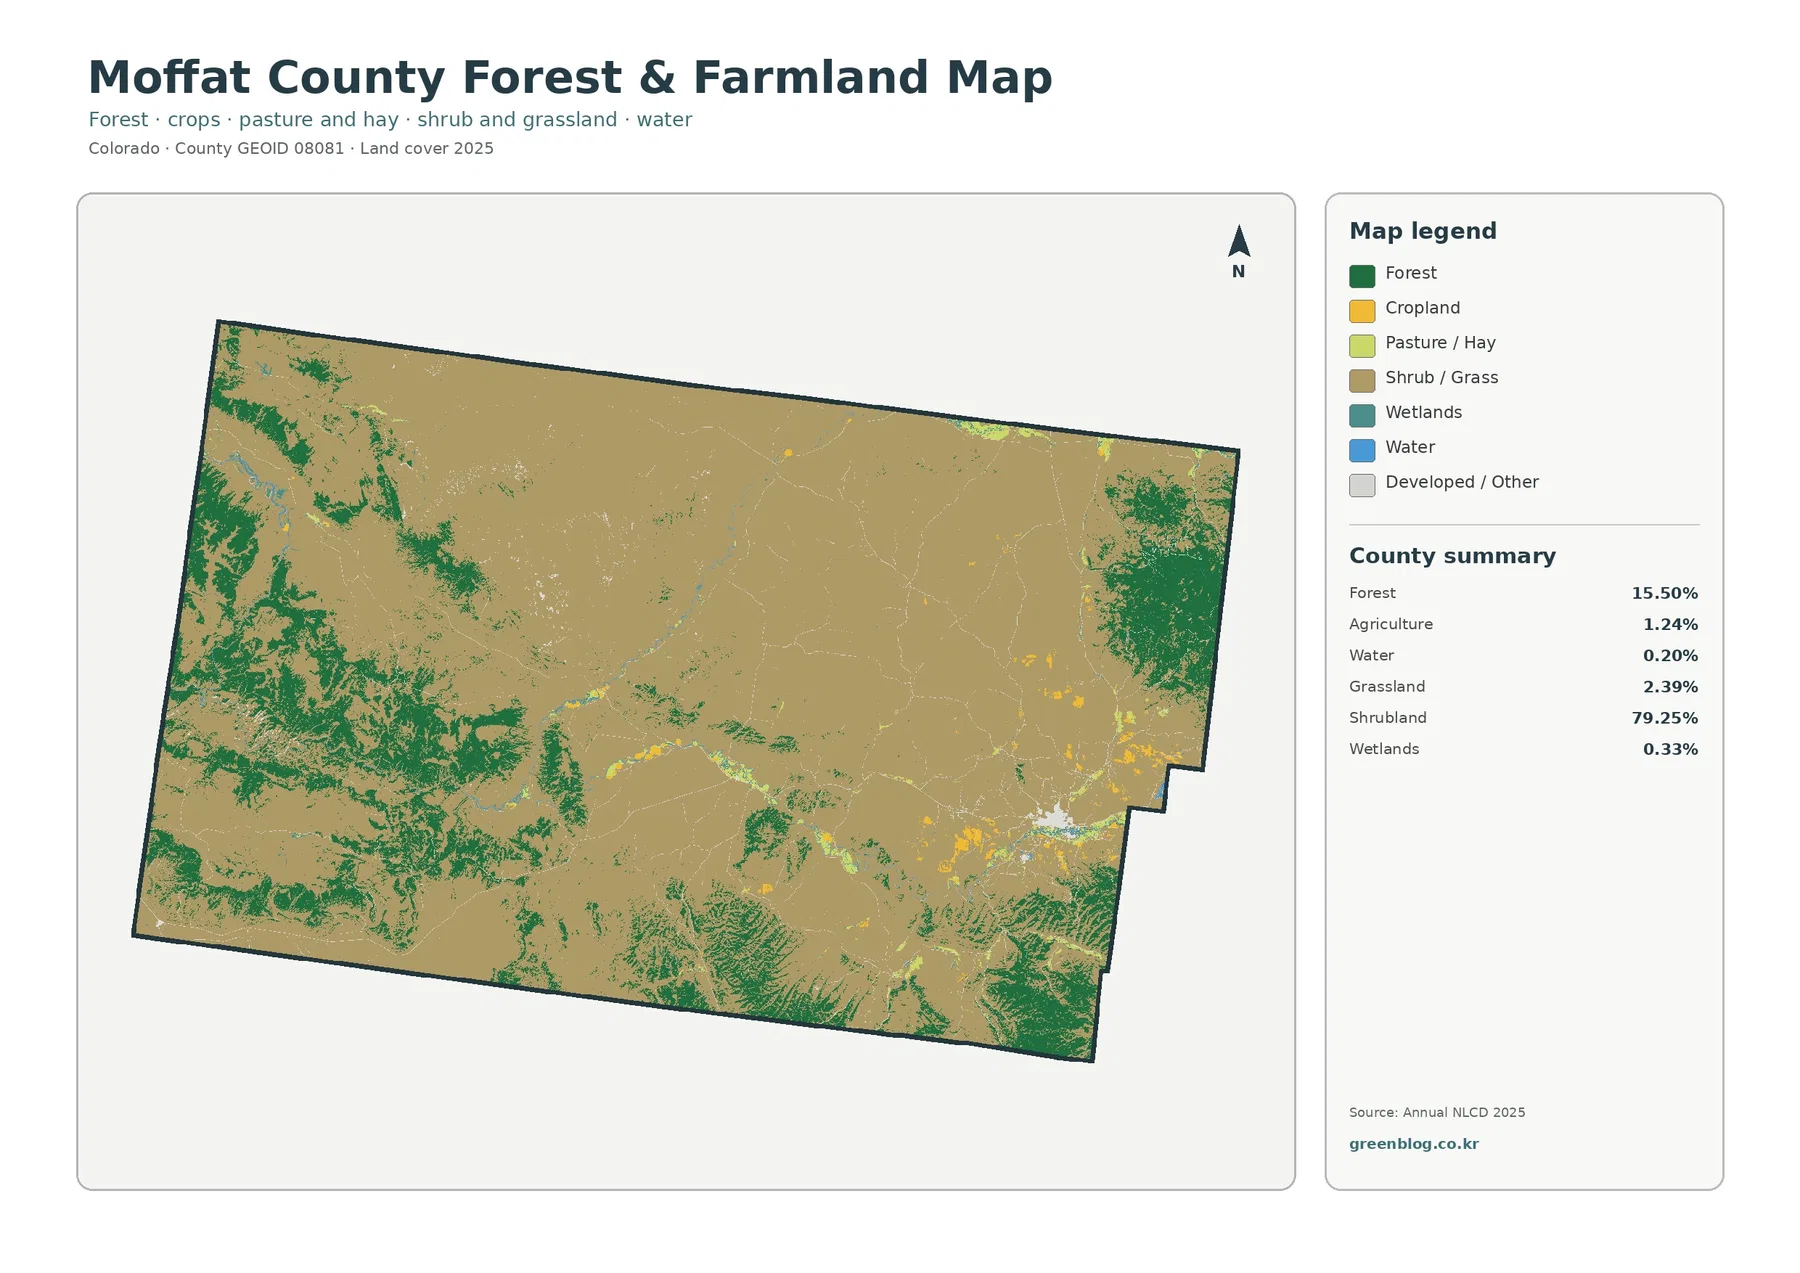
Agriculture at 1.24 percent appears as small yellow areas, especially toward the eastern half and near flatter river-related settings. It does not form a continuous agricultural plain. This number is an NLCD land-cover classification, not a count of farms or an estimate of agricultural production. Grazing can also occur on shrubland and grassland that remains classified as natural cover, so the agricultural percentage should not be treated as the total area used by ranching or livestock operations.
Forest is also a broad class rather than a detailed forest inventory. BLM pages for the county’s western wilderness study areas describe combinations of ponderosa pine, pinyon-juniper woodland, aspen, sagebrush, and native grass. The NLCD map simplifies those communities into wider categories. A question about tree species, canopy condition, wildfire effects, or forest treatment needs a more specialized dataset.
The Yampa corridor is a narrow feature inside a very large shrubland landscape
Water and wetlands occupy small percentages of Moffat County, yet their shape makes them useful geographic guides. BLM planning material describes the Yampa River as running generally east to west through the county, with the Little Snake River entering from the northeast and joining the Yampa. On the land-cover maps, narrow water and wetland features thread through the much larger shrubland background, while nearby grass and agricultural patches occur more often than they do across the broad uplands.
Little Yampa Canyon west of Craig provides a useful real-world reference for this pattern. BLM describes a public-land recreation area that includes portions of the Yampa River and surrounding mountains. That information helps a reader connect the map’s thin river-related features with the county’s landscape, but the map itself does not show legal river access, ownership, flood boundaries, or water rights. Those questions require separate official records.
For watershed education, the most useful method is to trace the river-related blue and wetland colors on the general map and then compare the surrounding vegetation on the forest-and-farmland layer. This reveals how a narrow aquatic corridor can pass through broad shrubland and forested settings. It also illustrates an important scale limitation: a narrow creek or wetland may be smaller than a 30-meter grid cell and can be generalized or mixed with adjacent cover.
Craig contains the clearest concentration of hard surfaces
The impervious-surface map strips away most vegetation detail and focuses on pavement, rooftops, and other surfaces that shed water rather than letting it soak directly into soil. Mean impervious cover across Moffat County is only 0.15 percent. Areas at 50 percent or more impervious cover make up just 0.04 percent, while developed land in the broader land-cover classification is 0.91 percent.
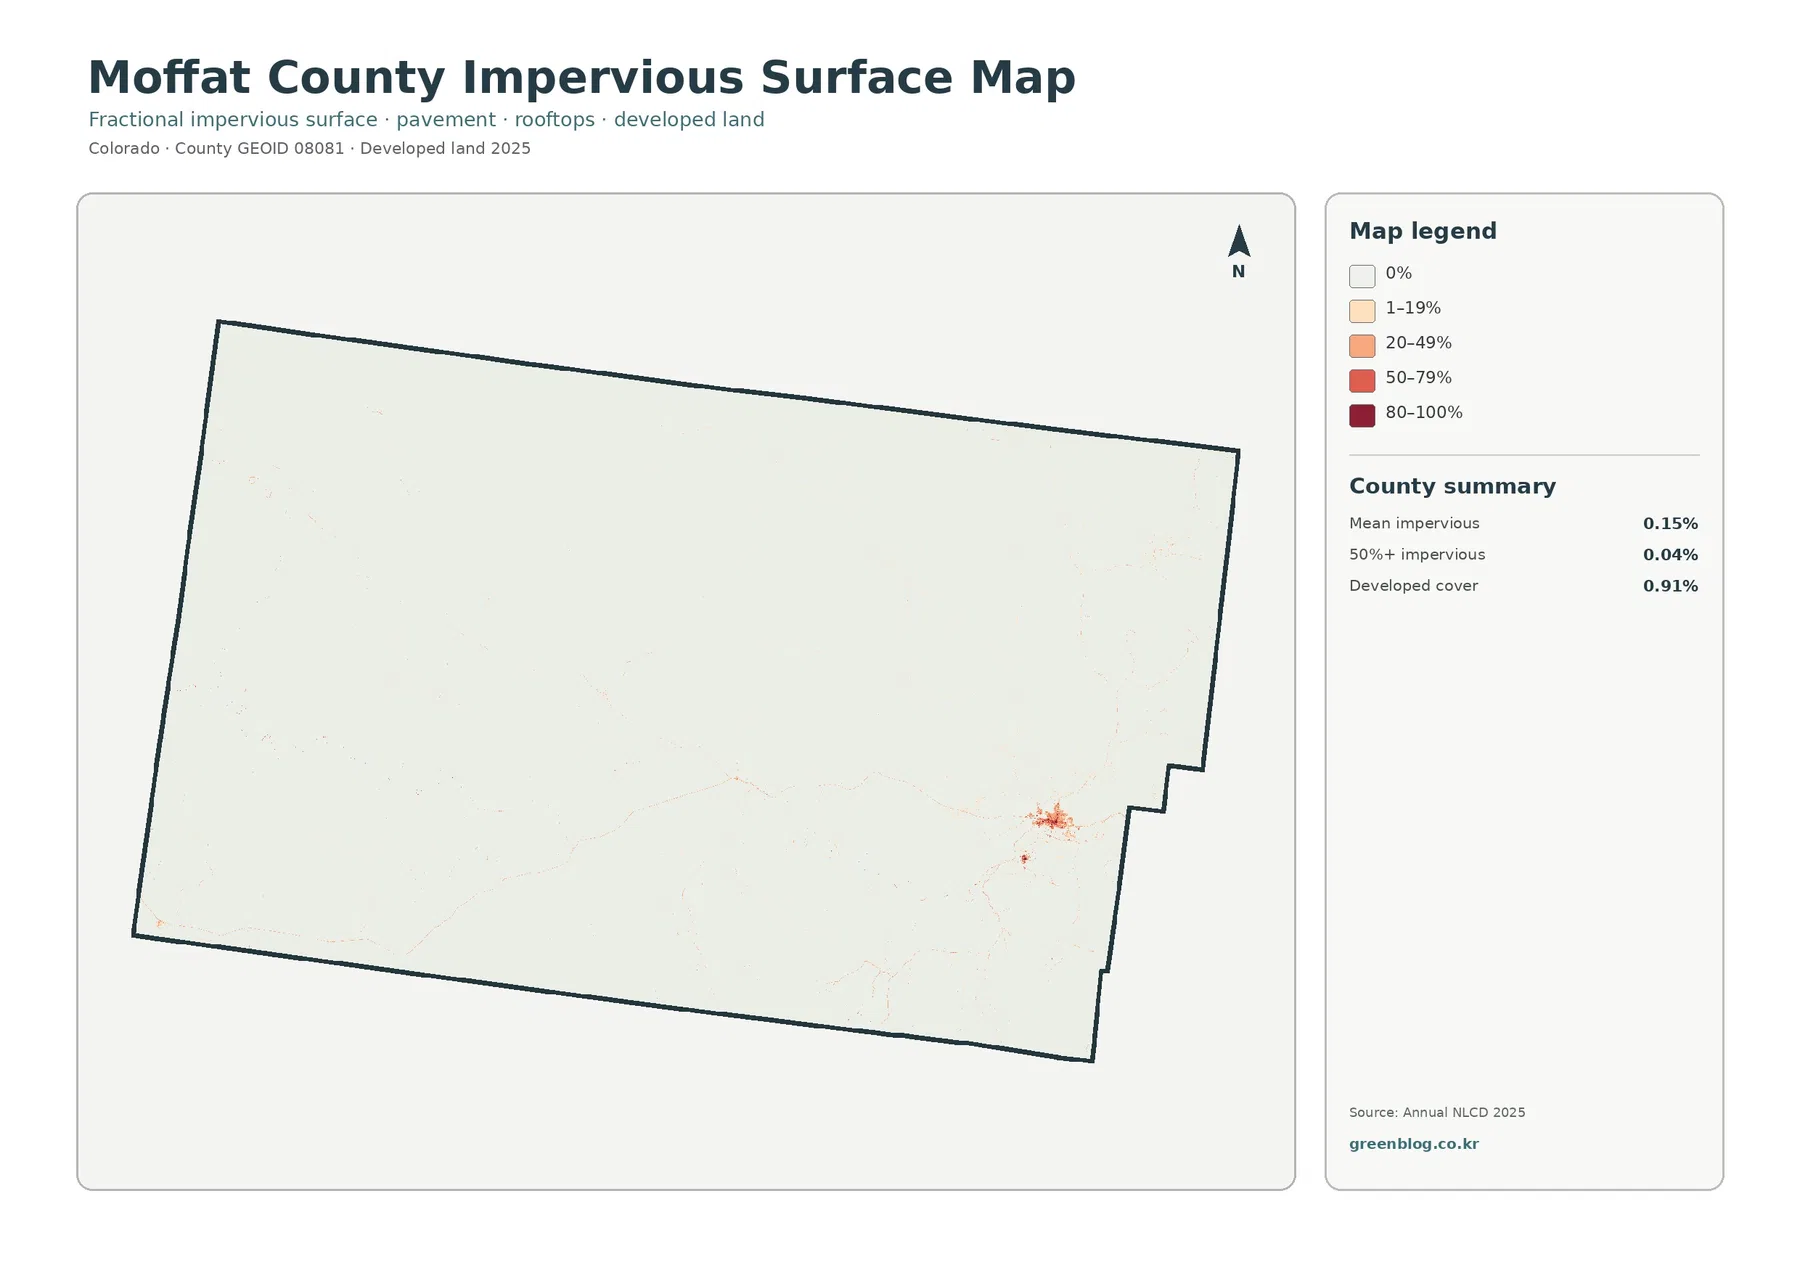
The strongest orange and red values form a compact cluster in the eastern part of the county around Craig. Outside that area, developed surfaces are sparse and often appear as thin lines or small isolated marks. The BLM Little Snake Field Office is also based in Craig, reinforcing the city’s role as a local service center, but the map should not be interpreted as a municipal-boundary layer. It is showing surface characteristics, not the legal extent of the city.
The difference between 0.91 percent developed cover and 0.15 percent mean impervious cover is also useful. NLCD developed classes can include vegetation mixed with buildings and roads, especially in lower-density settings. Impervious data instead measures the hard-surface fraction within each cell. A road, house, yard, and native vegetation can therefore contribute to a developed class without making the entire cell highly impervious.
The 1985–2025 map records class differences, not a single story of land loss
The endpoint comparison marks 9.87 percent of Moffat County as having a different mapped class in 2025 than in 1985. The summary divides that total into 0.28 percent classified as developed, 1.54 percent in the forest-loss category, 1.31 percent in the agricultural-loss category, and 6.67 percent in other class differences. Most of the county remains in the no-class-difference background, while colored patches are scattered through the west, center, east, and south.
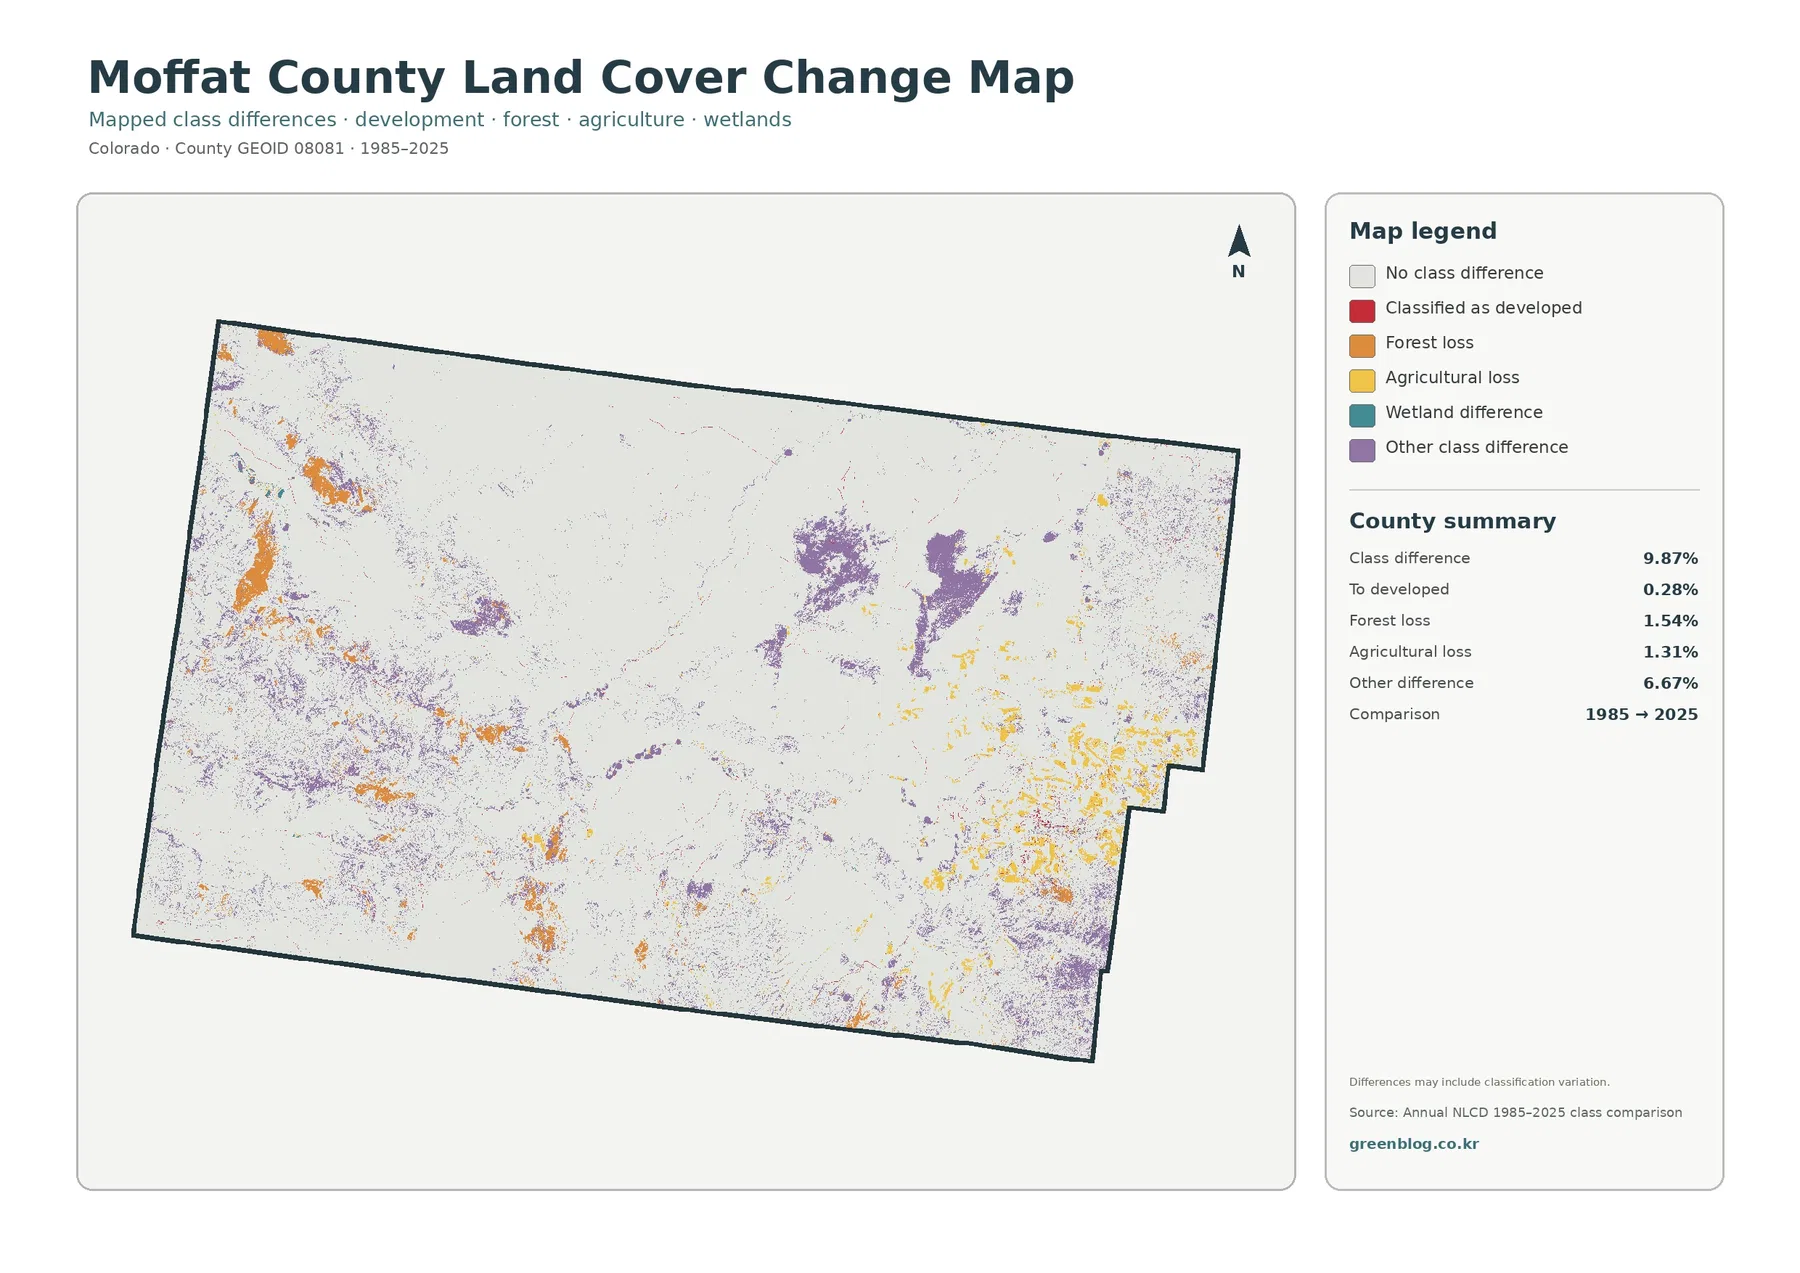
Some orange forest-loss patches are visible in western forested areas, while yellow agricultural-loss and purple other-difference patches are more widely scattered. The map does not provide a cause for any individual patch. A colored cell cannot automatically be labeled as wildfire, timber harvest, farm abandonment, new construction, or ecological degradation. It only says that the two endpoint classifications differ at that location.
This distinction matters especially in shrub and grass environments where vegetation density, season, mixed pixels, and classification methods can affect the assigned class. Real landscape change can certainly be part of the signal, but an exact explanation requires intermediate imagery and supporting records such as fire history, agricultural data, or development permits. The 9.87 percent value should therefore be described as mapped class difference, not as the percentage of the county that was damaged.
Use the four maps in a sequence that matches the question
For a general county profile, begin with the 2025 land-cover map. It establishes the overwhelming shrubland share and shows where forest, grassland, agriculture, water, wetlands, and developed cover interrupt that background. For a vegetation-focused comparison, move to the forest-and-farmland layer. It removes some of the visual complexity and makes the small agricultural footprint easier to see next to the large shrub and forest areas.
If the topic is settlement or built surfaces, the impervious map should come next. The Craig cluster becomes much easier to recognize once most natural-cover colors are removed. The change map works best last, after the reader already understands where current forest, shrubland, agriculture, and development occur. That order reduces the risk of assigning a cause to a change patch without first checking the present-day cover.
The set can support environmental education, watershed discussion, regional planning context, habitat comparison, and presentation graphics. It is also useful for comparing Moffat County with other counties because the four layers use a consistent boundary and map frame. For parcel decisions, engineering design, wetland delineation, or legal land status, use more detailed authoritative sources.
Land cover is different from zoning, ownership, and land-use permission
Land cover describes the physical surface detected and classified from imagery. A cell can be shrubland, forest, grassland, water, agriculture, or developed cover regardless of who owns it or what local regulations allow. Zoning is a legal planning framework, property ownership identifies rights in land, and development permission depends on separate rules and review. None of those questions can be answered from the colors on this map.
The distinction is especially important in Moffat County because large areas of public land are managed by the Bureau of Land Management. The Little Snake Field Office states that it administers public lands in Moffat, Routt, and Rio Blanco counties. A brown shrubland cell can still be public or private, and a green forest cell does not mark a BLM or national-forest boundary. Check dedicated land-status or cadastral data when ownership matters.
The 1.24 percent agriculture value also should not be confused with agricultural zoning or the full geographic reach of ranching. Grazing may take place on shrubland or grassland that remains classified as natural vegetation. The land-cover map is strongest as a county-scale description of the surface, not as an administrative land-use map.
Thirty-meter cells and endpoint dates limit fine detail
Annual NLCD is a Landsat-based raster product commonly represented at 30-meter resolution. A raster divides the landscape into grid cells and assigns a representative class or value to each cell. One cell in Moffat County may contain shrubs, grass, exposed soil, a narrow road, or a small drainage at the same time. The mapped category simplifies that mixture, so boundaries on the image should not be expected to match a fence, road edge, stream bank, or parcel line exactly.
The 2025 maps are also tied to a specific mapping year. Construction, fire, flooding, vegetation recovery, or other changes after the observation period will not appear. The 1985–2025 comparison uses two endpoints and cannot show when a difference first occurred or whether the surface changed more than once in between. A current high-resolution image is a better source for very recent local detail.
Within those limits, the maps are effective at their intended scale. They show a shrub-dominated county, locate major forest patches, reveal the narrow river-associated features, isolate the small Craig impervious footprint, and identify places where endpoint classifications differ. They become unreliable only when a countywide dataset is asked to answer a survey-level question.
Download the four original JPG maps
The download ZIP contains the four original JPG maps for Moffat County, Colorado: current land cover, forest and farmland, impervious/developed land, and the 1985–2025 mapped class comparison. They share the same county extent, making them convenient for side-by-side use in reports, classroom handouts, presentations, and regional comparison projects.
The supplied asset manifest lists each JPG at 2480×1754 pixels and marks that size as not meeting the package’s A3 high-resolution reference. If a large poster is planned, check sharpness at the intended print dimensions first. For screens, normal documents, moderate-size prints, and comparative layouts, the original JPG files are more useful than the smaller WebP previews embedded on this page.
Frequently Asked Questions
What is the dominant land cover in Moffat County?
Shrubland is the dominant 2025 class at 79.25 percent. Forest follows at 15.50 percent, while grassland, agriculture, developed cover, wetlands, and water occupy much smaller shares. The general map is the best starting point for seeing how the forest patches and river-related features break up the broad shrubland interior.
Which map is best for seeing development around Craig?
Use the impervious-surface map. Mean impervious cover is only 0.15 percent countywide, but Craig forms the clearest concentration of pavement, rooftops, and other hard surfaces. The general land-cover map can then be used to compare that cluster with nearby shrubland and other natural cover.
Does the 9.87 percent change value mean that 9.87 percent of the county was degraded?
No. It is the share of the county where the 1985 and 2025 mapped classes differ. Real land change may be involved, but image timing, vegetation condition, mixed pixels, and classification methods can also affect the comparison. Intermediate imagery and event-specific records are needed to identify the cause of a particular patch.
Map File Information
This ZIP contains all four original JPG maps for Moffat County, Colorado: current land cover, forest and farmland, impervious/developed land, and the 1985–2025 mapped class comparison.
- Included Files: Use only the versions confirmed in the article and supplied images
- File Type: Use the confirmed download contents
- Intended Use: Printing, education, presentations, and map-based projects
Related Maps
- Adams County Colorado Land Cover Map
- Alamosa County Colorado Land Cover Map
- Arapahoe County Colorado Land Cover Map
Sources and References
These public sources provide the land-cover definitions, county boundary data, BLM land-management context, and Yampa River background used in this article.
- MRLC Annual NLCD Data – annual land-cover and related datasets
- USGS Annual NLCD Land Cover Classification – class definitions and dataset documentation
- U.S. Census Bureau TIGER/Line Shapefiles – county boundary data
- BLM Little Snake Field Office – public-land management context for Moffat County and the Craig area
- BLM Little Yampa Canyon – Yampa River and public-land context west of Craig
- BLM Peterson Draw WSA – western Moffat County vegetation and landscape context
Green Map creates custom-edited map images using open geographic data sources such as geoBoundaries, Natural Earth, OpenStreetMap, and government open data.
These maps are edited visual materials, not raw data files, and are provided for education, documents, presentations, and graphic reference.