Larimer County stretches across one of northern Colorado’s sharpest landscape transitions. The western half is dominated by mountain forest and open high-country vegetation, while the eastern side contains broad grassland, farmland, reservoirs, and the developed areas around Fort Collins and Loveland. The four maps on this page separate those patterns into current land cover, forest and farmland, impervious surface, and mapped change between 1985 and 2025.
All four original JPG maps are available in one download below. The maps are most useful when compared rather than treated as four versions of the same picture. The general map gives the county-wide mix of cover classes, the forest view pulls out agriculture and woodland, the impervious map isolates paved and built surfaces, and the change map highlights differences across the forty-year comparison.
Table of Contents
The east side carries most of the developed footprint
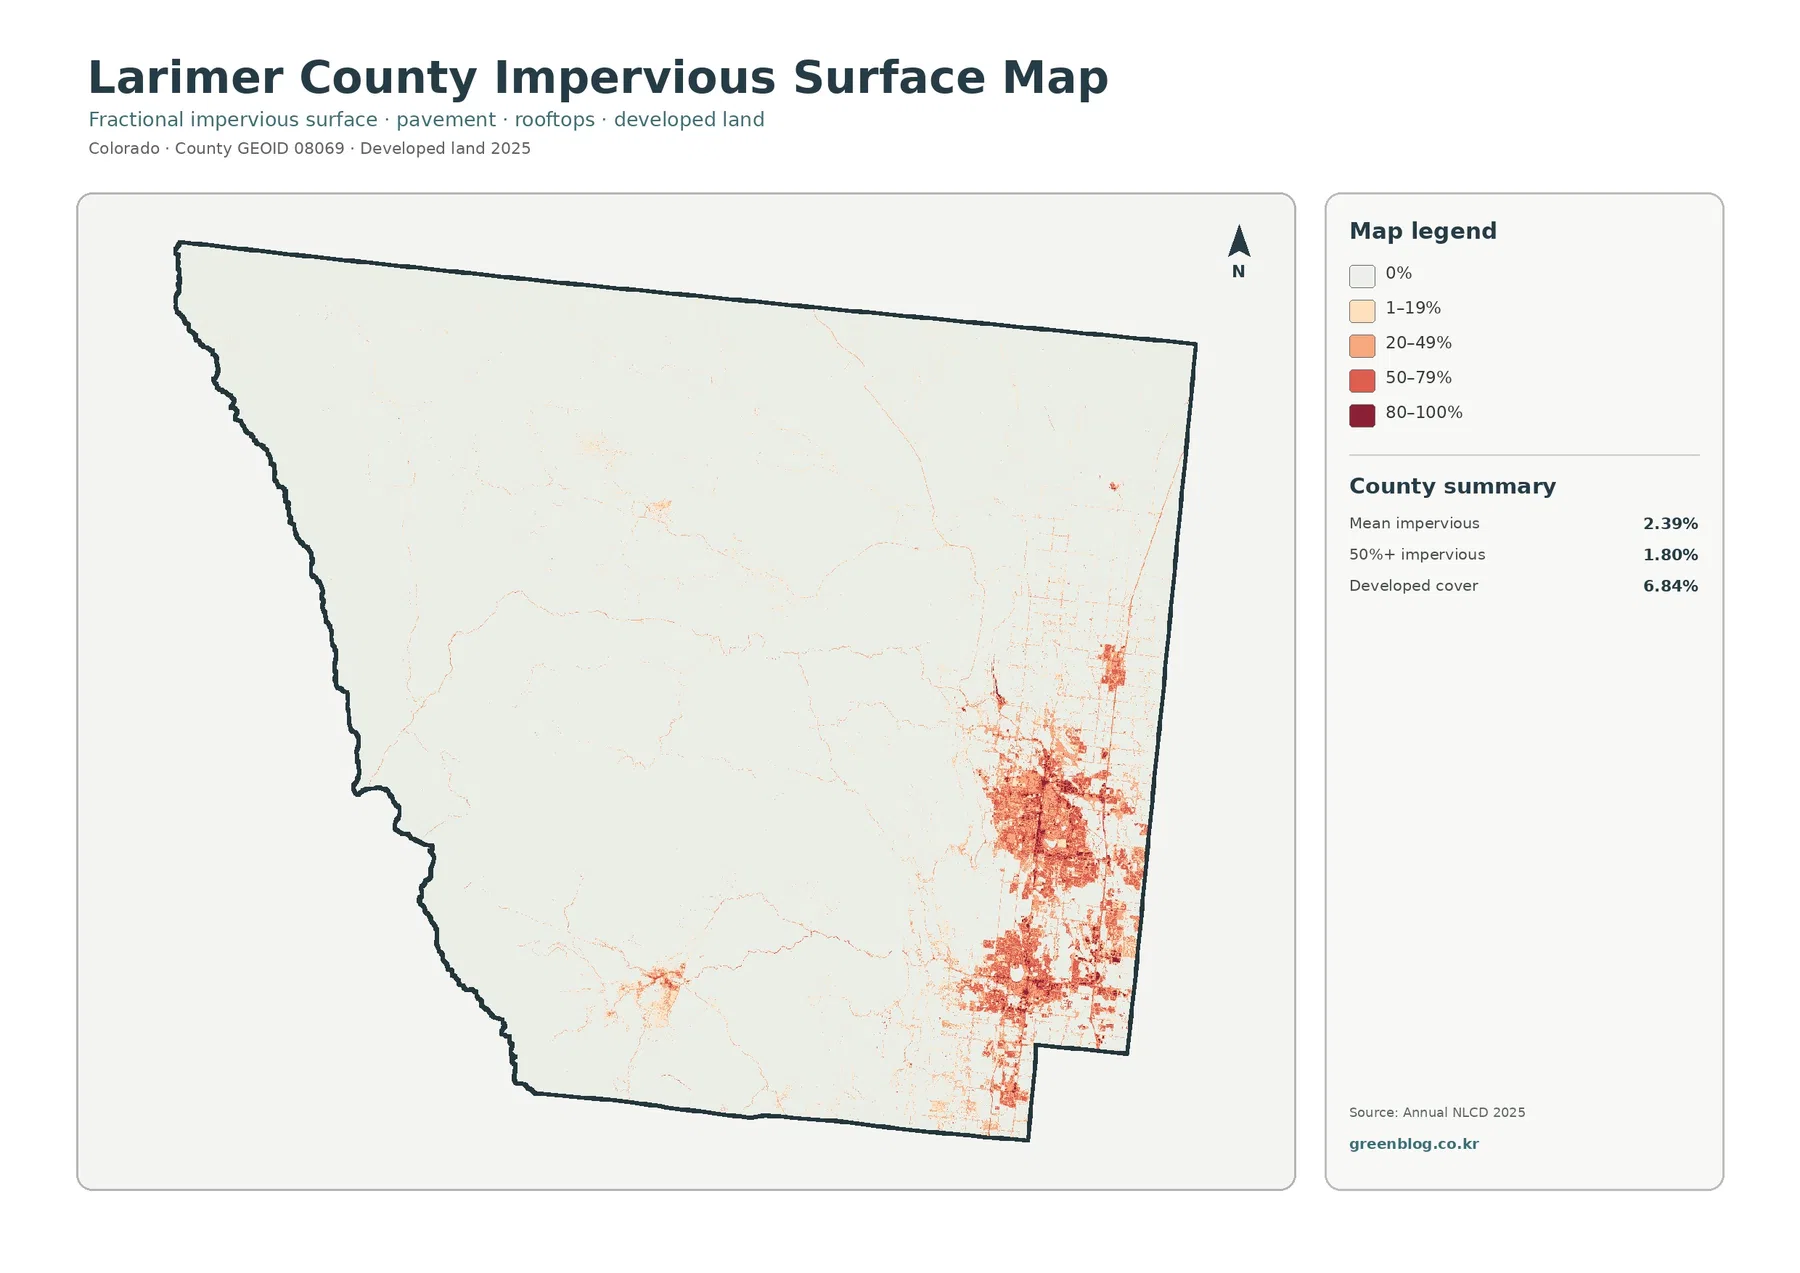
A useful way to begin with Larimer County is to look at where built surfaces are concentrated. The impervious surface map is nearly blank across much of the western mountains, then becomes noticeably warmer in color as it reaches the eastern population centers. The largest clusters line up with the Fort Collins and Loveland area, with smaller patches and thin lines extending outward along settled corridors. That contrast makes the urban edge easier to see here than on the general land-cover map, where development competes visually with forest, grassland, shrubland, water, and agriculture.
Impervious surface means pavement, rooftops, parking areas, and other surfaces where water does not readily soak into the ground. The county-wide mean is 2.39%, and 1.80% of the county is mapped at 50% impervious or higher. Developed cover accounts for 6.84% of the current land-cover summary. Those numbers should not be read as a statement that the built parts of Fort Collins or Loveland are lightly paved. Larimer County is large and includes extensive mountain and open-land areas, so the county average is strongly influenced by places with little development.
Current land cover is led by forest and grassland
The 2025 county summary gives forest and grassland equal shares at 31.88% each. Shrubland is the third major class at 21.05%, followed by developed land at 6.84% and agriculture at 3.39%. Together, forest, grassland, and shrubland account for most of the county’s mapped surface. The balance is visible immediately: dark forest colors fill large parts of the west, grassland expands across more open central and eastern terrain, and shrubland forms broad transition areas between those two settings.
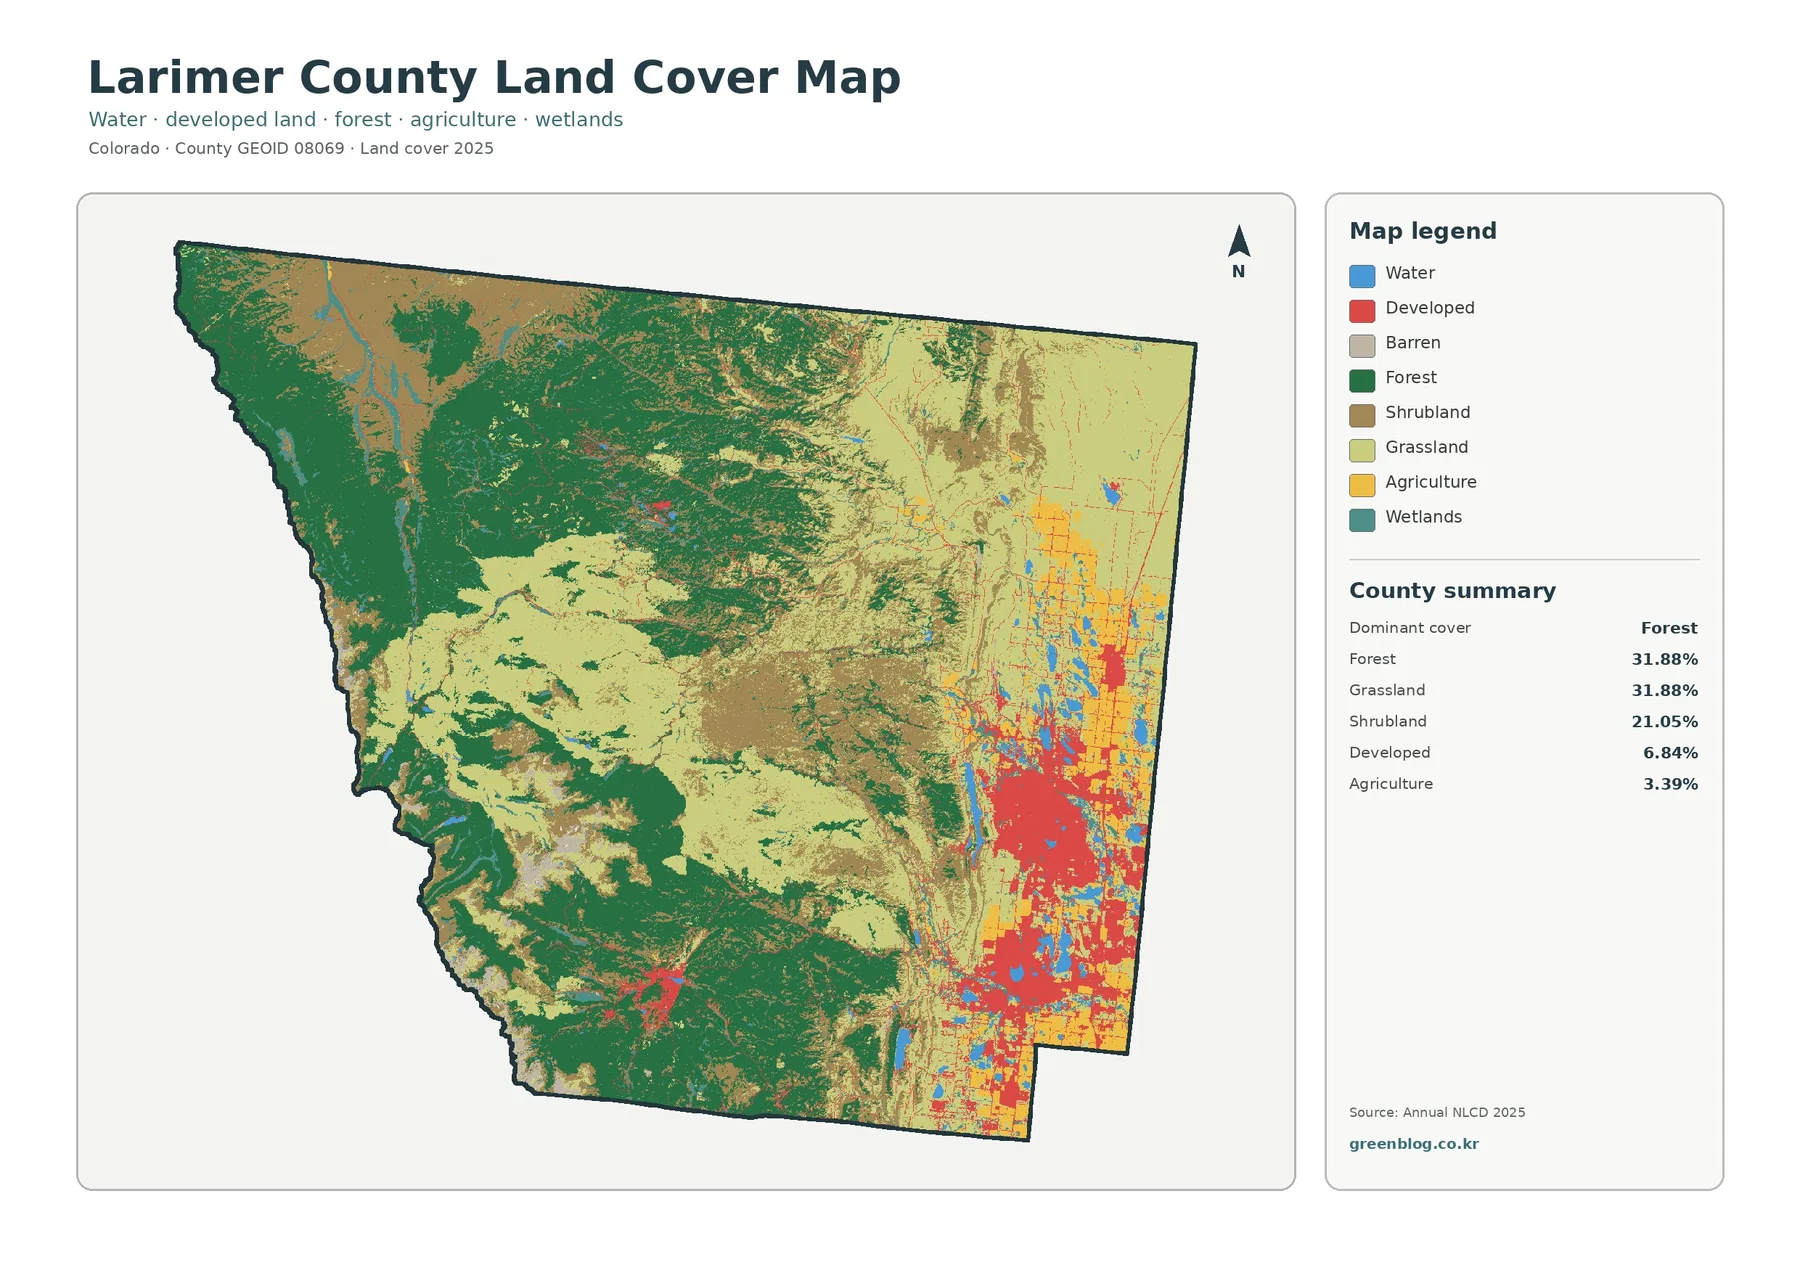
The western boundary and southwestern mountain areas contain the largest continuous forest blocks. Moving toward the middle of the county, the forest becomes more broken and mixes with grassland and shrubland. Farther east, grassland becomes a much larger visual component, while developed and agricultural colors appear more frequently. This is not a simple straight west-to-east boundary; fingers and patches of different cover types interlock along foothills, valleys, reservoirs, and settled areas.
Water and wetlands occupy much less area than forest or grassland, yet they are easy to locate because their colors contrast with the surrounding land. Blue features are especially noticeable near the eastern foothills. Larimer County’s Department of Natural Resources manages reservoir parks including Horsetooth, Carter Lake, Pinewood, and Flatiron, which helps provide geographic context for the cluster of mapped water bodies in that part of the county. The land-cover map identifies surface cover, however, not water depth, ownership, recreation rules, or water quality.
Forest and farmland separate cleanly when development is de-emphasized
The forest-and-farmland view reorganizes the same county around a smaller set of categories. Forest remains 31.88%, while agriculture is 3.39%. Grassland is 31.88%, shrubland 21.05%, water 1.22%, and wetlands 2.80%. With developed areas pushed into a more neutral background, the eastern farm blocks are easier to distinguish from surrounding grassland and other open cover. The western forest also stands out as a broad, continuous feature instead of one class among many.
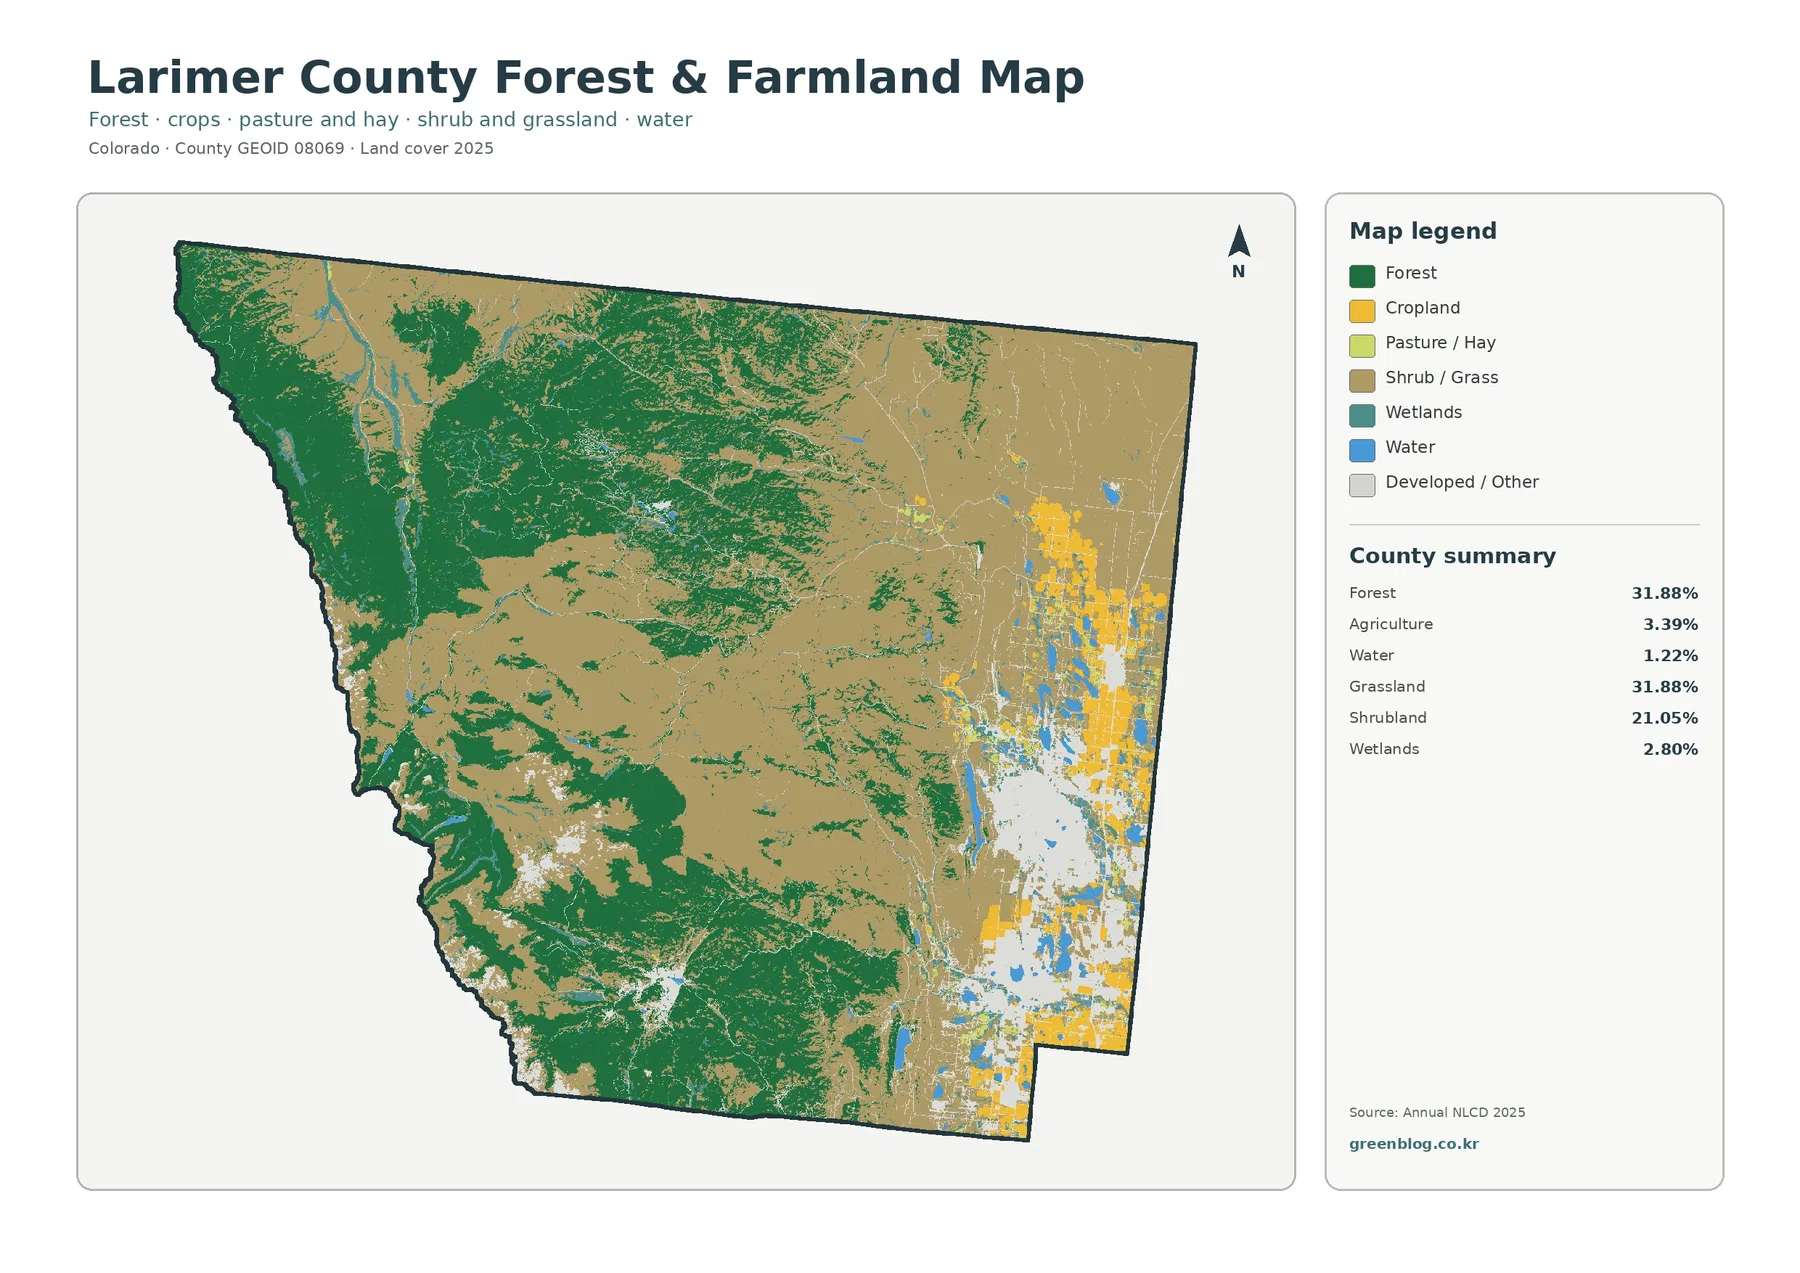
The forest pattern fits the county’s mountain geography. Larimer County includes portions of Rocky Mountain National Park and Roosevelt National Forest, both listed by the county among major parks and public lands. On the map, the west and southwest contain the largest forest masses, while higher or more open terrain introduces shrub and grass classes within and around those green areas. That mixture is important because “mountain” does not automatically mean “forest” in every mapped cell.
Agricultural colors are much more frequent east of the foothills, appearing as discrete fields and blocks rather than a county-wide blanket. Around the eastern cities, agriculture, grassland, water, and developed land sit close together. This makes the map useful for explaining why a single county can contain dense urban areas, working agricultural landscapes, and large mountain forests without one category fully replacing the others.
Water and wetland classes are small but geographically useful
Water makes up 1.22% of the forest-and-farmland summary and wetlands 2.80%. Those shares are modest, but the mapped locations can be more informative than the percentages. Reservoirs near the foothills create clear reference points, and smaller water or wetland features help trace low-lying corridors through otherwise dry grassland and developed areas. A reader trying to orient a map can often use a reservoir or a chain of water features more easily than an abstract percentage.
The 1985–2025 comparison highlights different kinds of change in different places
The change map compares mapped classes from 1985 with those from 2025. The summary reports class differences across 26.18% of the county. Areas mapped as becoming developed account for 2.93%, forest loss for 15.04%, agricultural loss for 1.96%, and other class differences for 6.06%. The map is best read as a screening layer that tells you where the classification changed, not as a complete history of every land-management event that occurred during those four decades.
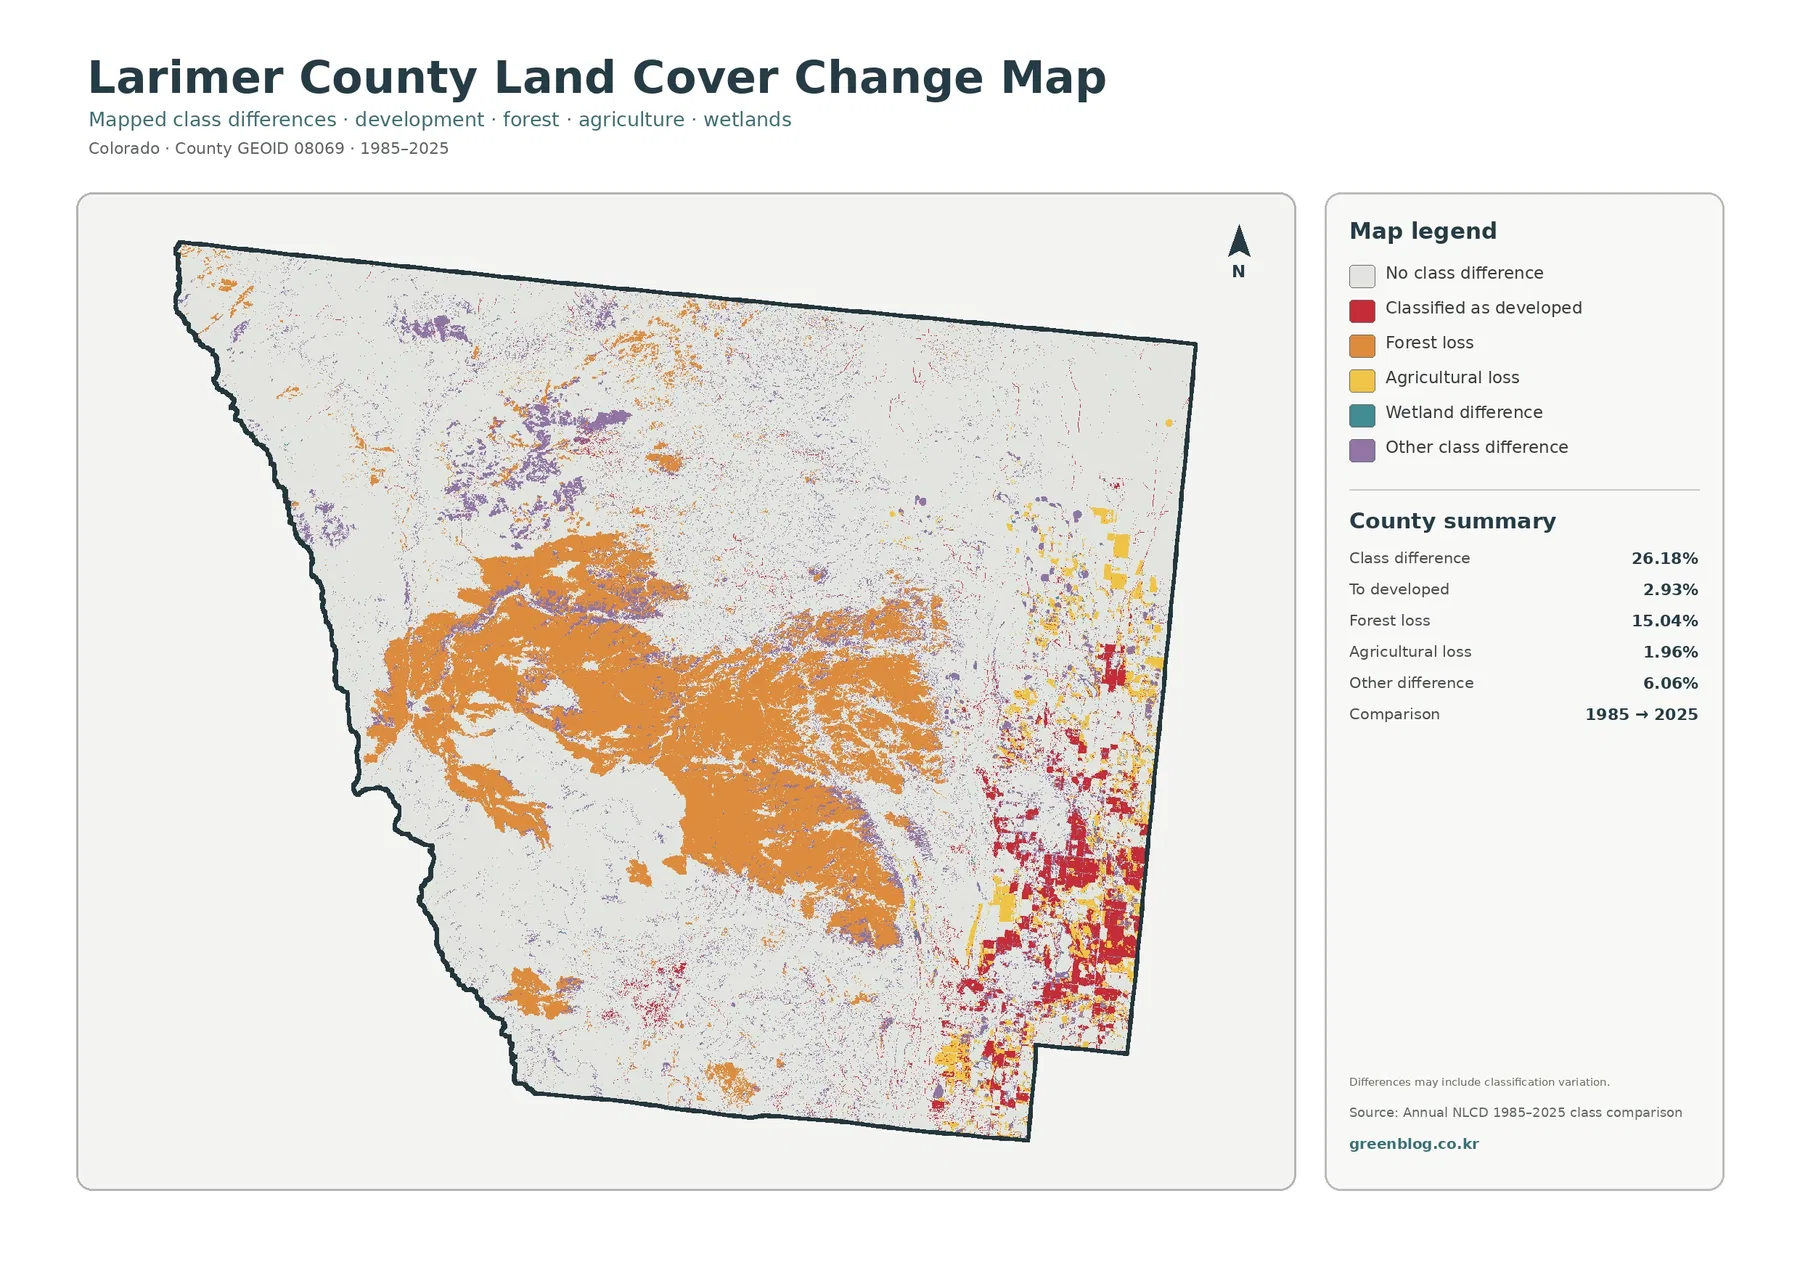
Orange forest-loss areas are widespread through portions of the central and western mountains, while red developed-change areas are more heavily concentrated in the east. Yellow agricultural-loss patches are smaller and occur mainly where agriculture is already part of the surrounding eastern landscape. Purple “other difference” areas are scattered more broadly. Seeing these categories in separate parts of the county is more useful than reducing the map to a single change percentage because the type of change varies with location.
The forest-loss value deserves particular caution. The map itself notes that differences may include classification variation. A changed class can reflect a real surface change, but observation conditions and the classification process can also affect the result. Temporary vegetation condition or the way a mixed pixel was assigned may matter as well. A red or orange patch therefore identifies a place worth checking with fire records, aerial imagery, forestry information, or local planning data; it does not by itself prove a cause.
Why the western forest and eastern open land should be read together
Larimer County’s maps make more sense when the mountain and plains sides are treated as parts of one connected county rather than unrelated scenes. The county’s natural-resources pages identify Rocky Mountain National Park and Roosevelt National Forest among major public lands, while Fort Collins and Loveland anchor much of the developed eastern area. Between them, foothills and open country create a broad transition where forest, shrubland, and grassland overlap. That transition is why the general map looks mottled through the center instead of changing abruptly from green mountains to red cities.
Choosing the right map for a specific task
For a general county overview, start with the 2025 land-cover map. It is the only one of the four that gives the broad mix of forest, grassland, shrubland, developed land, agriculture, water, wetlands, and barren cover in a single view. If the question is specifically about natural cover versus farming, switch to the forest-and-farmland map. It reduces visual competition from development and makes field patterns easier to locate.
Use the impervious surface map when the question concerns pavement, rooftops, dense built areas, or the difference between urban and rural surfaces. It is especially effective around Fort Collins and Loveland because the warm colors form obvious clusters against a pale county background. Use the change map only when the question includes time. It should not replace the current map because a place can show no mapped class difference and still be important in the 2025 landscape.
Download the four original JPG maps
If you need larger files than the WebP images displayed in the article, use the ZIP below. It contains the four original JPG maps as a matched set: current land cover, forest and farmland, impervious surface, and land-cover change. Each source JPG is 2480 × 1754 pixels. That is smaller than an A3 image at 300 dpi, so check print quality before using the files for a large-format poster or other output that demands fine detail.
Limits to keep in mind before using the maps
These are classified raster maps, not parcel surveys. A raster divides the landscape into cells and assigns a representative class to each cell. When a cell contains a road, lawn, trees, and part of a building, the source data must still classify that area using its mapping rules. The result is useful for broad patterns but can simplify narrow streams, small development features, field edges, and transitions between vegetation types. A mixed pixel is simply a cell that contains more than one real-world surface type.
Date is another limit. The current maps represent the supplied 2025 Annual NLCD layer, while the change product compares 1985 with 2025. New construction, vegetation recovery, fire effects, farming changes, or water-level changes after that observation period may not appear. The maps also do not show zoning, land ownership, building permits, conservation easements, or legal land-use rights. Those topics require separate county, municipal, state, or federal records.
Frequently Asked Questions
What are the largest land-cover classes in Larimer County?
Forest and grassland are tied at 31.88% each in the 2025 summary, followed by shrubland at 21.05%. Developed land is 6.84% and agriculture 3.39%. The map also shows a strong geographic split: forest is much more extensive in the western mountains, while grassland, agriculture, and development become more prominent toward the east.
Which map is most useful around Fort Collins and Loveland?
Use the land-cover map to compare the cities with nearby forest, grassland, farmland, and water. Add the impervious-surface map when you want to see where paved and built surfaces are concentrated.
Does the 15.04% forest-loss figure mean that 15.04% of the county was permanently deforested?
No. It means that 15.04% of the county falls in the map’s forest-loss difference category for the 1985–2025 comparison. The product warns that mapped differences can include classification variation. Determining whether a specific patch reflects fire, harvest, long-term vegetation change, or a classification issue requires additional evidence.
Map File Information
The download contains all four original JPG maps for Larimer County in one ZIP file. They are useful when you need a larger map for printing, classroom reference, comparison work, or a presentation.
- Included Files: Use only the versions confirmed in the article and supplied images
- File Type: Use the confirmed download contents
- Intended Use: Printing, education, presentations, and map-based projects
Related Maps
- Adams County Colorado Land Cover Map
- Alamosa County Colorado Land Cover Map
- Arapahoe County Colorado Land Cover Map
Sources and references
The following official sources provide the classification documentation, boundary information, and local context used to interpret the map set.
- MRLC Annual NLCD Data – annual land-cover data and access information
- USGS Annual NLCD Land Cover Classification – definitions of land-cover classes
- U.S. Census Bureau TIGER/Line Shapefiles – county boundary data
- Larimer County Natural Resources – parks, open spaces, reservoirs, and county natural-resource context
Green Map creates custom-edited map images using open geographic data sources such as geoBoundaries, Natural Earth, OpenStreetMap, and government open data.
These maps are edited visual materials, not raw data files, and are provided for education, documents, presentations, and graphic reference.