Jefferson County combines two very different Colorado landscapes in one boundary. The eastern side is part of the Denver metropolitan area, while the west reaches deep into foothills and mountain terrain. In 2025, forest covers 41.15%, developed land 23.29%, and shrubland 23.60%.
The four maps on this page separate current land cover, forest and farmland, impervious surfaces, and class differences from 1985 to 2025. Original JPG versions of all four are available in one ZIP for printing, presentations, teaching, and closer comparison.
Table of Contents
The eastern third reads as a metropolitan landscape rather than a mountain county
At 23.29%, developed land occupies a much larger share of Jefferson County than in the rural mountain counties to the west. The strongest red area stretches through the east and northeast, where incorporated communities such as Lakewood, Arvada, Wheat Ridge, Westminster, and Golden are located.
Jefferson County’s 2026 County Profile describes the county as one of Colorado’s major metropolitan counties and lists twelve municipalities that lie wholly or partly inside its boundary. The same profile says roughly three-quarters of the county’s land area is mountainous. Those two facts explain why the map changes so sharply from urban east to mountain west.
The metro side is not completely built over. Small grassland, shrubland, wetland, and water patches interrupt the developed surface. Parks, open land, stream corridors, and lower-density neighborhoods all contribute to a more mixed pattern than a solid red urban block.
Moving west from the developed belt, forest and shrubland increase quickly. This transition is one of Jefferson County’s most useful map features because it places metropolitan development, foothills, and mountain vegetation within a short east–west distance.
Imperviousness shows where pavement and rooftops are actually concentrated
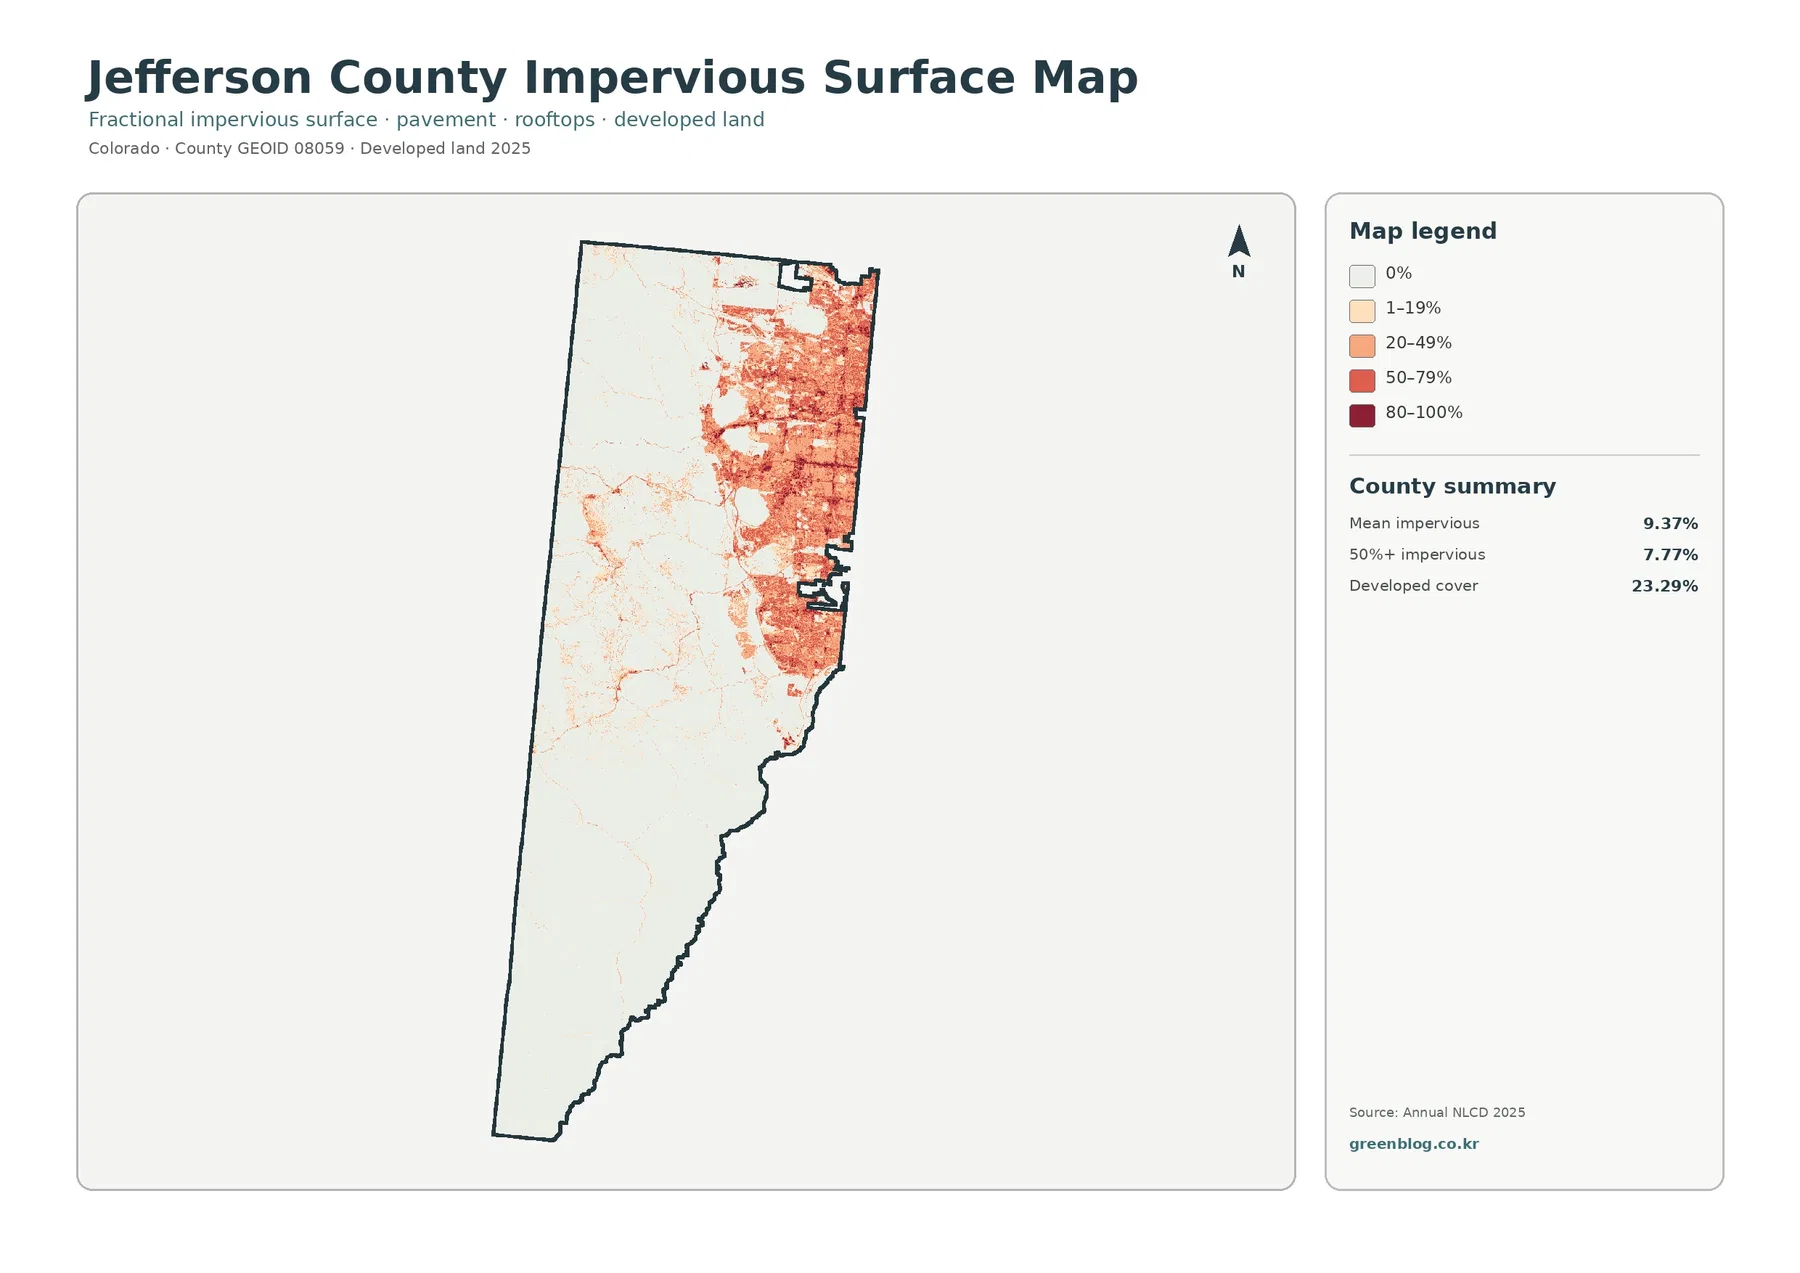
Mean imperviousness is 9.37%, and cells at 50% or greater imperviousness cover 7.77% of Jefferson County. The eastern urban area contains large orange and red zones, while most western mountain terrain remains nearly white.
This layer is more specific than the developed-cover map. A neighborhood can be classified as developed while still containing trees, lawns, soil, and open space. Imperviousness estimates the hard-surface fraction within a cell, so it highlights pavement, rooftops, parking areas, and similar surfaces more directly.
Several narrow traces extend westward from the urban belt into the foothills. At 30-meter resolution, those lines are useful for locating transportation or settlement corridors, but they should not be used to measure road width or individual building footprints.
The contrast between 23.29% developed cover and 9.37% mean imperviousness is therefore expected. Developed places still contain permeable surfaces, especially in lower-density neighborhoods and foothill communities.
The full 2025 map makes the east–west land-cover break unmistakable
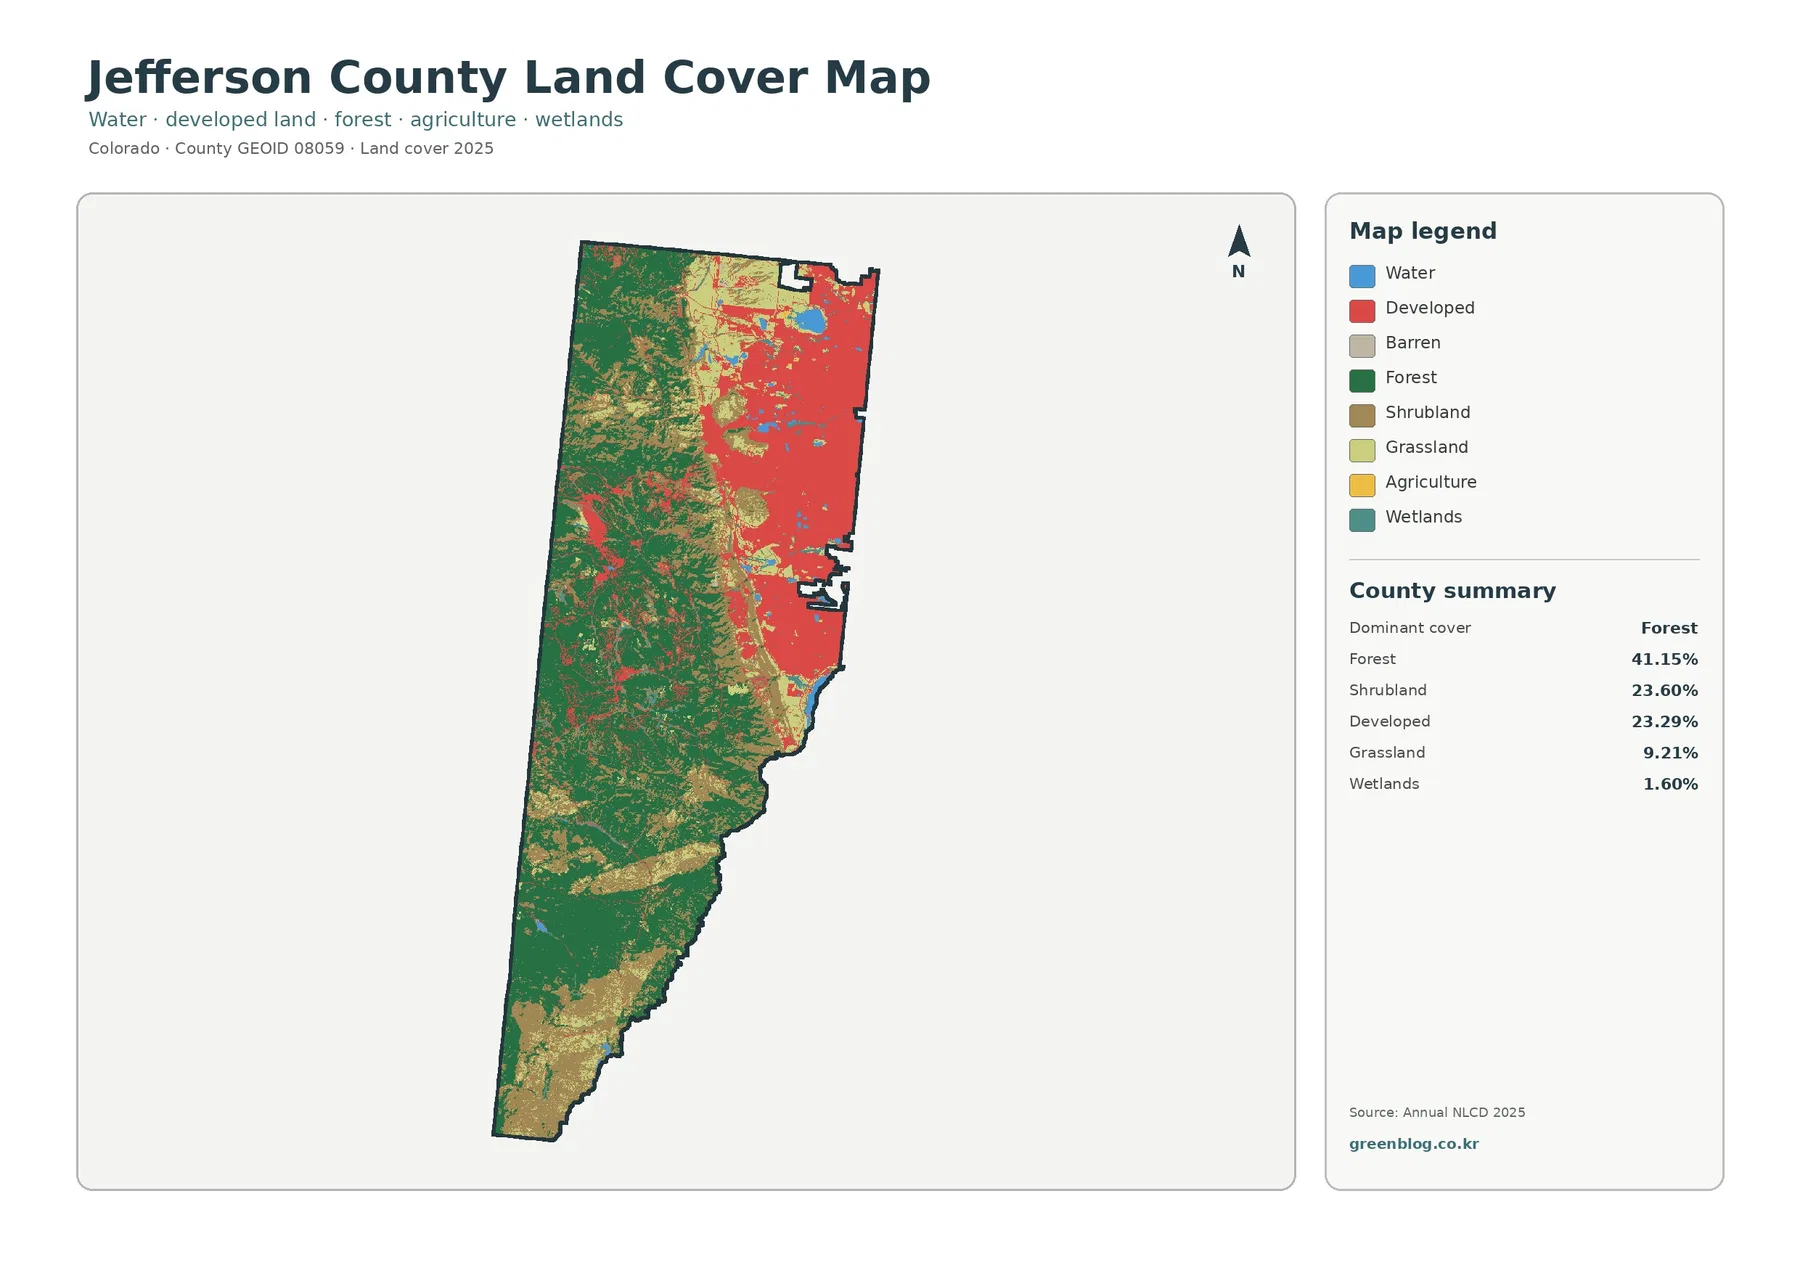
Forest is the largest current class at 41.15%, but it is strongly concentrated in the west and southwest. Dark green covers broad mountain areas, with shrubland and grassland breaking up the forest through foothills, ridges, and more open terrain.
Shrubland accounts for 23.60%, nearly the same share as developed cover. It is most visible through the central transition zone and many western openings. That broad tan cover helps connect the forested mountains with the more urbanized east.
Grassland contributes 9.21%. It appears in open foothill and plains locations and in smaller patches inside the urban side of the county. Agriculture, by contrast, is only 0.05%, so open land should not automatically be interpreted as farmland.
Water covers 1.04%, with several blue features visible in the eastern and northeastern portions. Wetlands are 1.60% and appear as smaller blue-green patches or narrow traces. Reduced web previews can hide fine water features, so the original JPG is better when small classes matter.
Golden is a useful reference point for the shift from metro cover to foothills
Golden sits near one of the clearest transitions in Jefferson County. To the east, developed and impervious surfaces dominate much of the metro landscape. To the west, forest and shrubland become increasingly important.
The Mesa Region of Jeffco Open Space includes North Table Mountain Park, South Table Mountain Park, and Mount Galbraith Park around Golden. Their administrative boundaries are not drawn on the NLCD map, but these official local references help readers understand why open grass, shrubland, and foothill forest occur so close to developed land.
The county’s open-space system preserves more than 58,000 acres across 27 parks. That acreage is not the same as the 41.15% forest class, because parks contain many kinds of cover and forest also occurs outside parks. It does, however, provide useful context for the large natural areas that remain beside a major metropolitan region.
Land cover should remain separate from zoning and ownership. A green forest pixel does not prove that the land is public, and a red developed pixel does not reveal whether a property is residential, commercial, municipal, or private.
The simplified view emphasizes forest and open cover rather than agriculture
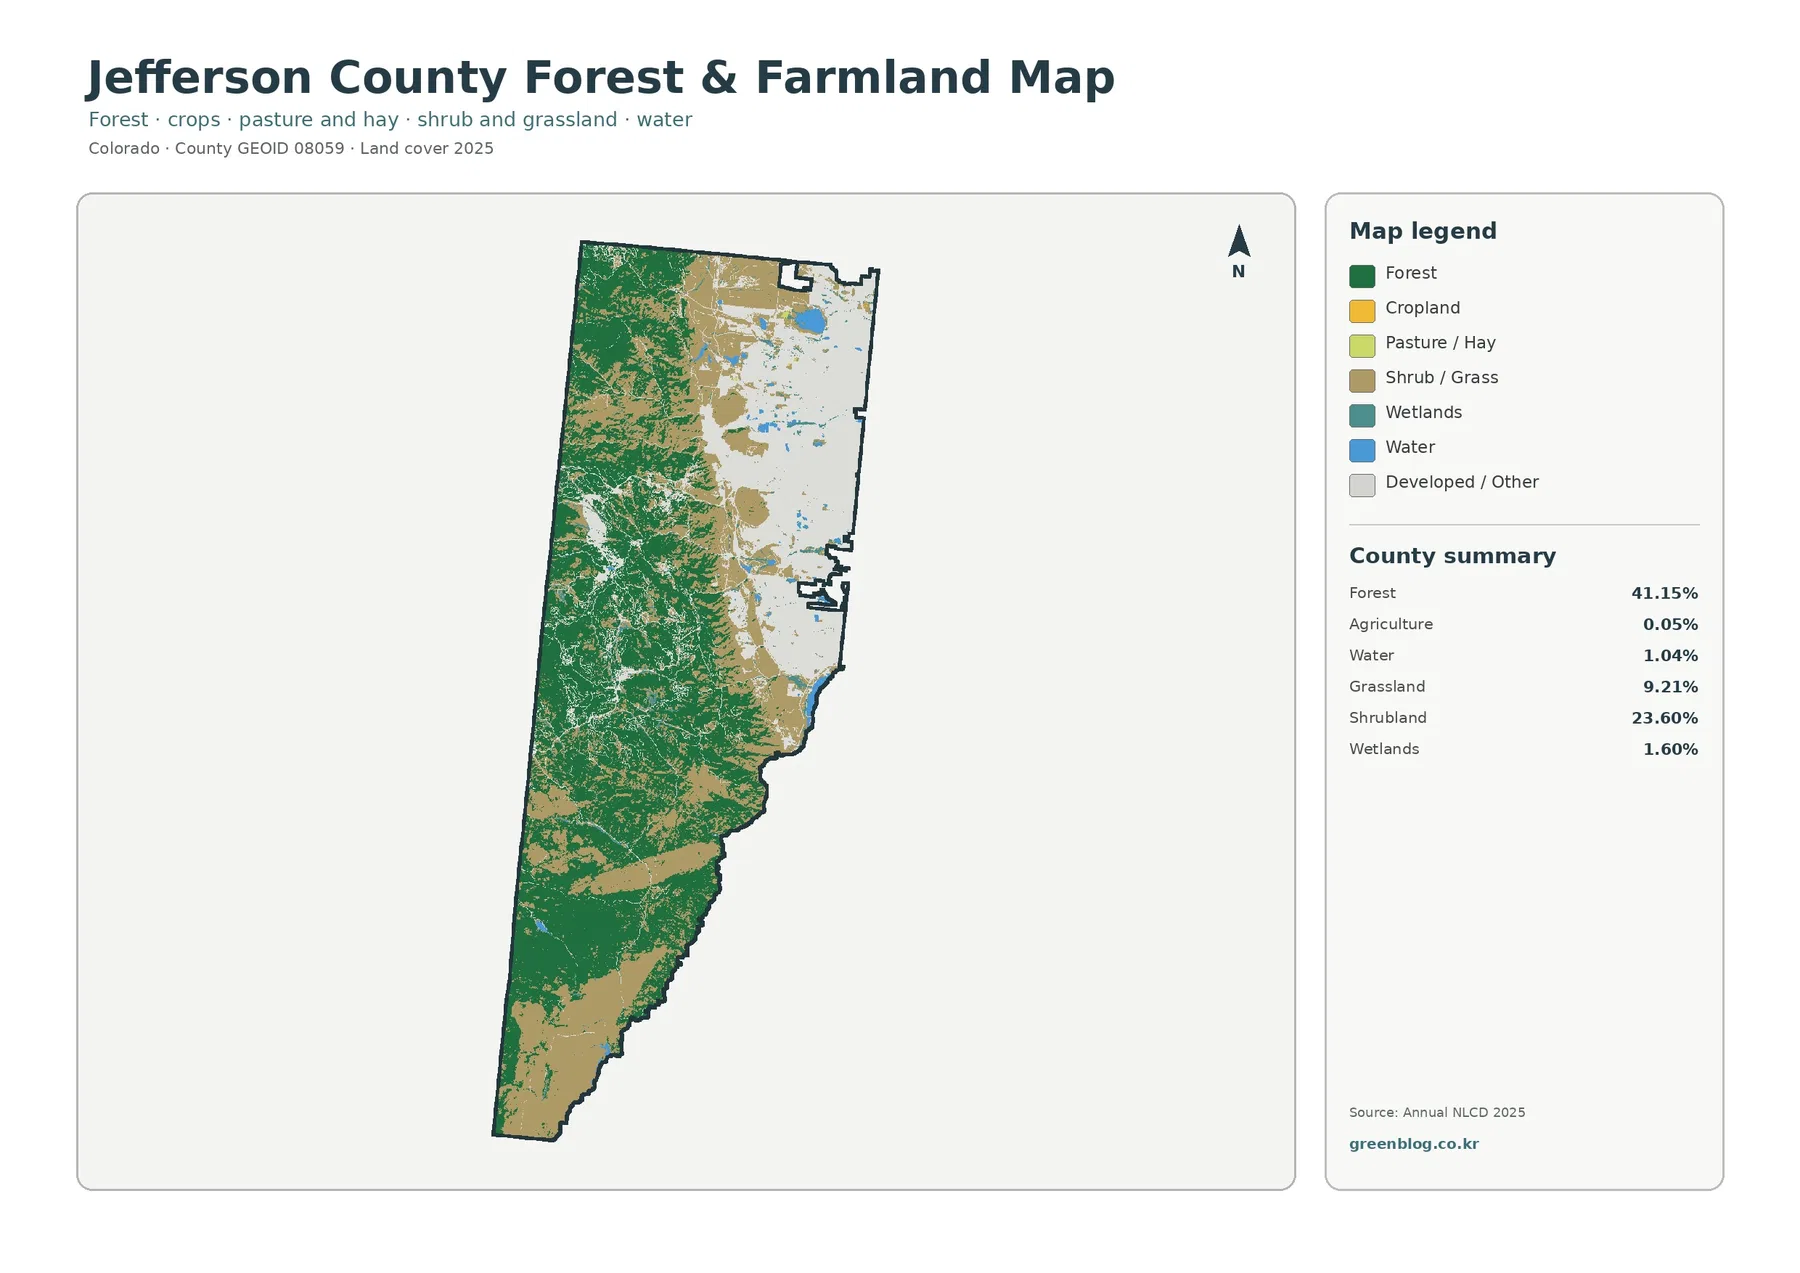
With fewer legend categories, the western forest block becomes even clearer. The east is dominated by developed-or-other cover, while tan shrub-and-grass areas occupy much of the central foothill transition.
Agriculture is only 0.05% in the supplied 2025 summary. Small agricultural colors may appear locally, but farming is not a major visual component of the countywide map. The stronger story is the contrast between forest, open foothill cover, and metropolitan development.
Jeffco Parks & Open Space describes foothill and mountain forests as a mosaic that includes ponderosa pine savannas, aspen stands, mixed conifer forest, and other woody vegetation. The simplified map does not separate those forest types, but it helps identify where the broad forested side of the county begins.
Use a land-ownership or park-system map when administrative boundaries matter. This layer is better suited to questions about surface cover, broad habitat context, and how natural vegetation changes across the county.
Development conversion and forest loss create two different change zones
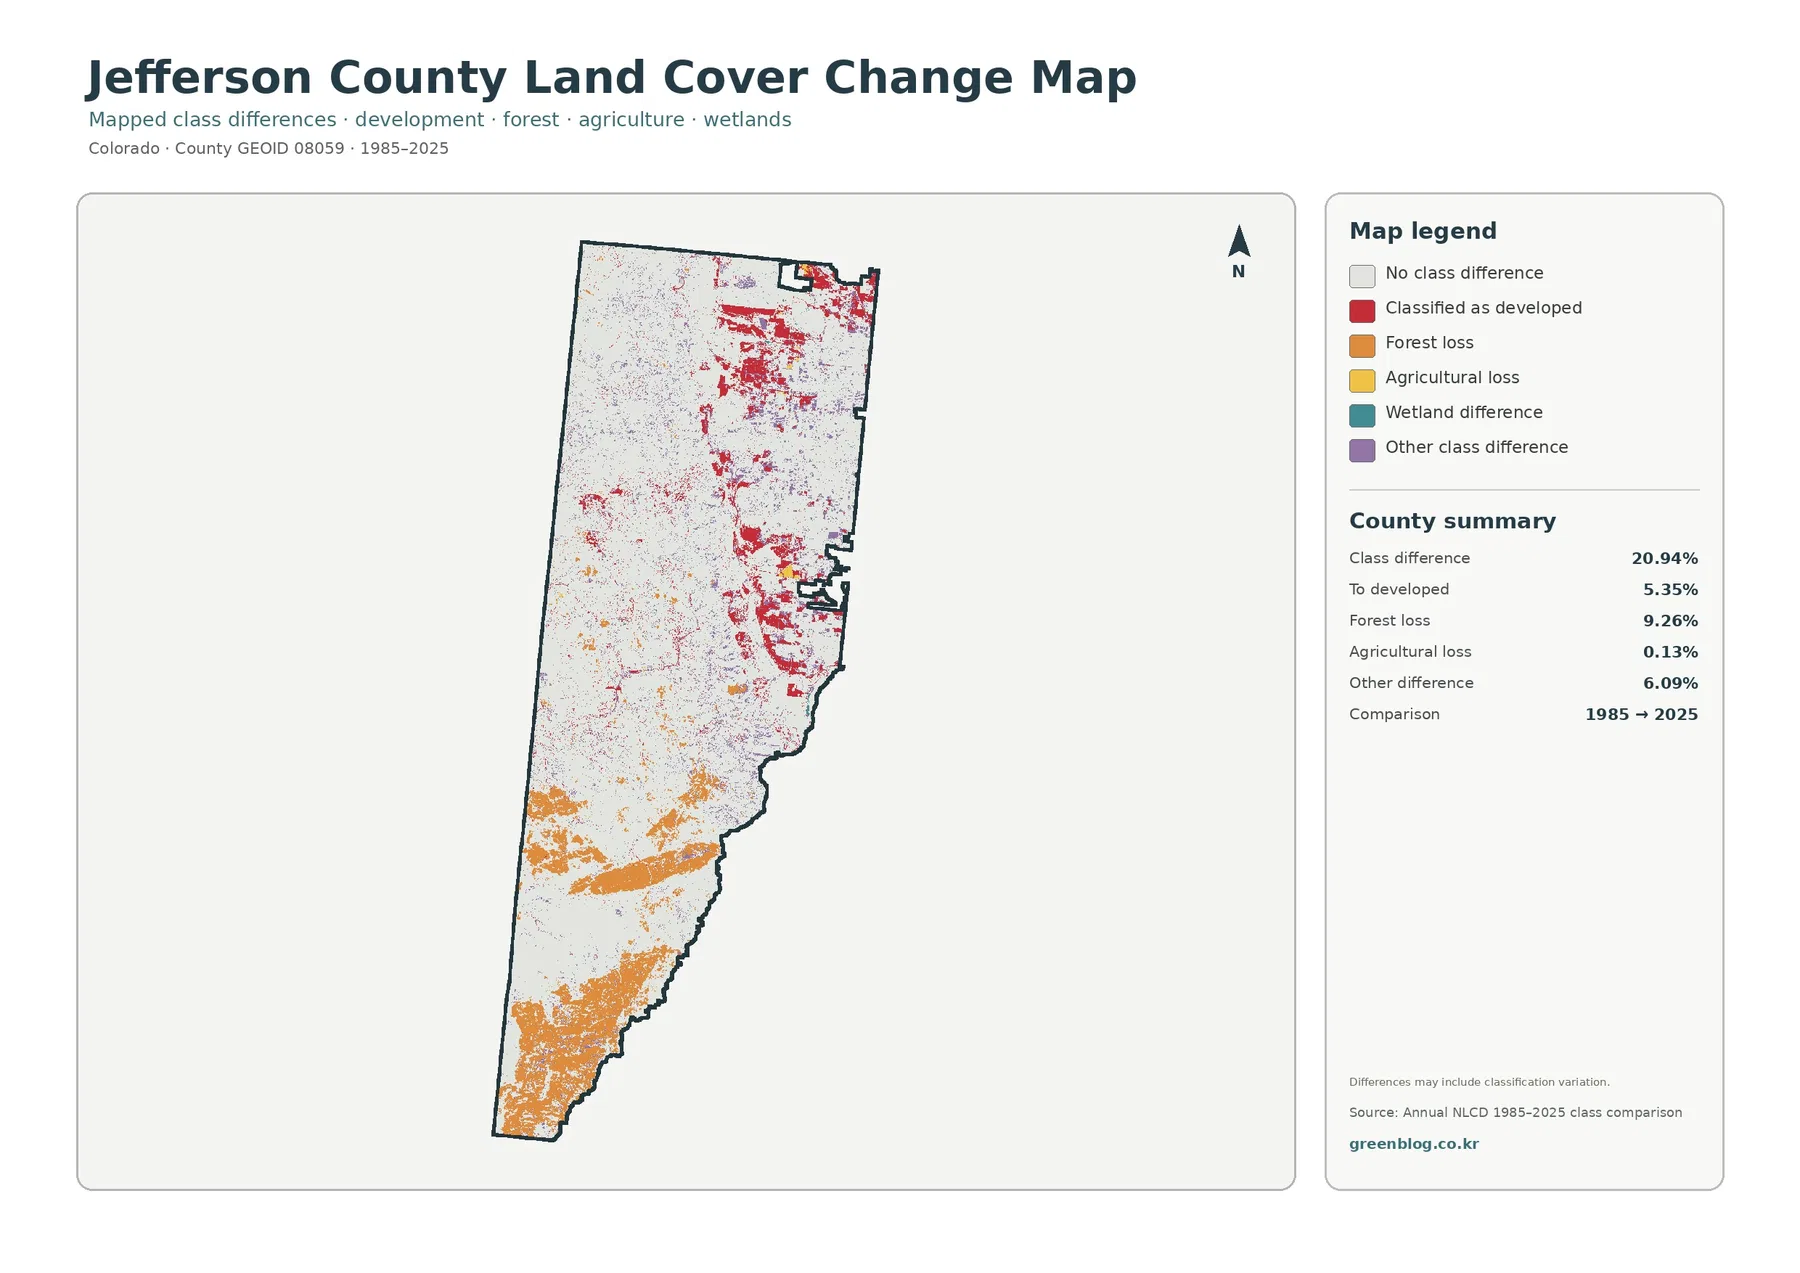
Mapped classes differ across 20.94% of Jefferson County between 1985 and 2025. Forest loss is the largest category at 9.26%, followed by other class difference at 6.09% and conversion to developed at 5.35%. Agricultural loss is only 0.13%.
Red conversion-to-developed cells are concentrated through the east and northeast and extend into parts of the central transition zone. They overlap the general area of current urban cover but do not represent every developed cell in 2025.
Orange forest-loss areas are especially broad in the southwest and south, with additional patches farther north. The 9.26% category identifies a two-date class transition; it does not tell whether fire, insects, forest treatment, development, recovery, or classification variability caused the change.
Local forest-management guidance notes that these forests face stressors including wildfire, habitat fragmentation, mountain pine beetle, and long-term precipitation change. That background is useful for understanding why forest health is an active local issue, but it should not be used to assign a cause to individual change pixels.
Thirty-meter cells are useful for regional patterns, not property decisions
Annual NLCD is raster data built from 30-meter cells. A single cell can contain trees, grass, pavement, rooftops, soil, and water, yet the land-cover layer assigns a representative class. Fractional imperviousness estimates the hard-surface share separately.
This matters greatly on the urban side of Jefferson County. A park, backyard, street, and building can fall within nearby cells and create mixed patterns that do not line up with parcel boundaries. The maps are designed for county-scale comparison, not cadastral or zoning decisions.
The change layer also needs careful interpretation. Forest loss at 9.26% cannot simply be subtracted from current forest at 41.15%, and conversion to developed at 5.35% is not the same thing as current developed cover at 23.29%.
Current land-cover and impervious maps represent 2025. Construction, forest management, fire effects, vegetation recovery, or other changes after that year may not appear. Current site questions should be checked against newer Jefferson County or agency data.
Choose the map based on whether you need current cover, built surfaces, or change
Start with the general land-cover map for the complete county picture. It shows the urban east, forested west, shrub-and-grass foothill transition, wetlands, and water in one frame.
The forest-and-farmland version is better for simplifying the natural-cover side of the county. Imperviousness is the strongest choice for comparing metro development intensity with the mountain west, while the change map is best for 1985–2025 questions.
For a presentation, a three-part comparison works well: Lakewood or Arvada on the urban side, Golden near the transition, and the western mountain area. Those locations show how rapidly surface cover changes within one metropolitan county.
Pairing current land cover with the change map is especially useful. It keeps current forest separate from forest loss and current development separate from conversion to developed, avoiding one of the most common interpretation errors.
Download four original Jefferson County JPG maps
The downloadable ZIP contains four original JPG files: general land cover, forest and farmland, impervious/developed land, and 1985–2025 land-cover change. The WebP images on the page are optimized for quick viewing, while the JPG files are better for enlarging detailed urban and foothill patterns.
Keep the map title, year, and legend with each image when reusing it. Current development and imperviousness, or current forest and forest loss, describe different measurements and should not be labeled as interchangeable.
Frequently Asked Questions
Why does developed land cover such a large share of Jefferson County?
The eastern side contains a substantial part of the Denver metropolitan area, including communities such as Lakewood, Arvada, Wheat Ridge, Westminster, and Golden. Development is concentrated there and drops sharply toward the western mountains.
Why is developed cover 23.29% while mean imperviousness is 9.37%?
Developed cover is a categorical land-cover class, while imperviousness estimates how much of a cell is pavement, rooftops, or another hard surface. Urban cells can still contain lawns, trees, soil, and open space.
Can the forest-loss and development-conversion percentages be treated as current cover?
No. Forest loss at 9.26% and conversion to developed at 5.35% describe 1985–2025 class transitions. Current forest at 41.15% and current developed cover at 23.29% are separate 2025 measurements.
Map File Information
The download ZIP contains four original Jefferson County land-cover JPG maps.
- Included Files: Use only the versions confirmed in the article and supplied images
- File Type: Use the confirmed download contents
- Intended Use: Printing, education, presentations, and map-based projects
Related Maps
- Adams County Colorado Land Cover Map
- Alamosa County Colorado Land Cover Map
- Arapahoe County Colorado Land Cover Map
Sources and References
- MRLC Annual NLCD Data – official access point for Annual NLCD products and data.
- USGS Annual NLCD Land Cover Classification – official documentation for interpreting Annual NLCD classes and 30-meter raster data.
- Jefferson County 2026 County Profile – official county context for metropolitan municipalities, county size, and mountain land.
- Jeffco Parks & Open Space – Forest Management – official information about foothill and mountain forests and local forest-health stressors.
- Jeffco Open Space Region Management Plans – official reference for North Table Mountain, South Table Mountain, Mount Galbraith, and other open-space regions.
Green Map creates custom-edited map images using open geographic data sources such as geoBoundaries, Natural Earth, OpenStreetMap, and government open data.
These maps are edited visual materials, not raw data files, and are provided for education, documents, presentations, and graphic reference.