Forest and shrubland cover almost all of Garfield County in the 2025 summary, yet the county does not look uniform on the map. Forest accounts for 48.32% and shrubland for 43.93%, a combined 92.25%. Developed cover is only 2.35%, but it is concentrated in a narrow southern band that stands out sharply against the surrounding natural cover.
This page compares four views of the same county: current land cover, forest and farmland, impervious surface, and mapped class differences from 1985 to 2025. The four original JPG maps are also packaged in one ZIP near the end of the article for printing, classroom use, presentation graphics, and closer inspection.
Table of Contents
Forest and shrubland form a broad mosaic around a narrow settled corridor
The 2025 land-cover summary is led by forest at 48.32% and shrubland at 43.93%. Agriculture is 1.89%, wetlands 1.47%, grassland 1.15%, developed cover 2.35%, and water 0.26%. The two dominant natural classes occupy more than nine-tenths of the county, but their distribution is broken into large irregular areas rather than an even mixture.
Forest is especially extensive across the western edge, the northern and eastern high country, and many interior slopes. Shrubland forms broad tan areas through the west-central and southwestern portions and appears between forest blocks elsewhere. The northeastern extension of the county also contains repeated forest–shrub transitions, which makes a simple east-versus-west description inadequate.
Developed land has a very different shape. Red pixels form a narrow band across the southern part of the county, with several larger clusters linked by thinner traces. The band becomes especially noticeable in the south-central and southeastern portions. Because development is concentrated rather than evenly scattered, its 2.35% countywide share looks much more prominent locally.
Garfield County’s Comprehensive Plan 2030 describes the Colorado River and Roaring Fork River corridors as important links between communities. The NLCD images in this article do not label the rivers or highways, but the narrow southern development pattern can be compared with that official geographic framework. The overlap in general location is useful context; it does not prove that a river or road caused a particular developed pixel.
Land cover should also be kept separate from zoning, ownership, and legal land use. Annual NLCD classifies the surface within raster cells. A forest pixel does not identify the owner or management regime, and a developed pixel does not tell whether the land is residential, commercial, public, or private. These maps are most useful for county-scale pattern comparison.
Impervious surface is scarce countywide but concentrated in the southern band
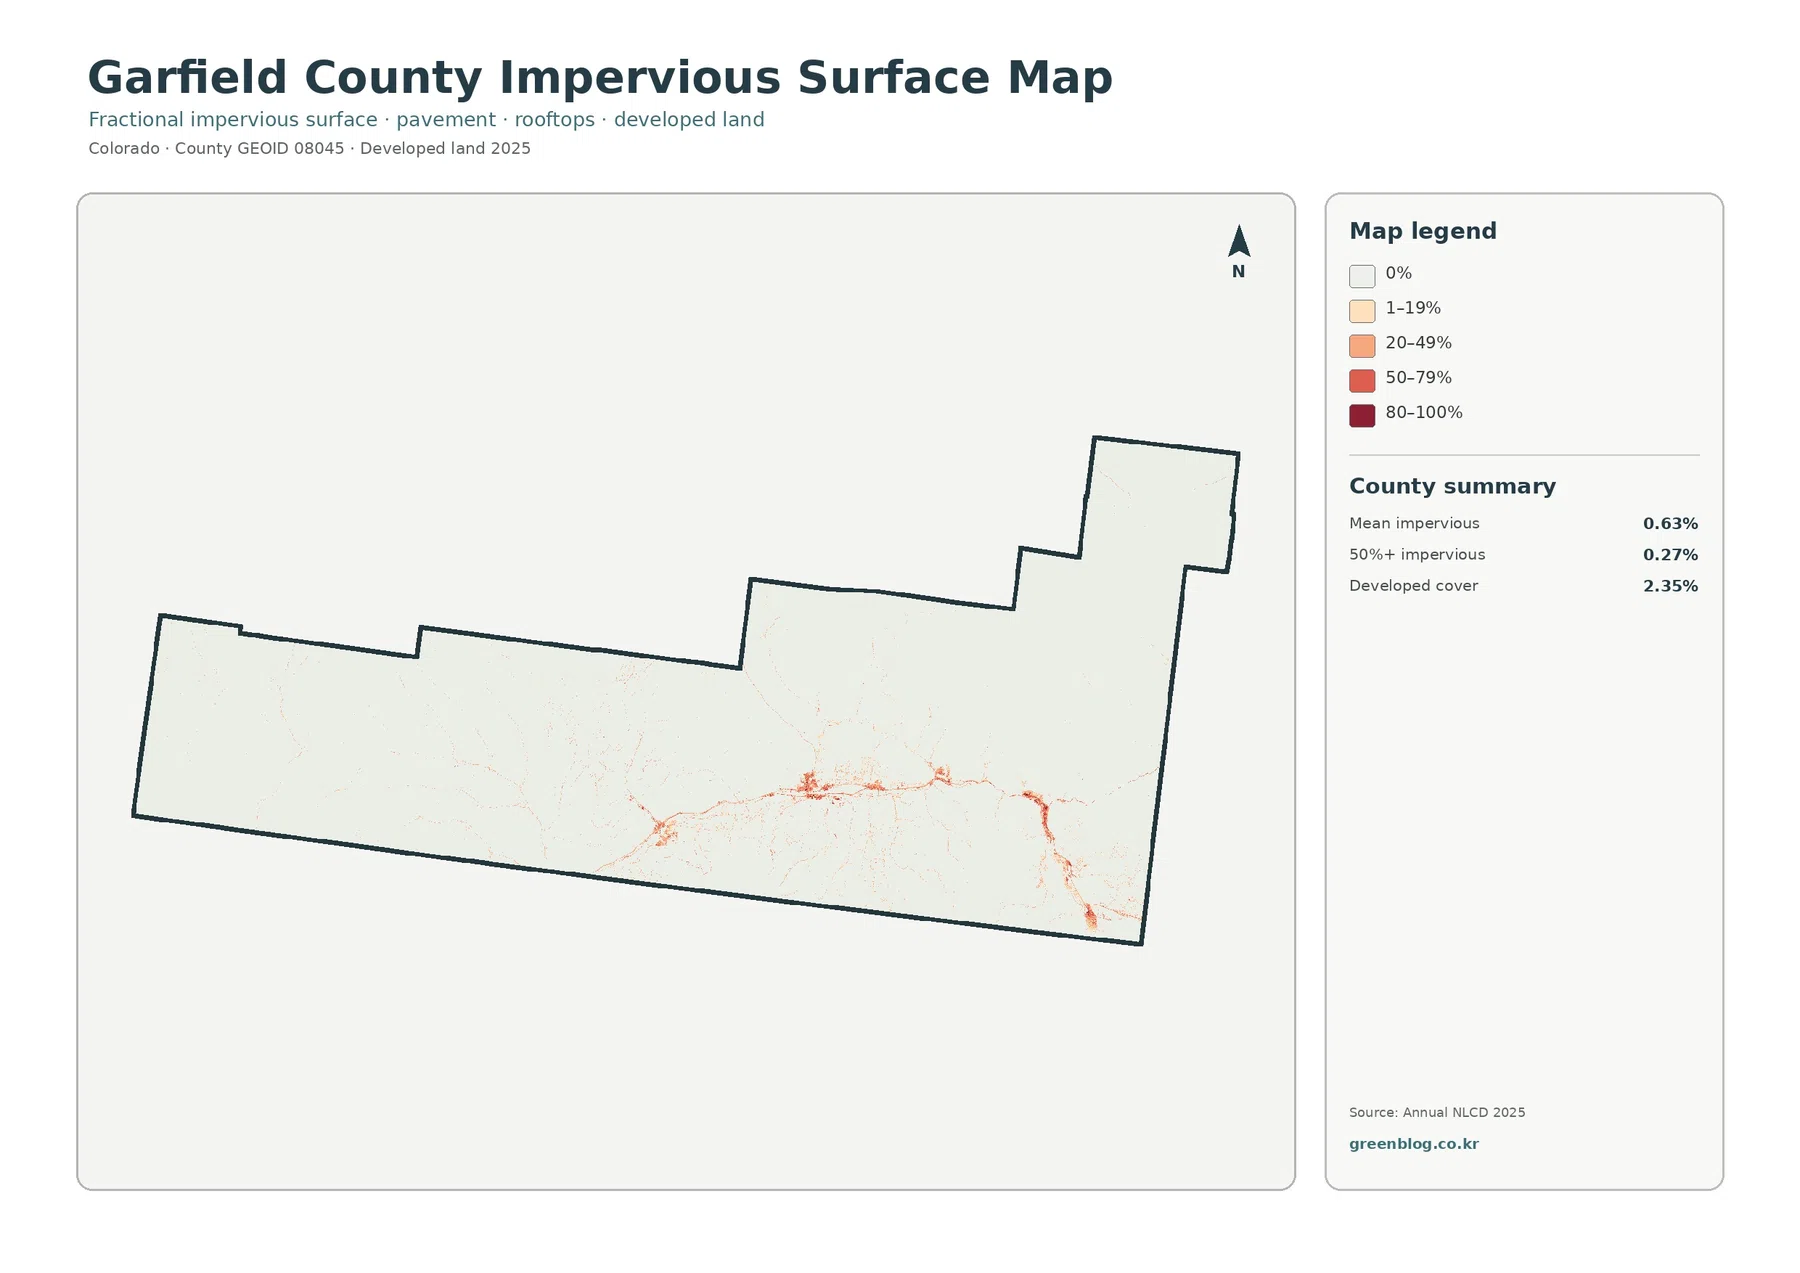
Mean imperviousness is only 0.63% across Garfield County, and cells that are at least 50% impervious account for 0.27%. Most of the county is therefore nearly white on this map. The higher values are concentrated in a small part of the landscape, which makes them easy to locate even though they cover little area overall.
Orange and red pixels appear in several clusters through the south-central county and continue eastward in thin, curved traces. The southeastern portion contains one of the clearest linear concentrations. By contrast, the broad forest and shrubland areas to the north and west show very little high imperviousness.
The 2.35% developed-cover value and 0.63% mean imperviousness measure different things. Land cover assigns a categorical surface class to a cell, while fractional imperviousness estimates the share of hard surface within that cell. A developed area can contain lawns, trees, exposed soil, and other permeable surfaces, so the two percentages should not be expected to match.
Garfield County’s official Future Land Use GIS includes I-70, other major roads, rivers and lakes, streams and ditches, municipalities, and public lands. That source can help orient the thin impervious pattern to known transportation and settlement geography. The NLCD layer itself does not label those features, and it should not be used to infer traffic volume or road design.
Current land cover shows where forest, shrubland, agriculture, and wetlands separate
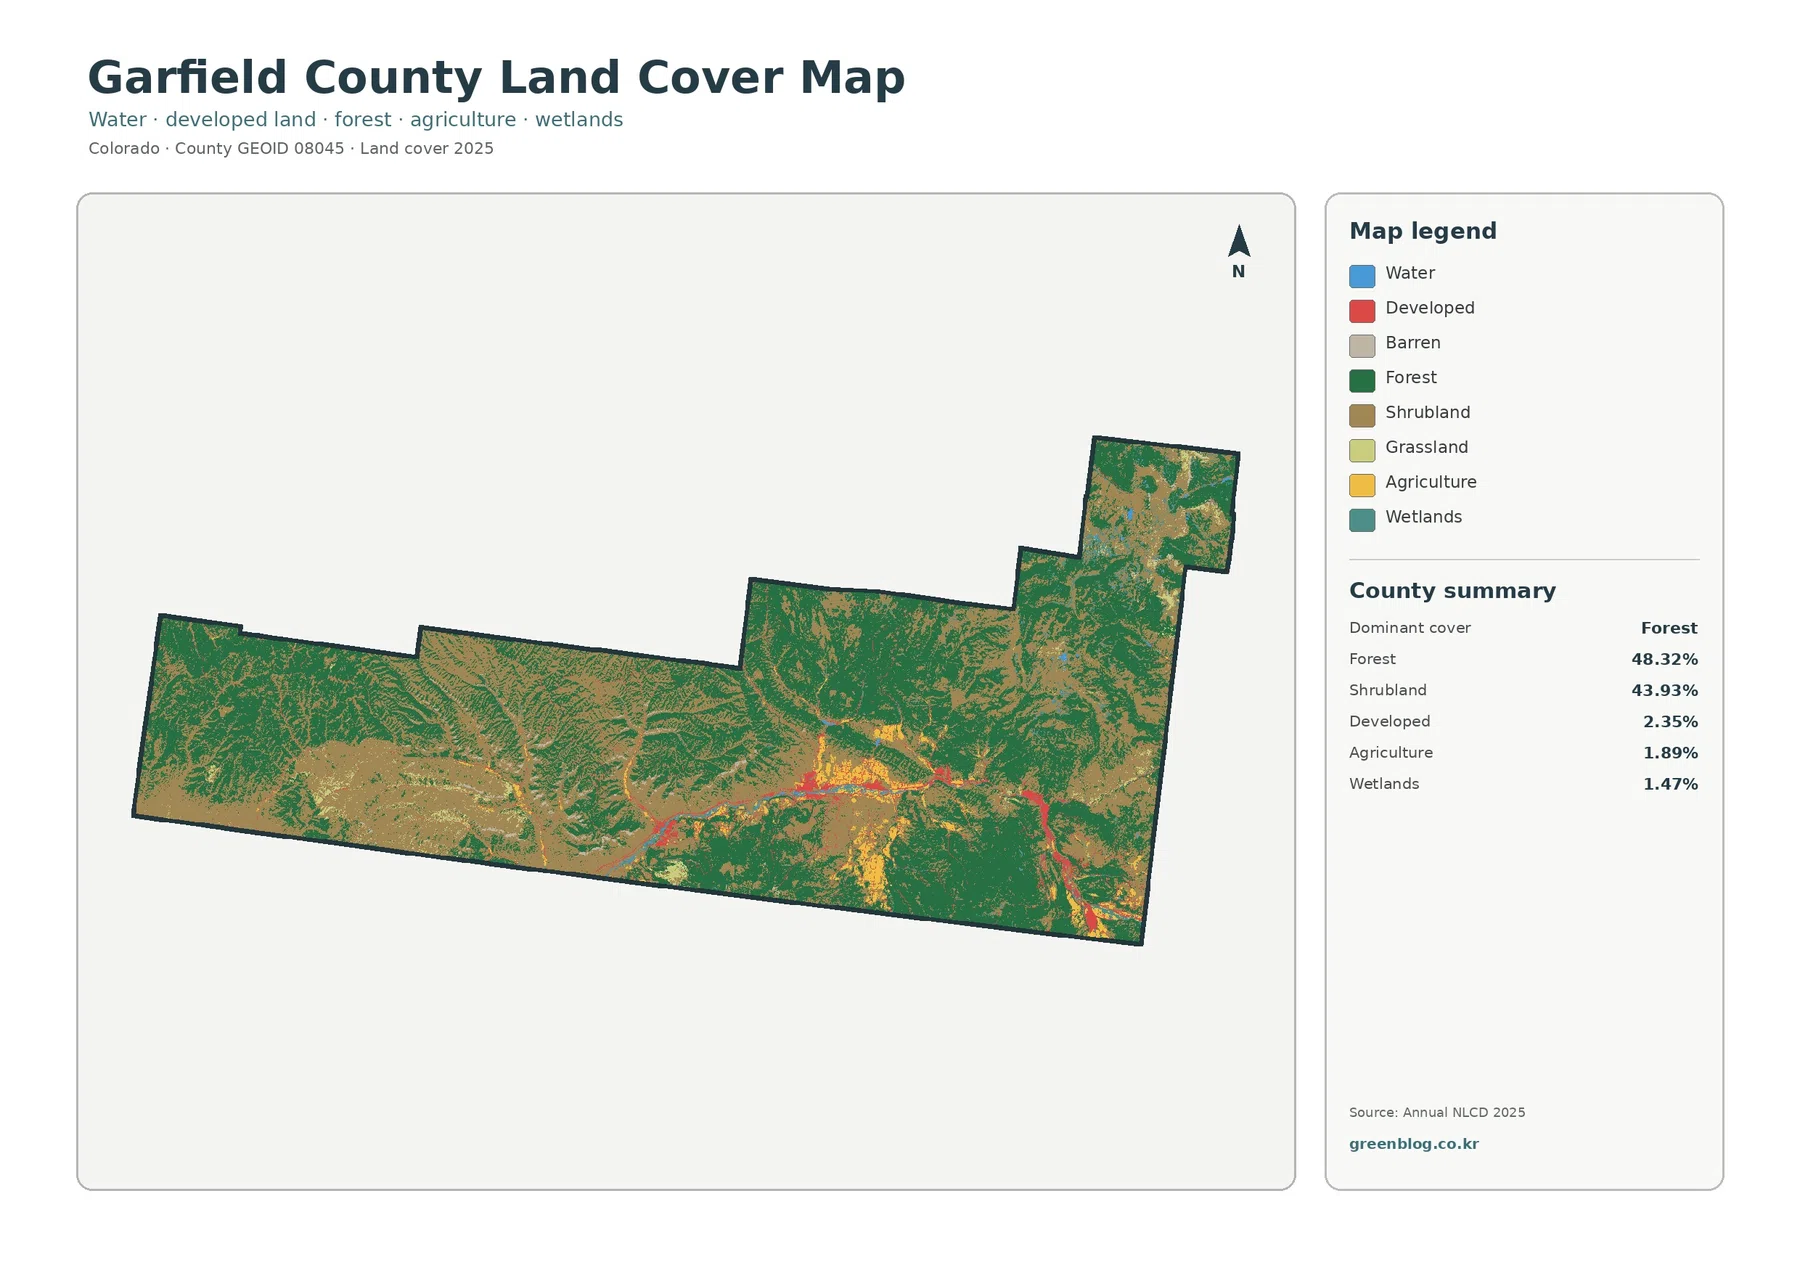
The full land-cover map makes the county’s natural-cover pattern easiest to understand. Dark forest and tan shrubland occupy large connected areas, but they repeatedly replace one another along complex boundaries. Forest is especially broad in the east and north, while shrubland is conspicuous in several west-central and southwestern blocks.
Agriculture is only 1.89% of the county. Yellow agricultural pixels are most visible near parts of the southern development band, where they form short strips and compact patches. They are much less common across the large northern and western natural-cover areas. The map therefore shows agriculture as a localized valley or corridor feature rather than a countywide background.
Wetlands account for 1.47% and appear as narrow blue-green traces and small patches within the larger forest and shrubland landscape. Water is only 0.26%, so individual water features can be difficult to see in a reduced web preview. The original JPG is more useful when small wetland or water pixels need to be examined closely.
Grassland is 1.15% and does not form a broad prairie across Garfield County. It appears in limited openings between other natural classes. This is an important distinction from eastern Colorado counties where grassland can dominate the entire map. Garfield County’s basic visual structure is instead controlled by forest and shrubland.
The forest-and-farmland map makes the southern agricultural pockets easier to find
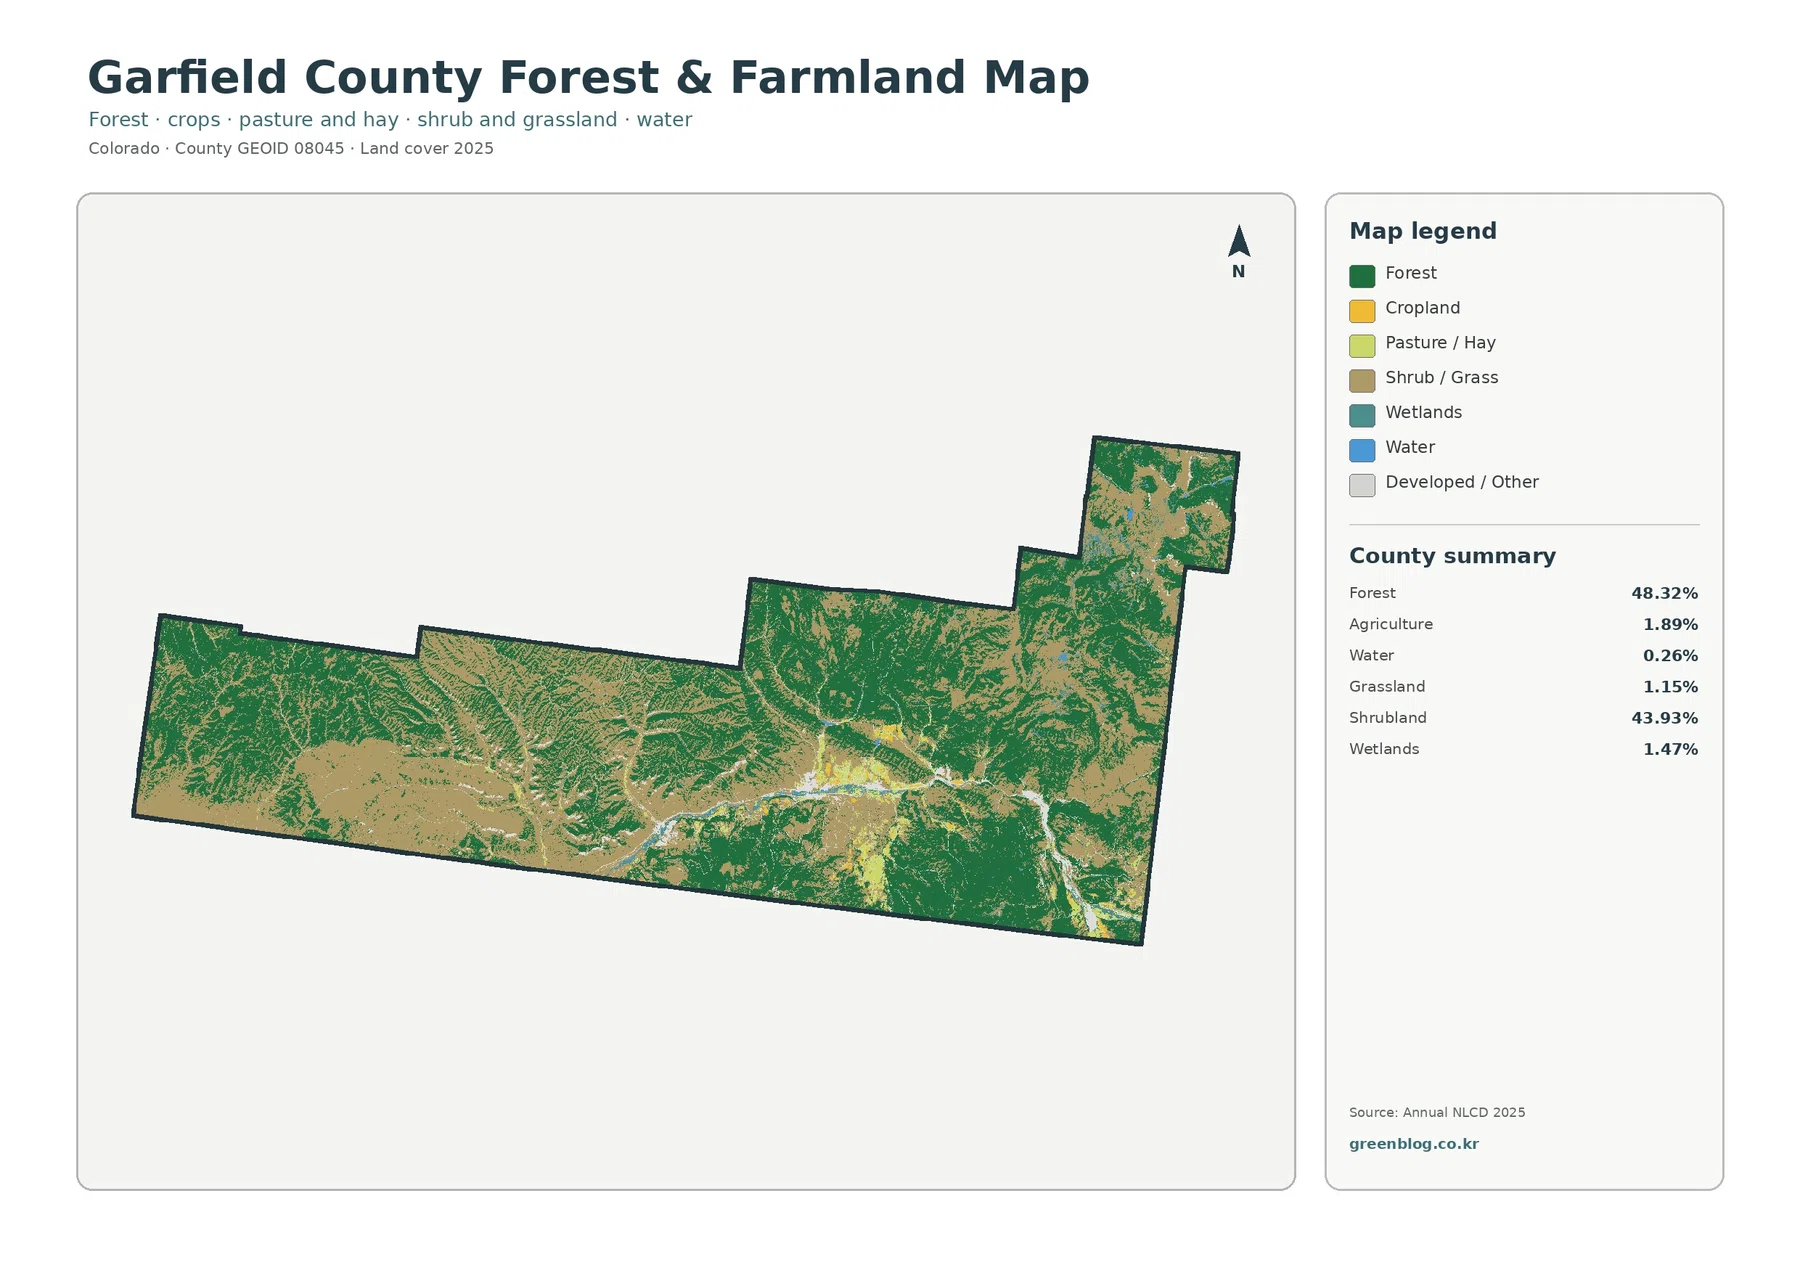
The simplified map removes several detailed classes so the broad contrast between forest, shrub-and-grass cover, and agriculture is easier to follow. Forest remains dark green across large western, northern, and eastern sections. Shrub and grass form broad tan areas through the interior and southwest, creating a patchwork rather than one continuous zone.
Agricultural colors are concentrated close to the southern developed-or-other band. Some yellow and light green patches run parallel to the main corridor, while others form small blocks beside it. Their total share is small, but grouping the other natural classes makes these farm and pasture areas easier to spot than on the full land-cover map.
Garfield County’s official Land Use GIS includes historically irrigated lands along with rivers, lakes, streams, ditches, public lands, municipalities, and other land-use information. That GIS and the NLCD map answer different questions. The county GIS provides administrative and land-use context, while NLCD shows the mapped 2025 surface class.
Neither map should be treated as a farm parcel map. A raster agricultural class does not identify ownership, crop type, irrigation rights, or a surveyed boundary. Likewise, shrub or grass cover does not prove that land has no agricultural use. Use these images to locate broad patterns and a more specialized dataset for parcel-level questions.
The 1985–2025 comparison has a large forest-loss category and widespread other differences
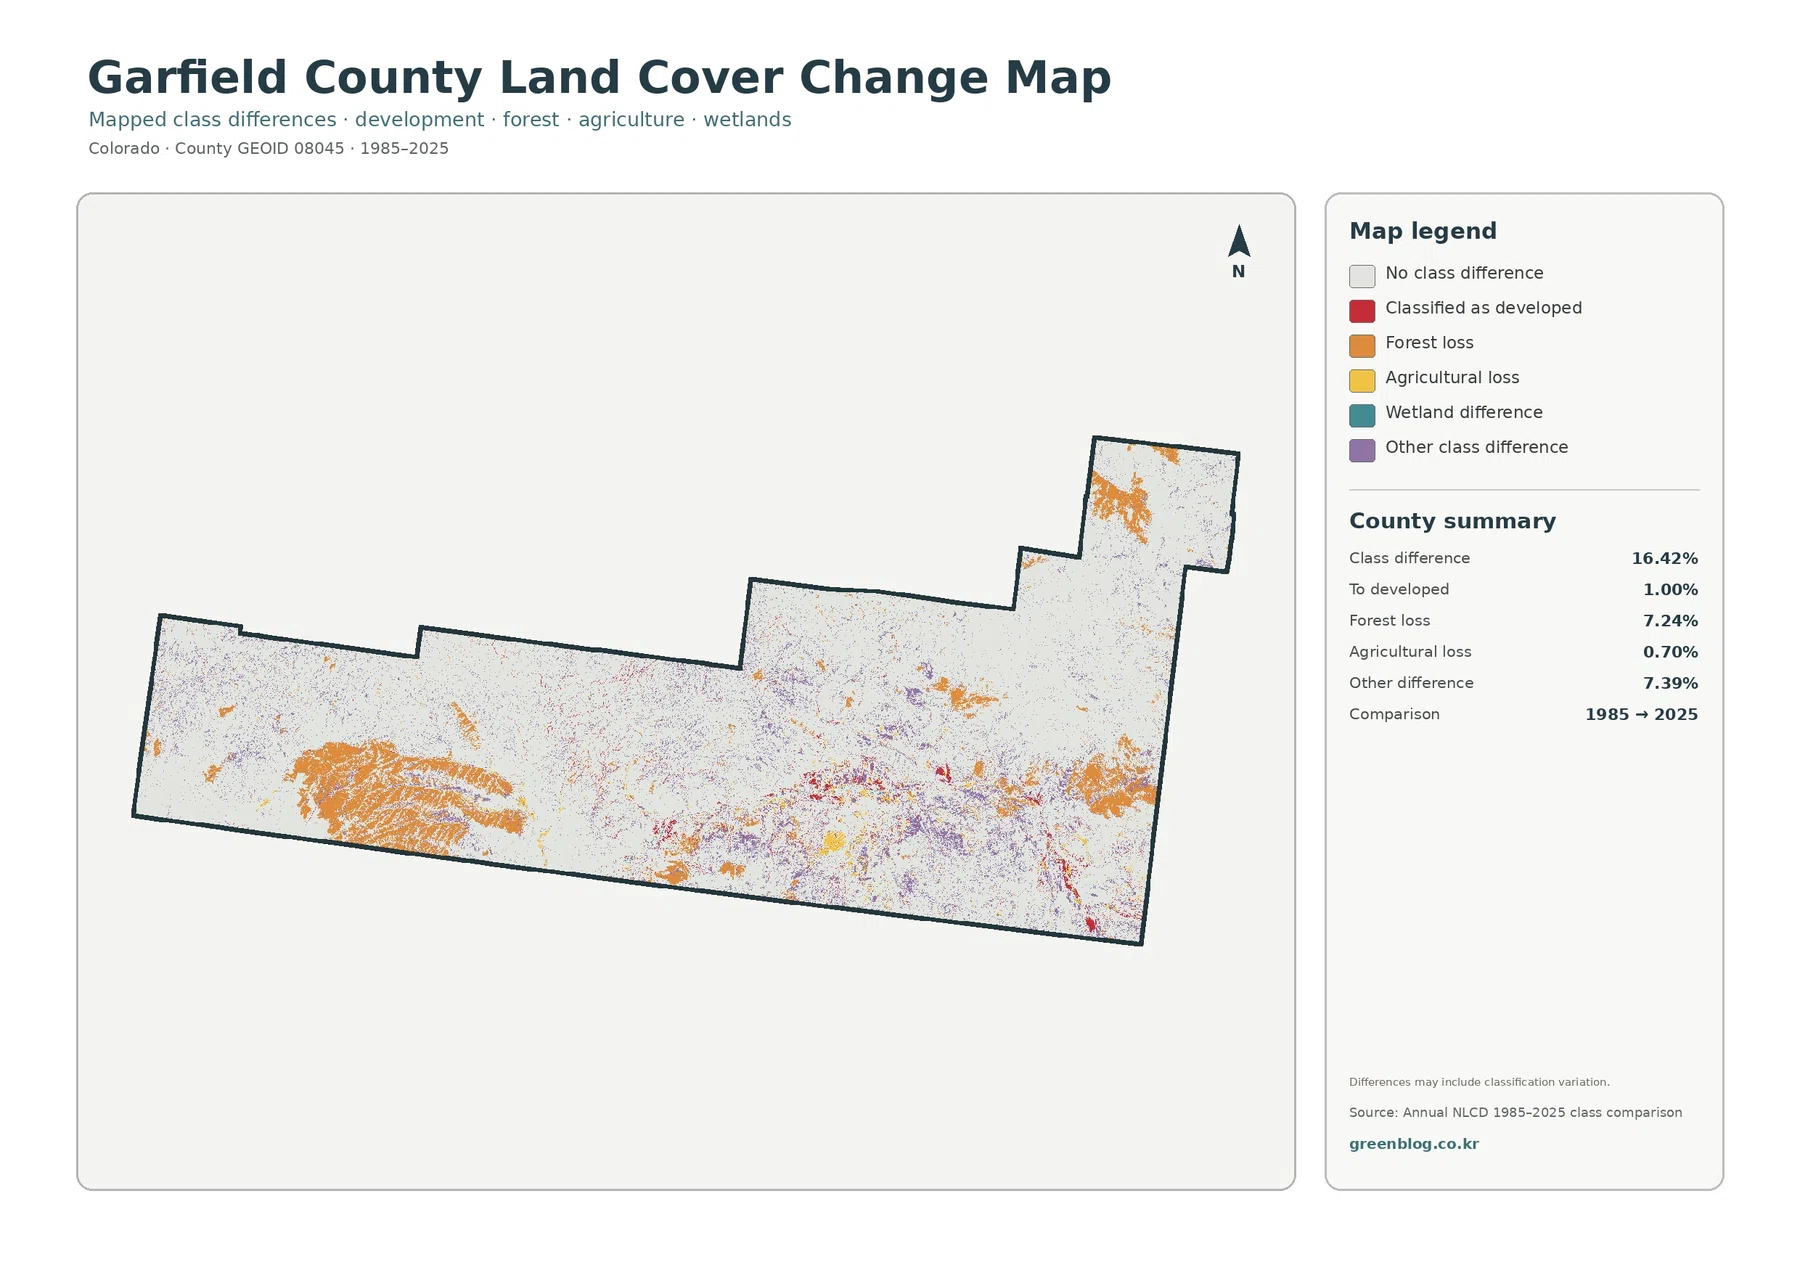
The change summary reports a class difference across 16.42% of Garfield County between 1985 and 2025. Other class difference accounts for 7.39%, forest loss for 7.24%, conversion to developed for 1.00%, and agricultural loss for 0.70%. Most of the county remains in the no-class-difference background, but the colored change areas are substantial enough to form several clear regional patterns.
Forest-loss pixels are especially extensive in the southwest, where orange areas form large irregular blocks. Additional orange concentrations appear in the east and in the northeastern extension, with smaller patches scattered through other forested areas. The 7.24% figure is significant, but this map does not identify why a cell moved out of a forest class.
Fire, vegetation disturbance, harvest, development, recovery, and classification variation cannot be separated from the change layer alone. A large orange patch therefore deserves follow-up, not an immediate explanation. Intermediate-year imagery and local fire or forest records are needed before assigning a cause to a specific area.
Red conversion-to-developed pixels are concentrated mainly along the southern settled band. They occur as compact patches and fine linear features rather than a broad countywide conversion. Current developed cover is 2.35%, while the two-date conversion category is 1.00%. Those values answer different questions and should not be combined as though they describe one statistic.
The largest named category is “other difference” at 7.39%. Purple pixels are scattered across the west, center, and east in many irregular shapes. The map warns that differences can include classification variation. Broad repeated patches are more useful for identifying areas to investigate than isolated individual pixels.
Using the Colorado River and Roaring Fork corridors as geographic reference
The county comprehensive plan describes transportation and community connections through the Colorado River and Roaring Fork River corridors. Glenwood Springs, the county seat, is located at the confluence of the Roaring Fork and Colorado rivers. Those official geographic references help readers orient the long southern development pattern even though the supplied land-cover images do not label towns or rivers.
Within that southern part of the county, the four maps emphasize different aspects of the same general area. The current map shows developed and agricultural classes, the impervious map shows where hard surfaces are most concentrated, and the change map identifies some cells that were classified as conversion to developed between 1985 and 2025. Similar location does not make the three measures interchangeable.
Farther from the river-corridor communities, different questions become more important. In the west and north, the boundary between forest and shrubland is more useful than development. In the northeastern extension, current forest and shrubland can be compared with the large forest-loss patches on the change layer. This prevents the southern settlement pattern from becoming the only story told about the county.
The natural-resources section of Garfield County’s Comprehensive Plan emphasizes wildlife habitat, migration corridors, riparian areas, water quality, and other resources. Those planning priorities are not land-cover classes, but they provide a local reason to keep forest, shrubland, wetlands, and developed surfaces distinct when using the maps for broad environmental context.
Why 30-meter cells and a two-date comparison need careful interpretation
Annual NLCD is raster data produced with 30-meter cells. A cell can contain trees, shrubs, soil, pavement, buildings, grass, or water, yet the land-cover product assigns a representative class. Fractional imperviousness handles one part of that mixture differently by estimating the share of hard surface inside the cell.
That generalization matters for small classes in Garfield County. Agriculture is 1.89%, water 0.26%, and highly impervious cells cover 0.27%. Narrow features may become difficult to see when the map is reduced, and raster boundaries should not be treated as surveyed parcel, stream, or wetland boundaries.
The change layer requires another level of caution. A different mapped class in 1985 and 2025 does not automatically reveal the physical process that produced the difference. This is especially important for the 7.24% forest-loss category and the 7.39% other-difference category. The map is useful for locating change, not for assigning a cause.
The current land-cover and impervious maps represent 2025. Construction, fire effects, vegetation recovery, or agricultural change after that year may not appear. For current site decisions, use the maps as a county-scale baseline and verify conditions with newer local information.
Choosing the right Garfield County map for the question
Start with the general land-cover map for a complete county overview. It shows how the 48.32% forest share and 43.93% shrubland share divide the county while also locating the narrow southern development band, agricultural pockets, wetlands, and small water features.
The forest-and-farmland map is the better choice when the main question concerns natural cover and agriculture. Fewer legend categories make the southern farm areas easier to identify beside the much larger forest and shrub-and-grass landscape. For built surfaces, the impervious map is more informative because it shows hard-surface intensity rather than only a developed class.
Use the change map when time is part of the question. Pair it with the 2025 map so that forest loss is not mistaken for current forest cover and conversion to developed is not mistaken for every current developed pixel. Side-by-side viewing is especially helpful in the southwest and northeastern areas where forest-loss colors are extensive.
For classroom lessons or presentations, one effective comparison is the southern settlement corridor versus a western or northern natural-cover area. Environmental discussions can pair forest-and-farmland with imperviousness, while a change-focused presentation can pair current land cover with the 1985–2025 layer.
Download the four Garfield County JPG maps
The downloadable ZIP contains four original JPG files: the general land-cover map, forest-and-farmland map, impervious/developed-land map, and 1985–2025 land-cover change map. The WebP images in the article are optimized for quick web viewing, while the JPG files can be opened separately for closer inspection or printing.
Keep each map’s title, year, and legend when reusing the images. Current forest and forest loss are different measurements, as are current developed cover, conversion to developed, and fractional imperviousness. Clear labels prevent these related datasets from being confused.
The set is useful for county-scale landscape comparison, environmental education, presentation graphics, general planning context, and locating areas of mapped long-term change. It is not a substitute for property records, zoning, surveyed wetland boundaries, engineering plans, or parcel-level land-use decisions.
Frequently Asked Questions
What are the dominant land-cover classes in Garfield County?
Forest is the largest 2025 class at 48.32%, followed closely by shrubland at 43.93%. Together they cover 92.25% of the county, although their relative importance varies considerably from one part of the map to another.
Why is mean imperviousness only 0.63% when developed cover is 2.35%?
Developed cover is a categorical land-cover class, while imperviousness estimates the share of pavement, rooftops, and other hard surfaces within each cell. Developed cells can still contain trees, grass, and soil, so the two percentages do not need to match.
Does 7.24% forest loss mean that amount of forest was definitely destroyed?
No. The 7.24% figure is the share of cells placed in the forest-loss category in the 1985–2025 class comparison. Real surface change may be included, but the map does not identify the cause and classification variation may also contribute.
Map File Information
The download ZIP contains four original Garfield County land-cover JPG maps.
- Included Files: Use only the versions confirmed in the article and supplied images
- File Type: Use the confirmed download contents
- Intended Use: Printing, education, presentations, and map-based projects
Related Maps
- Adams County Colorado Land Cover Map
- Alamosa County Colorado Land Cover Map
- Arapahoe County Colorado Land Cover Map
Sources and References
- MRLC Annual NLCD Data – official access point for Annual NLCD products and data.
- USGS Annual NLCD Land Cover Classification – official documentation for interpreting Annual NLCD classes and 30-meter raster data.
- Garfield County Comprehensive Plan 2030 – official county context for the Colorado River and Roaring Fork River corridors, natural resources, and long-range planning.
- Garfield County Land Use GIS – official county mapping for rivers, streams, historically irrigated lands, public lands, municipalities, and land-use information.
- U.S. Census Bureau TIGER/Line Shapefiles – official geographic boundary reference.
Green Map creates custom-edited map images using open geographic data sources such as geoBoundaries, Natural Earth, OpenStreetMap, and government open data.
These maps are edited visual materials, not raw data files, and are provided for education, documents, presentations, and graphic reference.