El Paso County has one of the clearest west-to-east land-cover contrasts in Colorado. Forest occupies much of the mountainous western side, a large developed area fills the central-western part of the county, and grassland spreads across most of the eastern prairie. The 2025 summary puts grassland at 69.28%, but its location is just as important as its percentage.
This page pairs that current landscape with a forest-and-farmland view, a map of impervious surfaces such as pavement and rooftops, and a 1985–2025 class-change comparison. The four original JPG maps are available together in one ZIP near the end of the article for printing, teaching, presentations, and side-by-side reference.
Table of Contents
A county where prairie, city, and mountain forest meet
The county summary is dominated by grassland at 69.28%. Developed cover accounts for 12.82%, forest for 10.96%, shrubland for 5.01%, and wetlands for 1.25%. Agriculture is only 0.39% and water 0.12%. Those numbers describe the county as a whole, but the map reveals a much more organized pattern than a list of percentages suggests.
Most of the eastern half is a broad grassland field broken by thin linear developed features and occasional small agricultural patches. Forest becomes much more extensive toward the western boundary and also appears in substantial northern clusters. Between those landscapes, the largest developed concentration forms a broad north–south zone in the central-western county.
El Paso County’s own geographic description provides a useful frame for that contrast. The county says its western portion is extremely mountainous while the east is prairie, and it identifies Colorado Springs as the county seat. The surface classes in the NLCD map fit that broad geography: forest is strongest toward the mountains, while grassland is widespread across the prairie. The land-cover layer itself does not measure elevation or geology.
Land cover is also different from zoning, ownership, or legal land use. Annual NLCD classifies the surface detected within raster cells, so a developed cell does not identify a particular zoning district and a grassland cell does not reveal who owns the land. These maps are best for county-scale comparison rather than parcel-level decisions.
The impervious map makes the Colorado Springs area stand out
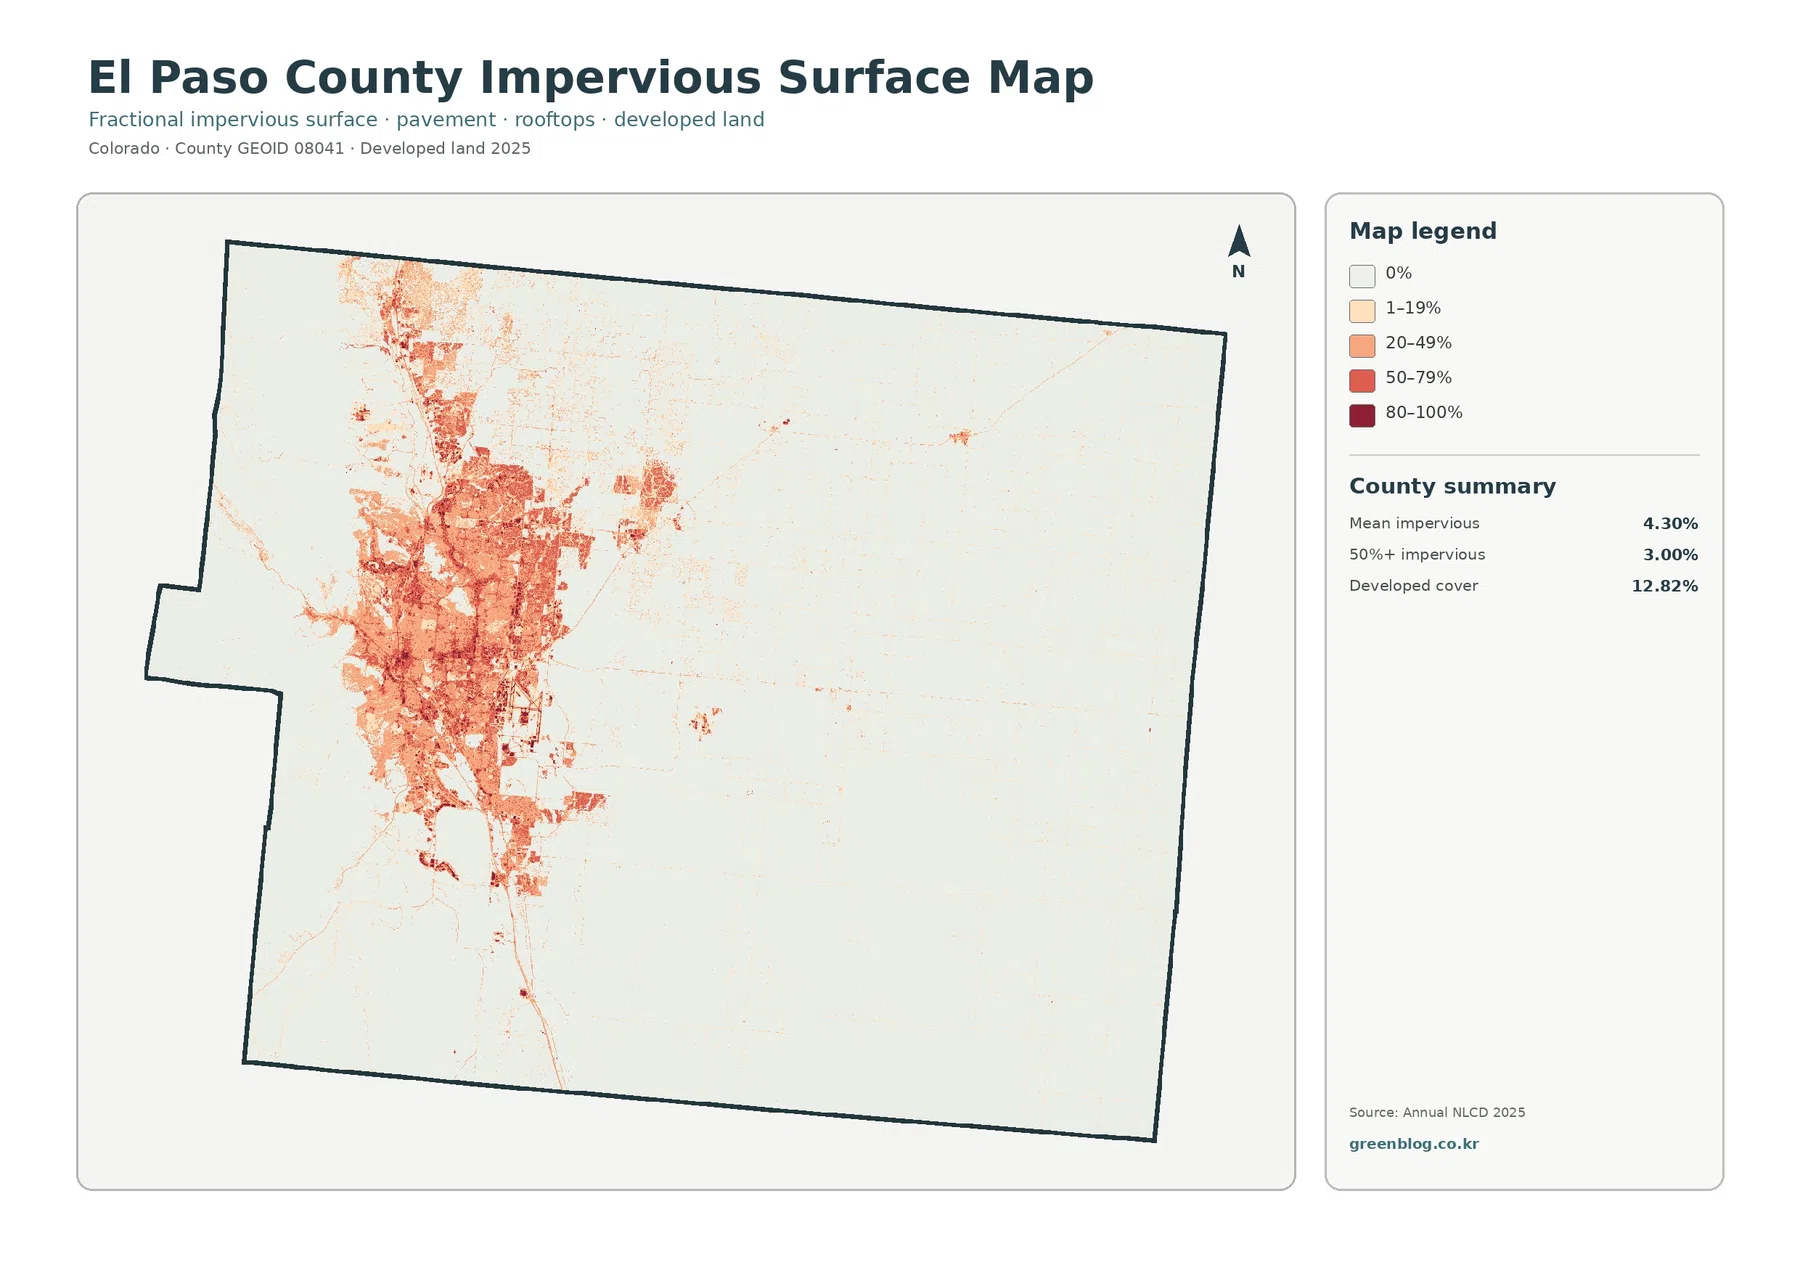
Impervious surfaces are hard surfaces such as roads, parking areas, and rooftops that limit how easily water can soak into the ground. El Paso County’s mean imperviousness is 4.30%, while 3.00% of the county is mapped in cells that are at least 50% impervious. Those countywide values remain modest because most of the eastern prairie and western mountain areas have little hard surface.
The spatial pattern is far from uniform. Orange and red values form a large connected concentration in the central-western county and extend north and south from its core. Outside that area, most of the map is pale, with only thin lines or isolated developed spots crossing the eastern grasslands. This is why the county average should never be read as though every part of El Paso County has similar surface conditions.
County planning documents describe the main urban area as being concentrated along the Interstate 25 corridor, with Colorado Springs as the county’s largest city and Fountain, Manitou Springs, Monument, Palmer Lake, and other communities elsewhere in the county. The NLCD map does not label I-25 or municipal boundaries, but the large central-western impervious concentration occupies the same general part of El Paso County.
Developed land cover and imperviousness should still be kept separate. The 12.82% developed share assigns cells to developed land-cover classes, while the 4.30% impervious mean estimates the hard-surface fraction. A developed neighborhood can contain lawns and other permeable areas, and a narrow paved road can appear as an impervious feature without creating a large developed block.
The 2025 land-cover map shows the full transition from west to east
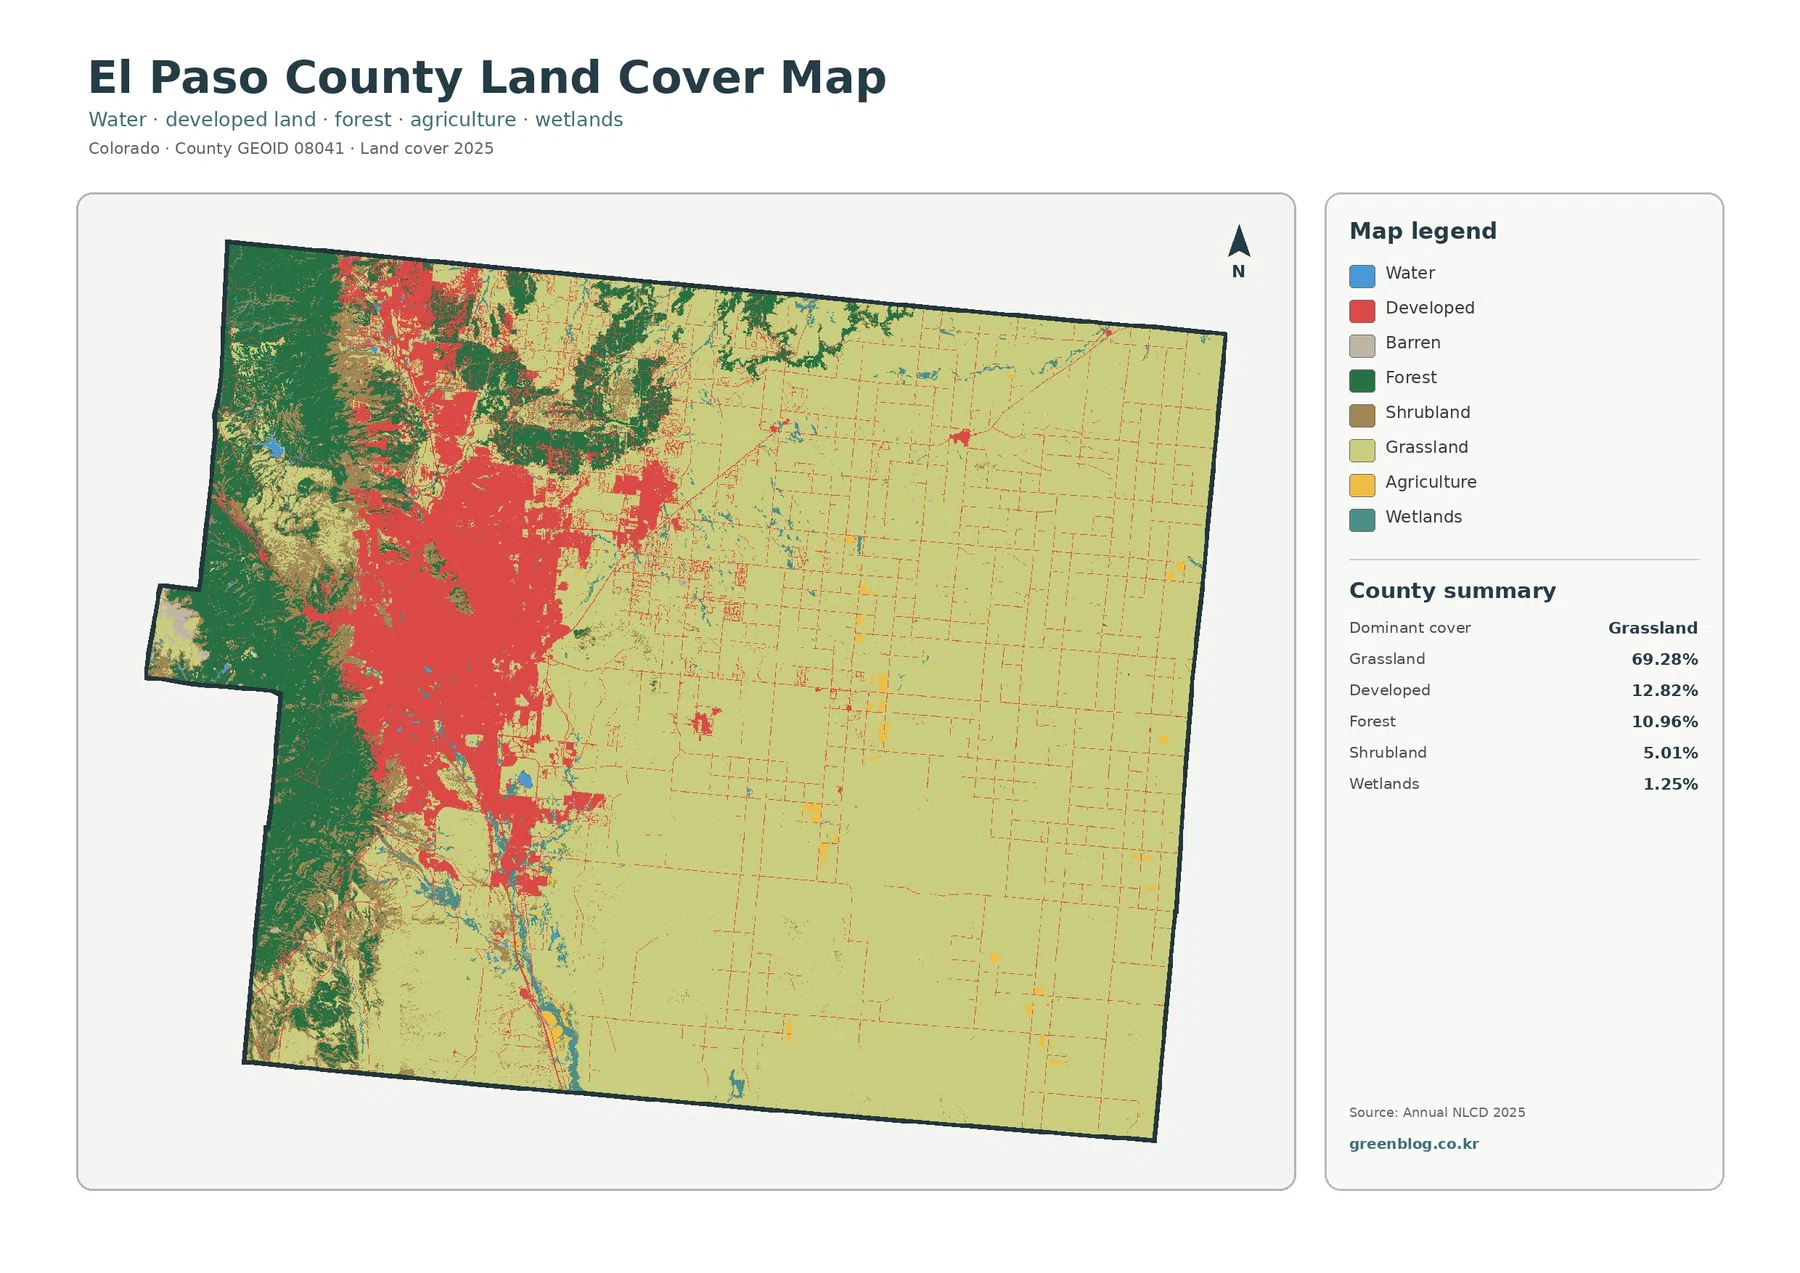
On the full land-cover map, the eastern prairie is the dominant feature. Pale green grassland covers large uninterrupted areas from the center of the county toward the eastern boundary. A grid of thin developed lines and scattered small patches crosses this area, but those features do not displace the overall grassland pattern.
The western side looks completely different. Dark forest colors cover the mountain edge and remain important across several northwestern and north-central areas. Forest is only 10.96% of the county as a whole, yet it can dominate the view locally because most of that cover is concentrated rather than evenly dispersed. The transition from forest into developed and grassland areas is especially complex around the central-western side.
Developed cover forms the map’s strongest red concentration. It spreads across a large central-western area and extends in long branches north and south. Smaller developed spots also appear farther east, but the eastern county never becomes a continuous urban surface. The result is a sharp difference between a densely developed western-center and a much more open prairie landscape.
Agriculture is just 0.39%, so yellow agricultural pixels appear as small rectangular fields rather than a broad belt. Wetlands at 1.25% and water at 0.12% are also limited and often narrow. Small classes are easy to overlook in a web preview, which is why the legend percentages should be used together with the visible pattern instead of relying on color area alone.
The simplified map separates forest from the eastern grasslands
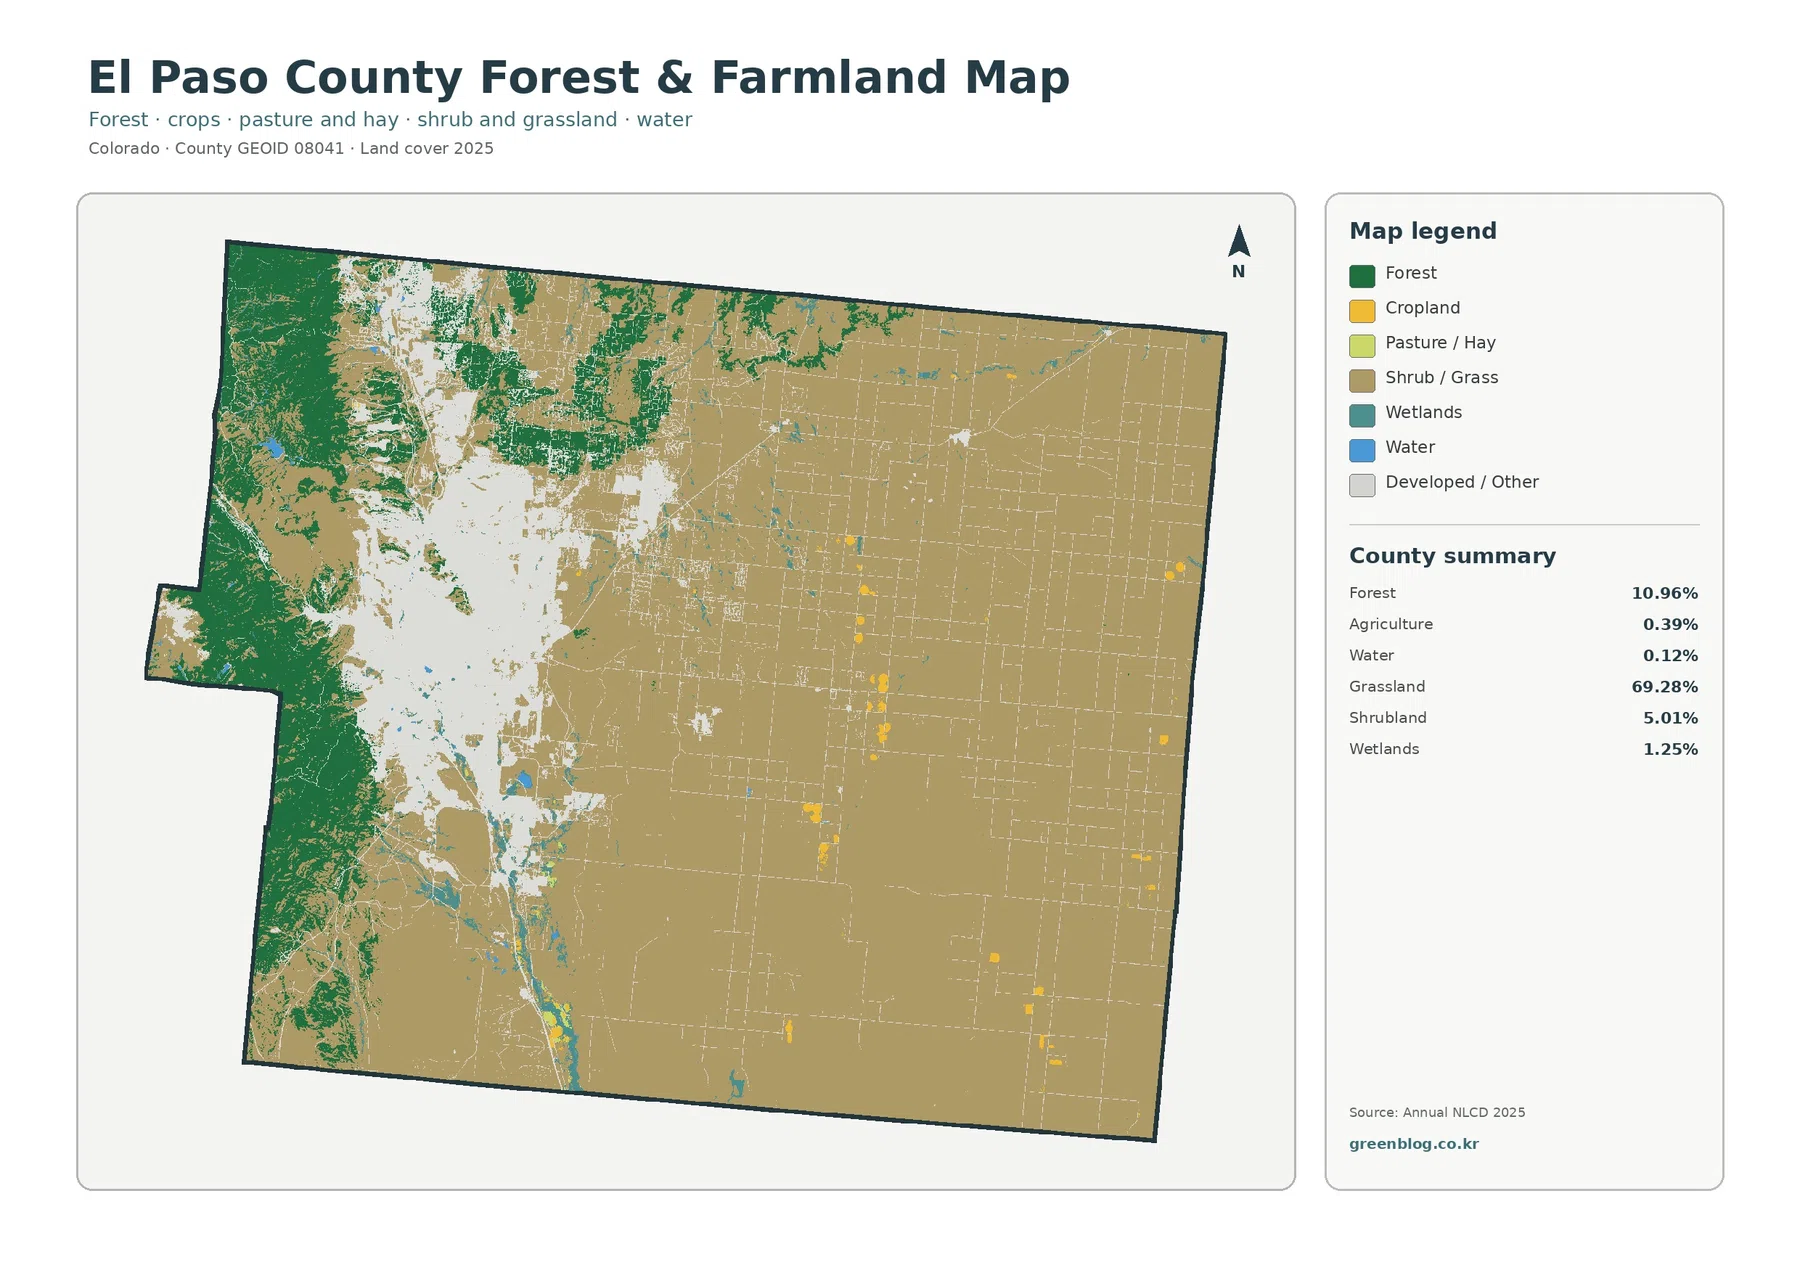
Removing the extra land-cover classes makes the county’s natural-cover contrast easier to follow. Forest remains dark green along the western mountain side and across several northern areas. Shrub and grass merge into a broad tan background across much of the east, making the prairie side look even more continuous than it does on the general map.
The large central-western urban area becomes a pale developed-or-other zone on this version. Its irregular edges cut between the western forests and the eastern grasslands. Instead of asking how intense the development is, this map is better used to see which natural-cover groups border the developed area and where forest remains close to urbanized land.
Agricultural cover remains a minor feature. Small yellow fields are scattered mostly across the eastern and southeastern portions, with a few additional patches closer to the center. The county’s official description of the east as prairie is useful here because an open, relatively flat landscape should not automatically be interpreted as cropland. Most of the east is mapped as grass and shrub, not agriculture.
The north also deserves attention. El Paso County Parks maintains and plans open-space resources in and around Black Forest, and the map shows substantial forest patches in that part of the county. The two sources describe different things: the local planning material addresses parks and open space, while NLCD classifies surface cover. Forest pixels should not be treated as protected-land boundaries.
Development is the largest named category in the 1985–2025 change summary
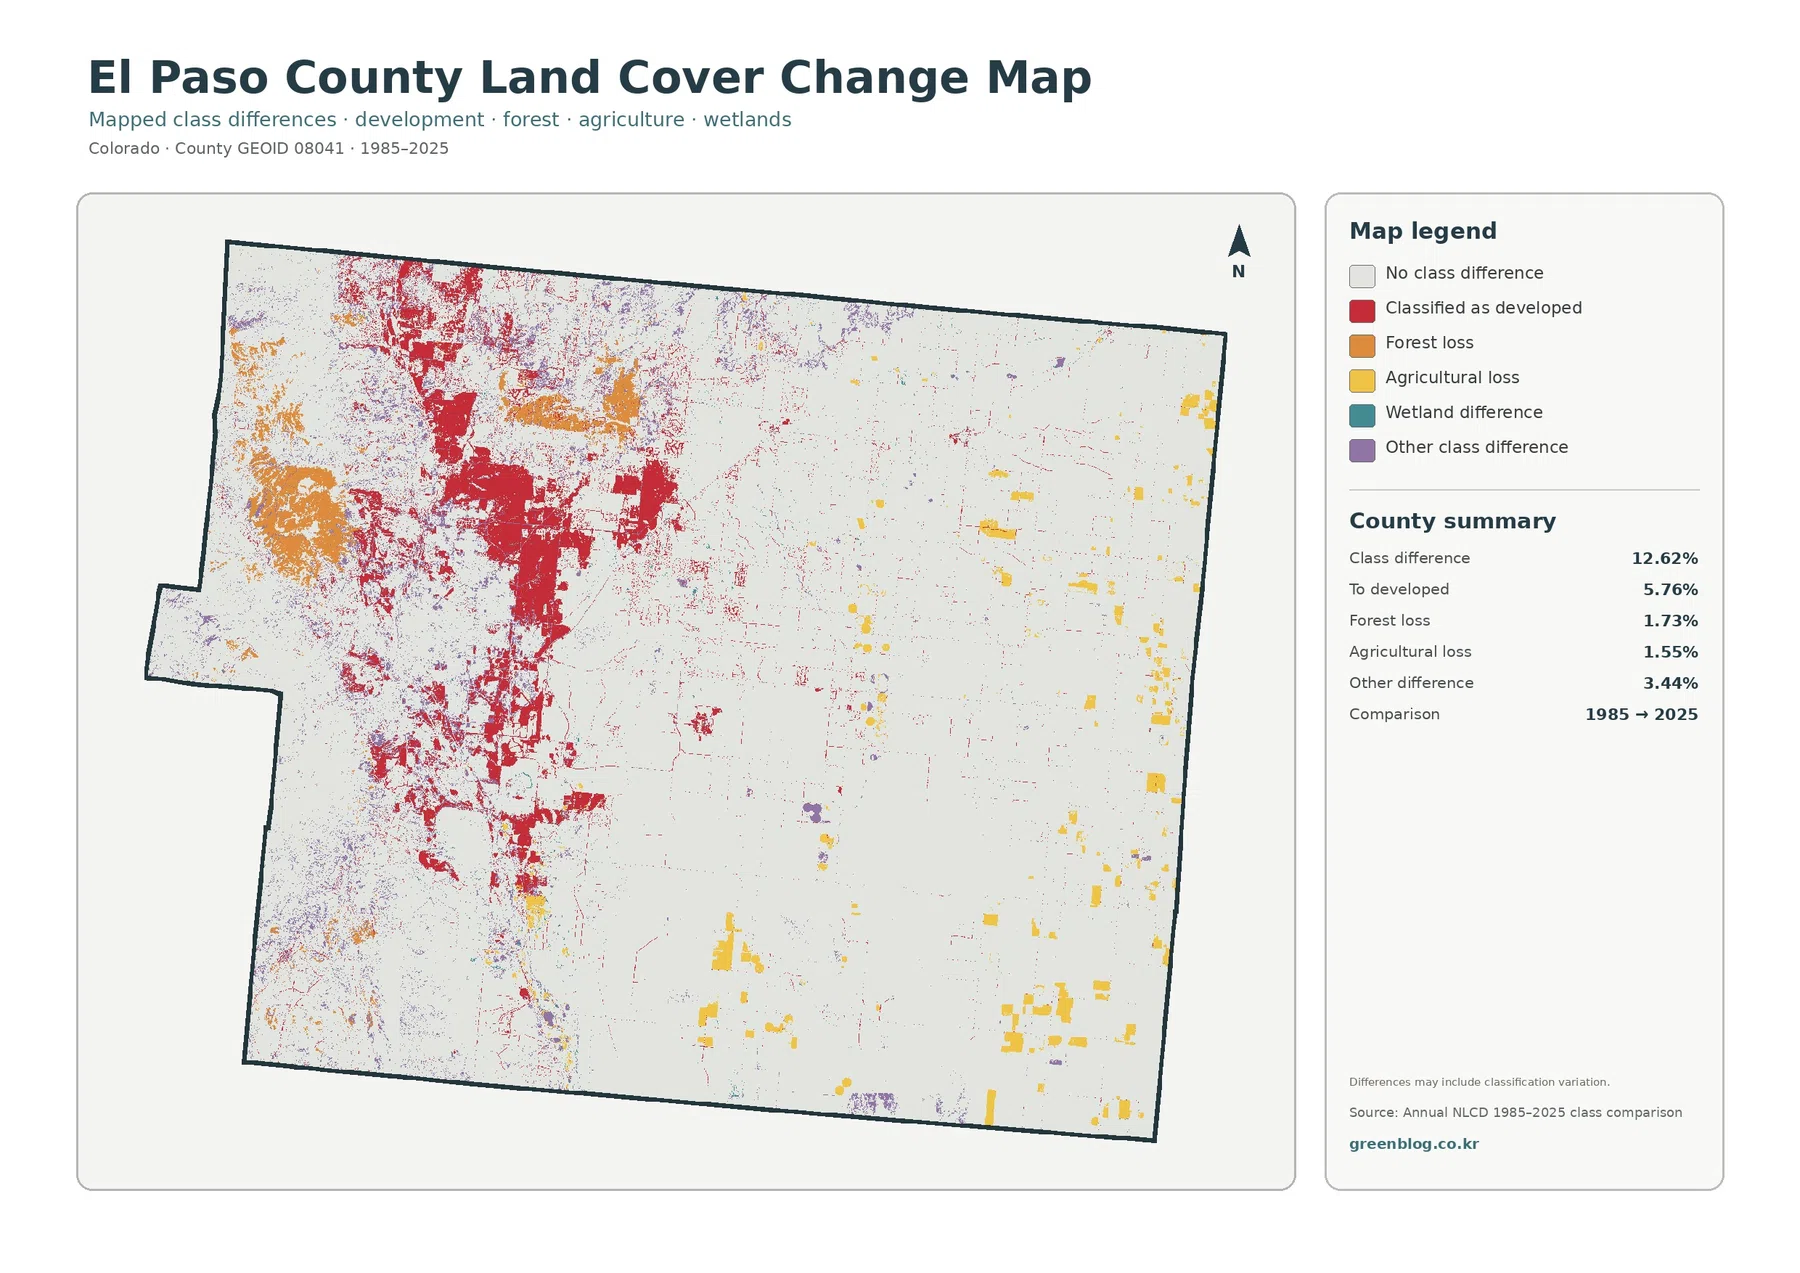
The map reports class differences across 12.62% of El Paso County between 1985 and 2025. Conversion to developed accounts for 5.76%, forest loss for 1.73%, agricultural loss for 1.55%, and other class difference for 3.44%. Most of the county remains in the no-class-difference background, but the named changes are concentrated enough to form clear regional patterns.
Red conversion-to-developed areas are strongest through the central-western county and around the northern side of the present urban concentration. Large blocks connect with narrower traces, creating a shape that resembles the location of current developed and impervious cover without being identical to either map. The change layer represents a two-date comparison, not the complete 2025 developed footprint.
Forest-loss pixels are more common toward the west and northwest, where current forest is also concentrated. Several orange patches sit away from the densest urban area. The 1.73% value does not identify why those cells changed class. Fire, vegetation disturbance, development, recovery stages, and classification differences would require additional sources to separate.
Agricultural-loss pixels form scattered yellow rectangles and patches across the eastern half and parts of the south. Their 1.55% change-category share is larger than the 0.39% current agricultural share, but those numbers are not directly subtractable. One is a current land-cover percentage and the other summarizes a specific type of class difference between two years.
Purple “other difference” pixels account for 3.44% and are scattered widely. The map notes that differences can include classification variation, so small isolated pixels should be handled cautiously. Broad, repeated patches are more useful for identifying areas that deserve further investigation with intermediate-year imagery or local records.
Three reference areas make the four maps easier to compare
The first reference area is the Colorado Springs–I-25 part of the county. The general map shows a broad developed surface, the impervious layer identifies the hardest-surfaced portions, and the change map highlights many cells classified as conversion to developed. Comparing those three views prevents a common mistake: assuming every developed pixel has high imperviousness or every current developed pixel changed after 1985.
The second reference area is the eastern prairie. Grassland dominates both the general and simplified maps, while imperviousness is usually low. Small agricultural fields and thin developed lines are easier to see after the viewer becomes familiar with the broad prairie background. On the change map, scattered agricultural-loss and development pixels add a time dimension without overturning the basic current grassland pattern.
The western mountain edge provides the third comparison. Forest becomes a major local cover and current imperviousness usually falls away outside developed places. The county’s official geography page notes the sharp elevation difference between the southern lowlands and Pikes Peak near the western boundary. The land-cover maps do not measure that elevation, but the forest concentration is consistent with the very different western landscape described by the county.
Black Forest and nearby northern forest patches form a useful secondary reference. They show that forest is not confined to the western boundary. County parks material documents open-space planning in Black Forest, while NLCD shows forest cover in the broader region. Looking at the two separately avoids confusing a vegetation class with a public park or conservation designation.
How 30-meter raster cells affect what the maps can tell you
Annual NLCD is raster data, meaning the landscape is divided into a grid of cells rather than mapped as surveyed parcels. The land-cover product uses 30-meter cells. A single cell can contain trees, grass, soil, pavement, buildings, or water, yet the land-cover layer assigns a representative class. The fractional impervious product handles hard surfaces differently by estimating their share within a cell.
This generalization matters most for narrow or small features. Water is only 0.12% of El Paso County, current agriculture is 0.39%, and cells with at least 50% imperviousness cover 3.00%. A small feature may become difficult to see when the map is reduced, while a thin road or stream can look more prominent after zooming. Use the summary numbers and locations together.
The change map adds another limitation. A different classification in 1985 and 2025 does not automatically reveal the physical cause of change. Real land-cover change can be present, but classification variation can contribute as well. The map is best used to locate areas worth checking rather than to make a final statement about what happened at a specific site.
Dates also define the scope of the article. The current land-cover and impervious maps represent 2025, and the change map compares 1985 with 2025. Construction, fire effects, vegetation recovery, or other changes after 2025 may not appear. Current site decisions should be checked against newer county, municipal, or field data.
Which map should you use for a particular question?
Start with the general land-cover map when the goal is a broad county overview. It puts the eastern grasslands, western forests, central-western development, scattered agriculture, wetlands, and water into one frame. It is also the most useful first image for readers who do not yet know El Paso County’s landscape.
The forest-and-farmland map is better when a lesson or presentation focuses on natural cover and agriculture. Fewer colors make the forest-versus-grass contrast easy to explain. The impervious map is the stronger choice for built surfaces because it shows intensity rather than only a developed category, which is especially helpful around the Colorado Springs area.
Use the change map when the question includes time. Pair it with the 2025 map so that “to developed” is not mistaken for all current development and “forest loss” is not mistaken for the current forest class. Side-by-side viewing makes the differences between present condition and two-date class change much clearer.
These maps can support environmental education, broad planning context, watershed or habitat discussions, classroom exercises, and presentation graphics. They are not zoning maps, cadastral surveys, wetland determinations, engineering plans, or property records. Parcel-level and legal questions require the appropriate official local source.
Download the four El Paso County JPG maps
The downloadable ZIP contains four original JPG files: the general land-cover map, forest-and-farmland map, impervious/developed-land map, and 1985–2025 land-cover change map. The WebP images in the article are optimized for quick viewing, while the ZIP provides the separate JPG versions for closer inspection and reuse.
Keep each map’s title, date, and legend with the image when using it elsewhere. The current developed share and fractional imperviousness measure different things, and the change categories describe differences between two years rather than current surface conditions alone. Clear labeling prevents those datasets from being mixed together.
The JPG set is useful for printing, classroom material, presentations, county-scale landscape comparison, and personal reference. For property boundaries, zoning, legal wetland limits, or infrastructure design, use the latest authoritative source from El Paso County, a municipality, or the responsible state or federal agency.
Frequently Asked Questions
What is the largest land-cover class in El Paso County?
Grassland is the largest 2025 class at 69.28%. It dominates the eastern prairie, while forest is much more concentrated in the mountainous west and in several northern areas. Developed cover is 12.82% but stands out because it is heavily concentrated in the central-western county.
Why are developed cover and impervious surface percentages different?
Developed cover is a categorical land-cover classification, while imperviousness estimates the fraction of a cell covered by hard surfaces such as pavement and rooftops. A developed area can still contain grass, soil, and other permeable surfaces, so the 12.82% developed share and 4.30% mean imperviousness do not need to match.
Does the 12.62% 1985–2025 class difference mean all of that land physically changed?
No. The percentage represents cells whose mapped classifications differ between the two years. Real land-cover change can contribute, but classification variation may also be present. A specific cause should be checked with additional imagery, local records, or other supporting data.
Map File Information
The download ZIP contains four original El Paso County land-cover JPG maps.
- Included Files: Use only the versions confirmed in the article and supplied images
- File Type: Use the confirmed download contents
- Intended Use: Printing, education, presentations, and map-based projects
Related Maps
- Adams County Colorado Land Cover Map
- Alamosa County Colorado Land Cover Map
- Arapahoe County Colorado Land Cover Map
Sources and References
- MRLC Annual NLCD Data – official access point for Annual NLCD products and data.
- USGS Annual NLCD Land Cover Classification – official documentation for interpreting Annual NLCD classes.
- El Paso County – About El Paso County – official county background on the mountainous west, eastern prairie, elevation range, and Colorado Springs.
- El Paso County Parks Master Plan – official county planning information for parks, trails, open space, and natural-resource context.
- U.S. Census Bureau TIGER/Line Shapefiles – official geographic boundary reference.
Green Map creates custom-edited map images using open geographic data sources such as geoBoundaries, Natural Earth, OpenStreetMap, and government open data.
These maps are edited visual materials, not raw data files, and are provided for education, documents, presentations, and graphic reference.