Douglas County has a strongly divided 2025 land-cover pattern rather than one countywide surface type. Grassland is the largest class at 32.39%, forest follows at 27.44%, shrubland accounts for 19.64%, and developed cover reaches 17.78%. The map places broad forest in the west and southwest, extensive open cover toward the east and southeast, and the heaviest development across the northern tier and parts of the center.
The four maps on this page separate those patterns into current land cover, forest and farmland, impervious surface, and mapped class differences between 1985 and 2025. They are designed to be compared at the same county outline, and the four original JPG files are available together in one ZIP in the download section.
Table of Contents
Development is concentrated in the north, not spread evenly across the county
Developed cover makes up 17.78% of Douglas County, but its placement matters more than the countywide percentage alone. Red areas form a broad belt along the north and northeast, continue through several large blocks in the north-central area, and reappear around the middle of the county. The southern half is much less red, so the map quickly separates the more heavily built portions of the county from its forested and open landscapes.
That geography is useful context for an area that includes multiple urban planning areas while also retaining large nonurban zones. Douglas County’s official 2040 Comprehensive Master Plan separately addresses areas associated with Castle Rock, Parker, Lone Tree, Larkspur, rural communities, and nonurban subareas. The land-cover map is not a zoning map, but it does provide a current surface picture that helps explain why the county cannot be described as either wholly suburban or wholly rural.
Development also becomes easier to understand when compared with the dominant natural classes. Grassland is 32.39%, forest 27.44%, and shrubland 19.64%. Those three categories together occupy most of the county, yet they are arranged differently: forest is strongest in the west, open grass and shrub cover is more extensive in the east and southeast, and development is concentrated toward the north and central corridor. The result is a pronounced internal contrast within one county boundary.
The 2025 map moves from western forest to eastern open cover
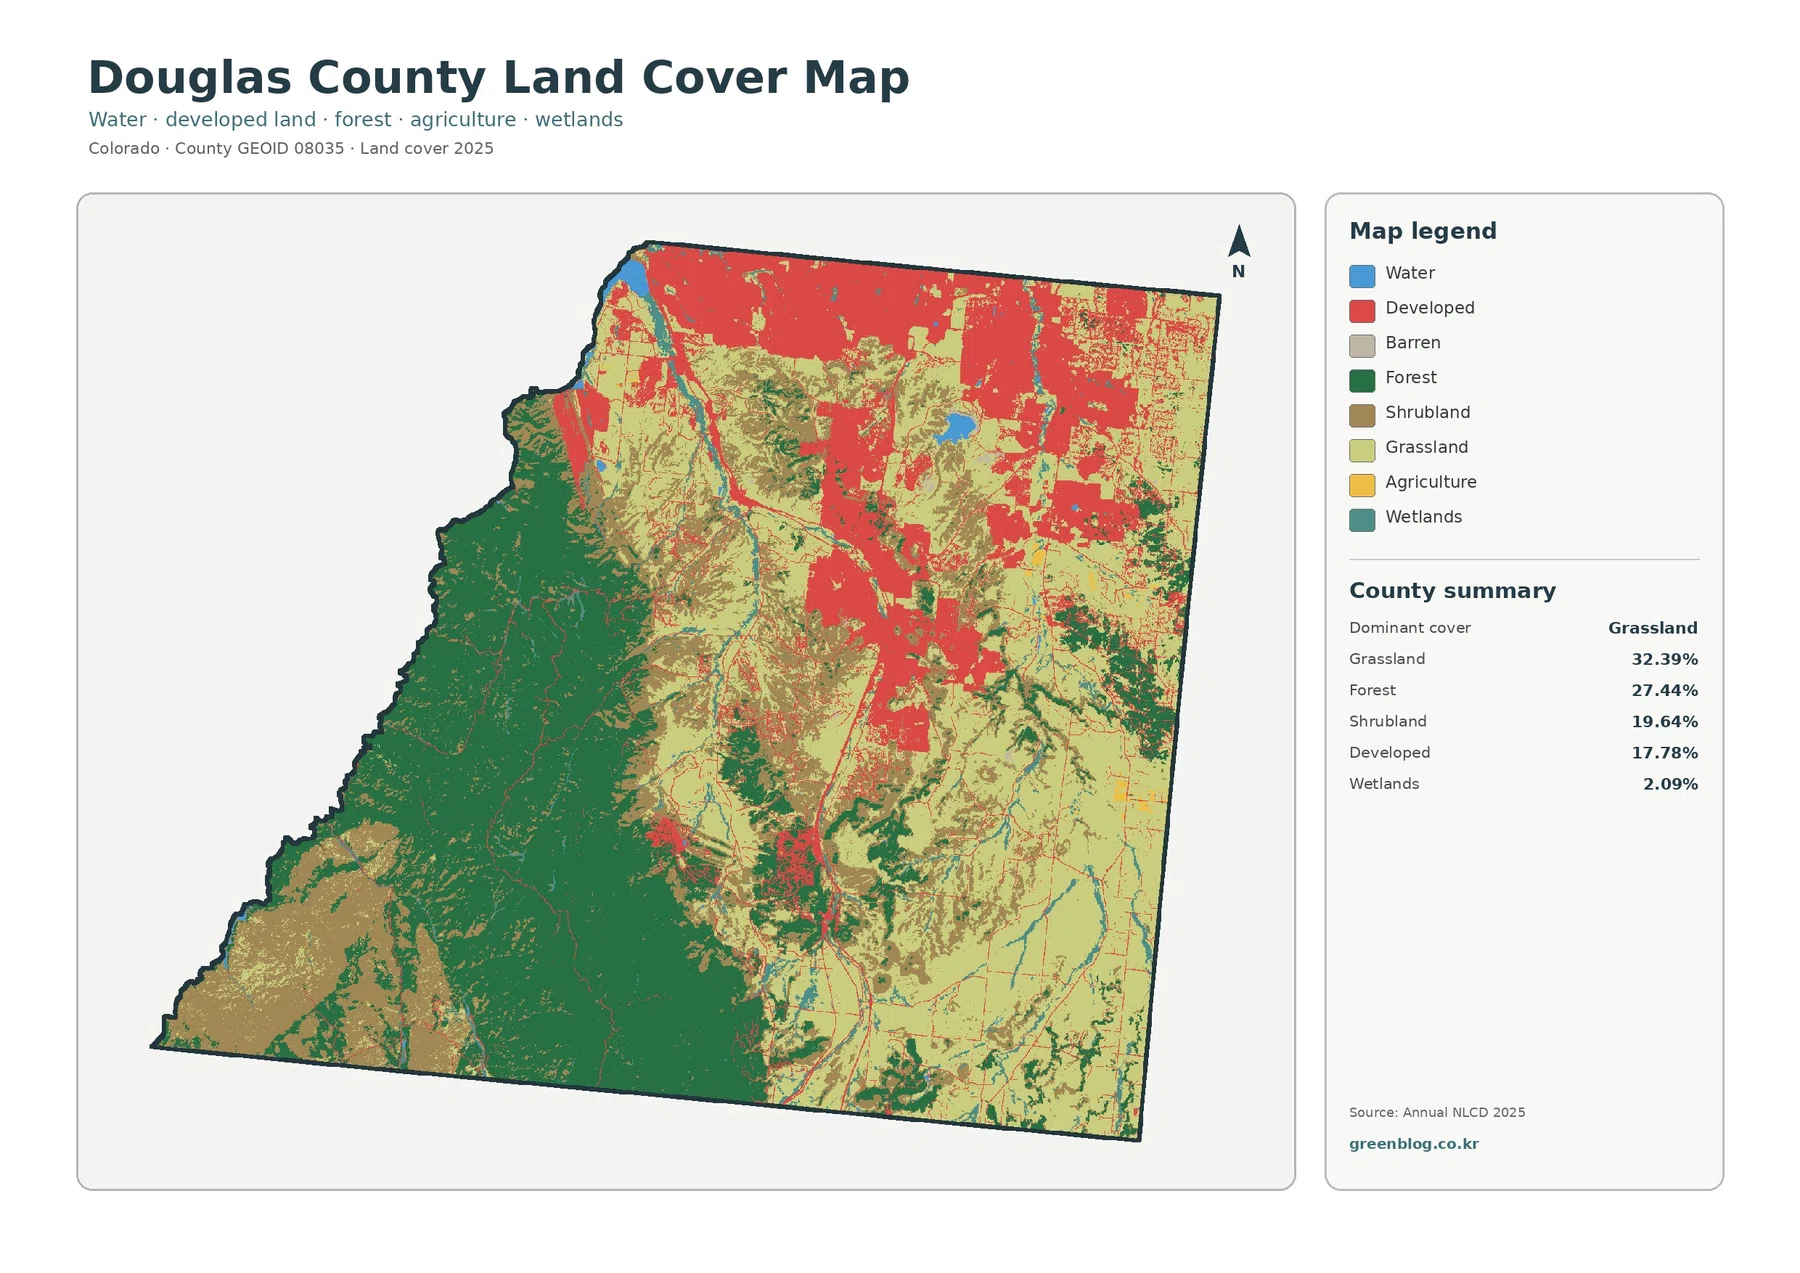
The general land-cover map is the most complete single view because all major classes remain visible. Dark green forest occupies a large connected area along the western side and expands through much of the southwest. Moving eastward, brown shrubland and light-green grassland become more common, while the northern part of the county changes again as red developed cover becomes a major component of the landscape.
The east and southeast are especially useful for understanding the 32.39% grassland total. Large light-green areas cover much of the background, interrupted by shrubland, thin drainage features, small forest patches, and scattered development. This is different from the western half, where forest is far more continuous. The county therefore has both a numerical grassland lead and a clear geographic division between forested and open areas.
Shrubland, at 19.64%, does not form one isolated zone. It appears repeatedly between forest and grassland and becomes prominent in the southwest and parts of the central and eastern county. That distribution makes shrubland an important transitional class. Looking only at the percentage would miss the way it is interwoven with both the forest-dominated west and the open eastern landscape.
Wetlands account for 2.09% of the county. Water is 0.40% in the forest-and-farmland summary, and several blue features provide useful location markers in the northern part of the map. These small classes are easy to lose at thumbnail size. They are best interpreted from the full image with the legend visible rather than by estimating area from a reduced preview.
Land cover should not be confused with legal land use. A developed classification does not establish zoning or building rights, and a grassland or forest classification says nothing about parcel ownership. The map describes the physical cover assigned to raster cells from mapped data. That distinction becomes particularly important when the same locations are viewed on the impervious-surface map.
A simplified forest-and-farmland view highlights the western natural block
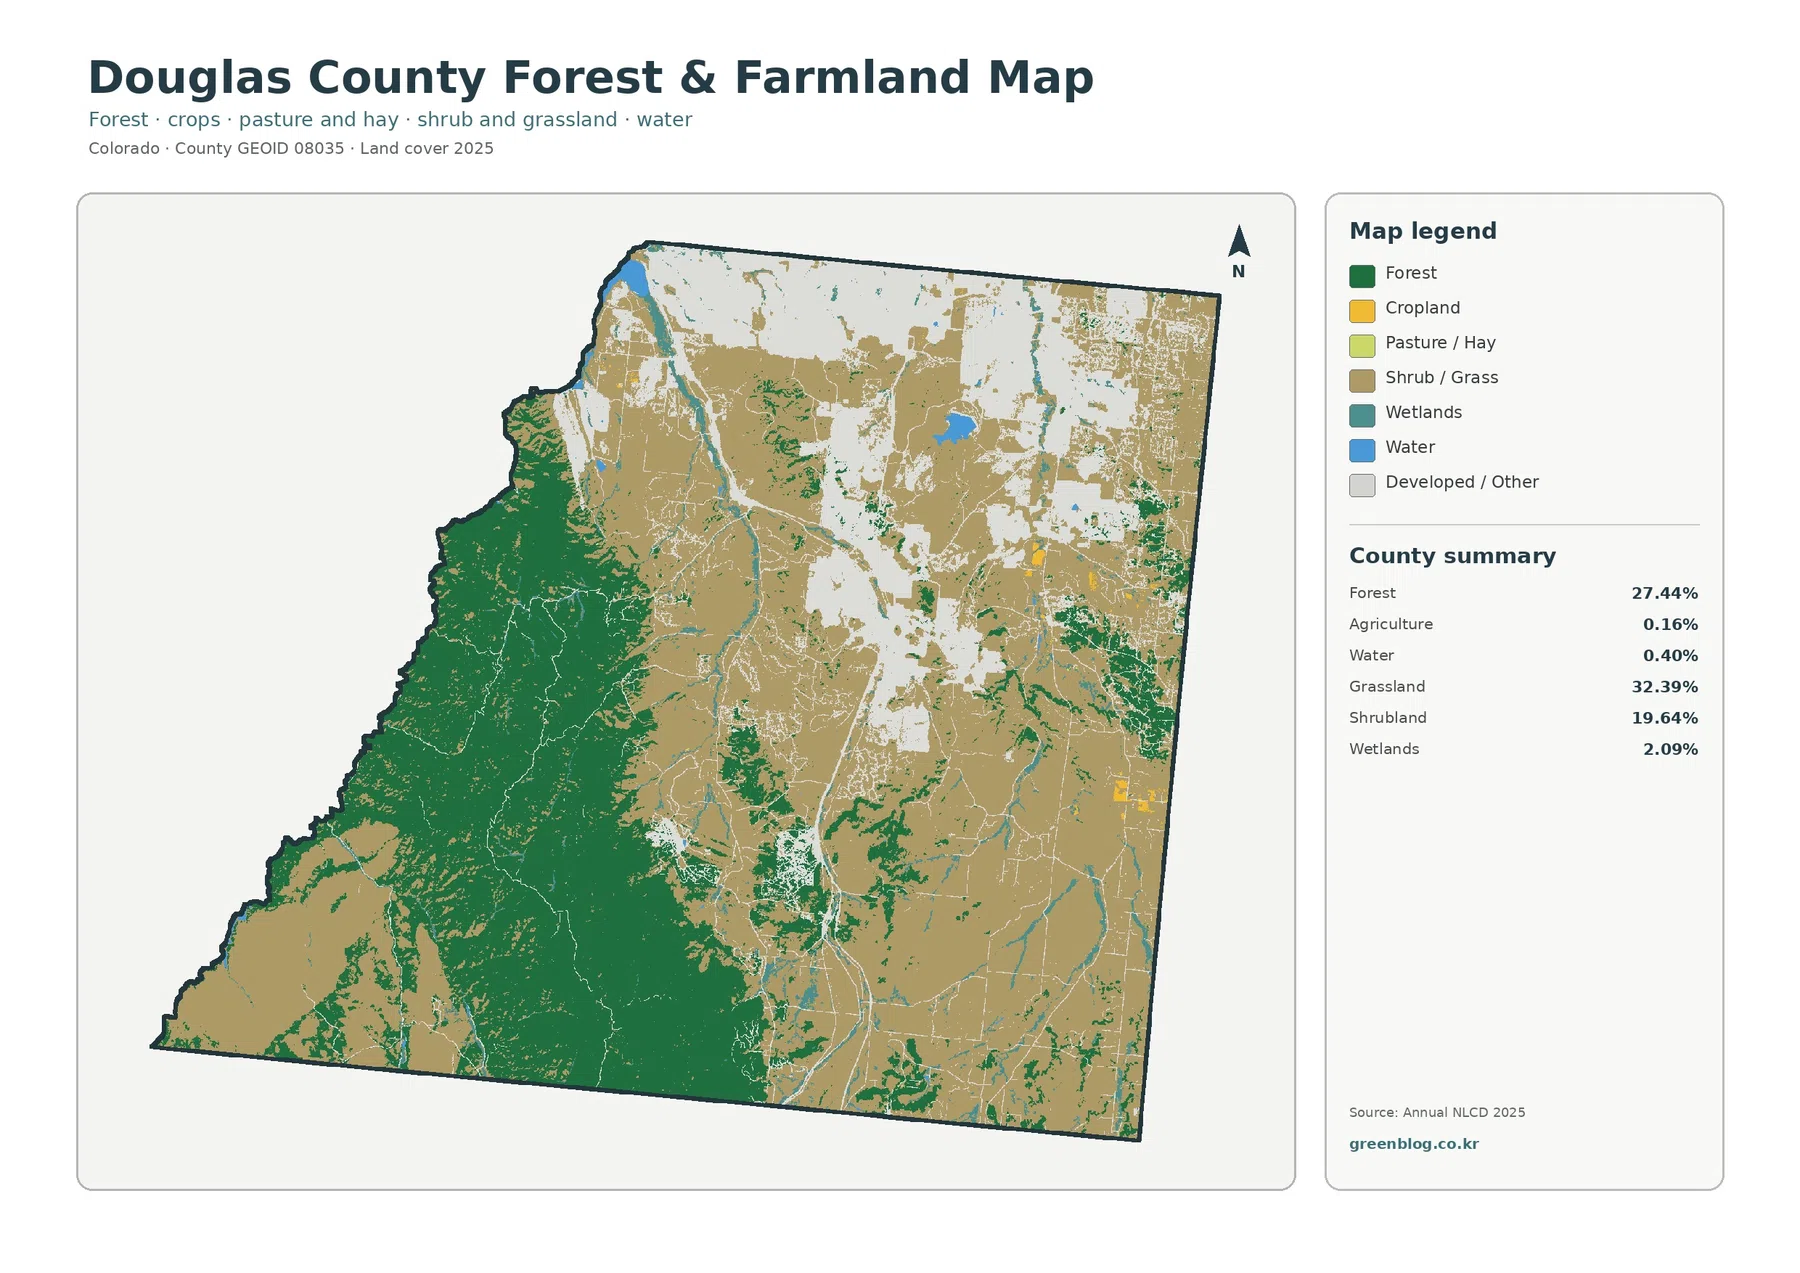
Removing some of the smaller land-cover distinctions makes the western side even easier to recognize. Forest, shown in dark green, dominates a broad block from the western boundary into the southwest and central-west. The county’s planning materials include a Pike National Forest subarea among their nonurban planning areas, while county open-space programs emphasize natural-resource protection across a much larger network of protected lands. Those planning categories are not the same as forest cover, but they provide useful local context for the large natural areas visible on the map.
Open shrub and grass cover becomes the main background through much of the center and east. In this simplified view, the complex patchwork of shrubland and grassland is easier to compare against forest because fewer colors compete for attention. The western edge remains green, the eastern half is largely tan, and developed or other surfaces occupy broad pale areas in the north and around central settlement patterns.
Agriculture is only 0.16% in the county summary, so it should not be treated as a major Douglas County land-cover story. Small cropland or pasture-and-hay patches appear in the map, but they occupy very little of the county compared with forest, grassland, shrubland, and development. This is an important example of why a forest-and-farmland map can still be useful even where farmland itself is limited: it simplifies the landscape enough to clarify the relationship between forest, open cover, and developed areas.
Water and wetlands remain visible as blue and blue-green features. Their small percentages do not make them unimportant as reference points, especially in the northern half where distinct water bodies stand out against developed and open land. The map does not define legal wetland boundaries or water rights. It is a county-scale cover classification, so site-level questions require separate authoritative data.
Impervious surface reveals where the built footprint is actually hardest
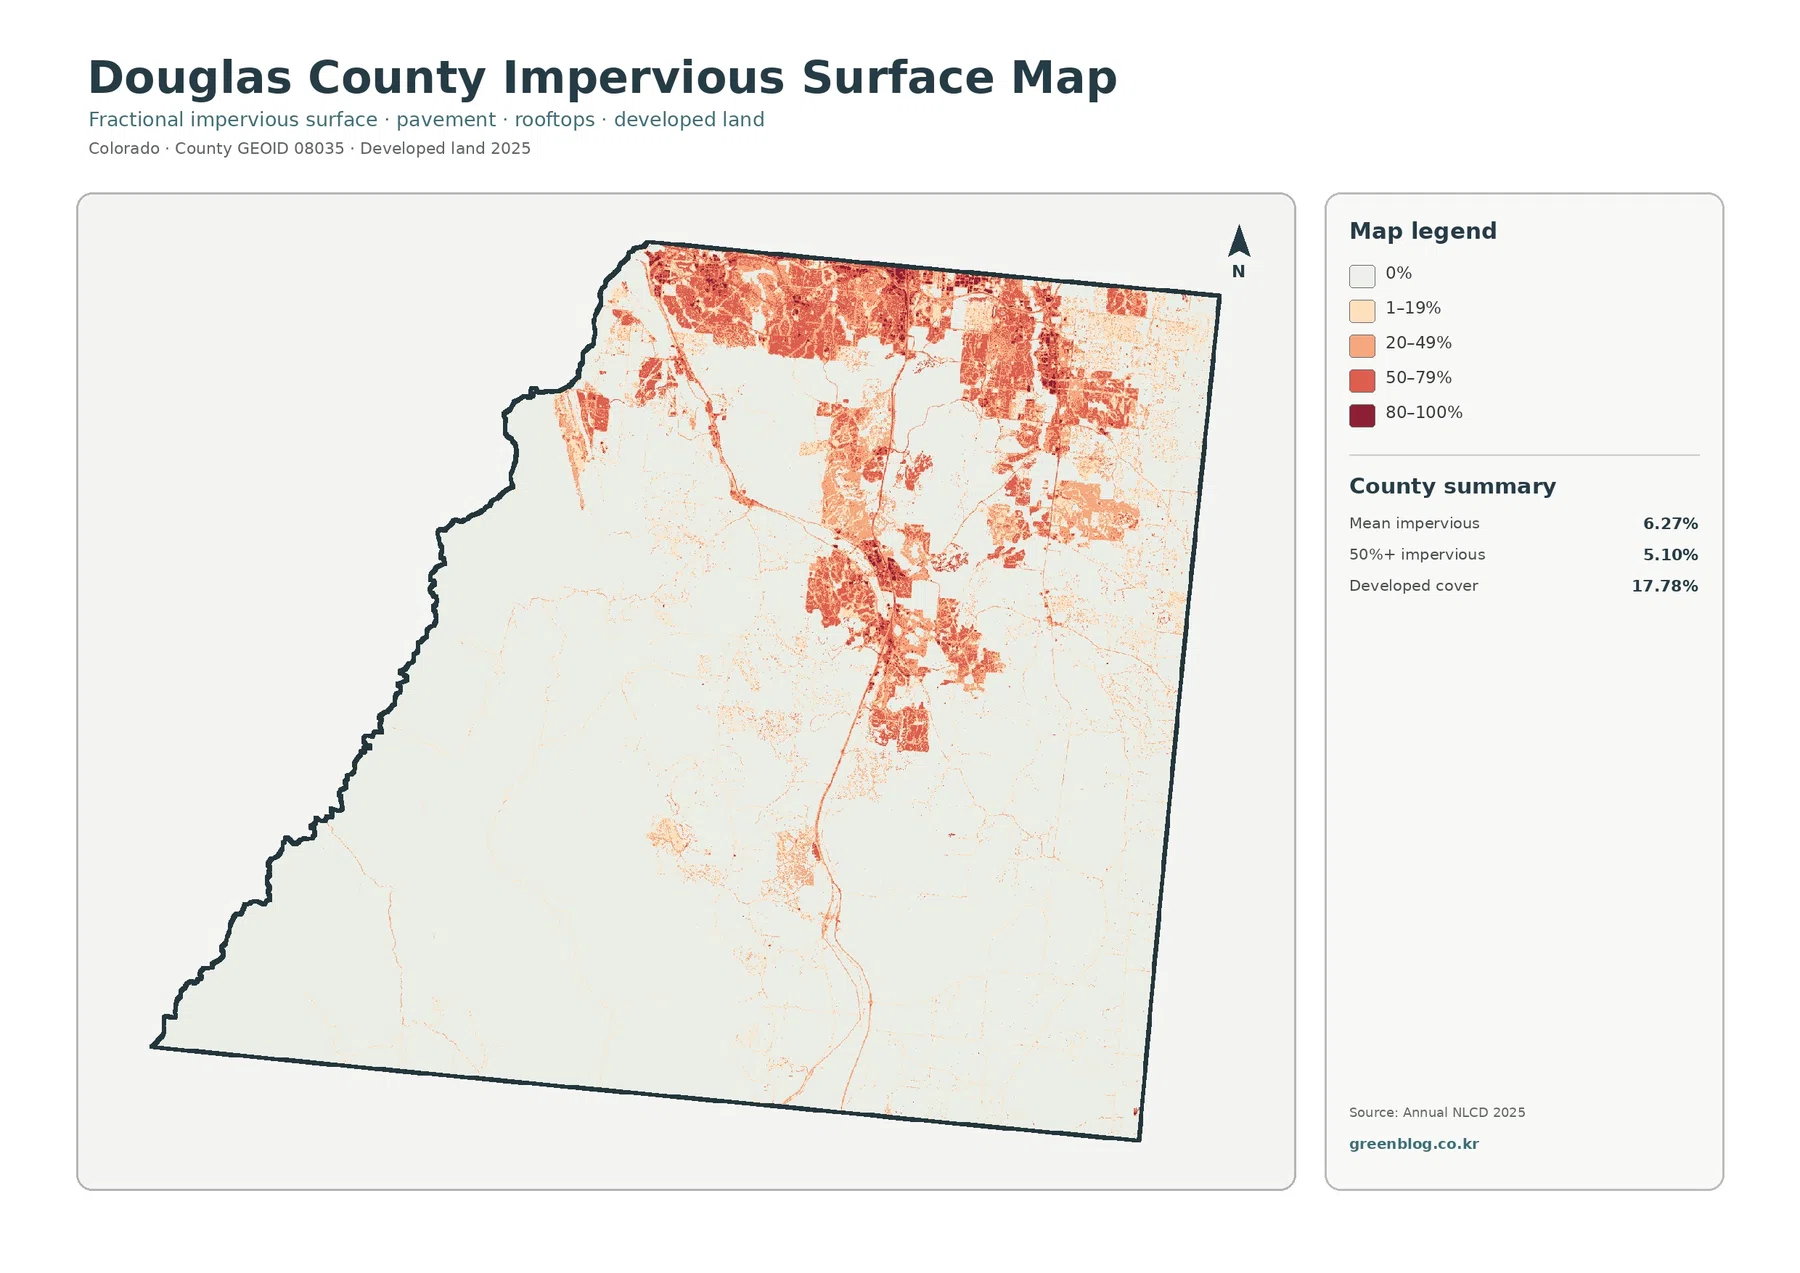
Impervious surface means hard cover such as pavement and rooftops that does not readily absorb water. Douglas County has a mean impervious value of 6.27%, while 5.10% of the county falls in cells that are at least 50% impervious. Those numbers are lower than the 17.78% developed-cover share because the two maps measure different things. Developed land is a cover class; imperviousness describes how much of each cell is occupied by hard surface.
The strongest impervious colors occur across the northern tier and in several central clusters. Orange and red cells form large connected patches in those areas, and thinner lines extend away from them along transportation corridors and smaller settled areas. The western forest block, by contrast, is almost entirely pale, while much of the southeast also remains in the lowest impervious categories.
This map helps prevent an easy misreading of the general land-cover layer. A place classified as developed does not have to be mostly pavement or rooftop. Residential areas can contain yards, trees, open lots, and other permeable surfaces, so developed cells may appear in the 1–19% or 20–49% impervious ranges rather than the darkest categories. The two maps should be compared, not substituted for one another.
Small linear features also deserve caution. At county scale, a thin impervious line can help trace a built corridor, but it is not a surveyed road map and should not be used to identify a precise lane, parcel entrance, or drainage condition. The strongest use of this layer is to compare broad concentrations of hard surface across the county, especially the contrast between the developed north and the much lighter west and south.
Mapped change since 1985 is dominated by conversion to developed cover
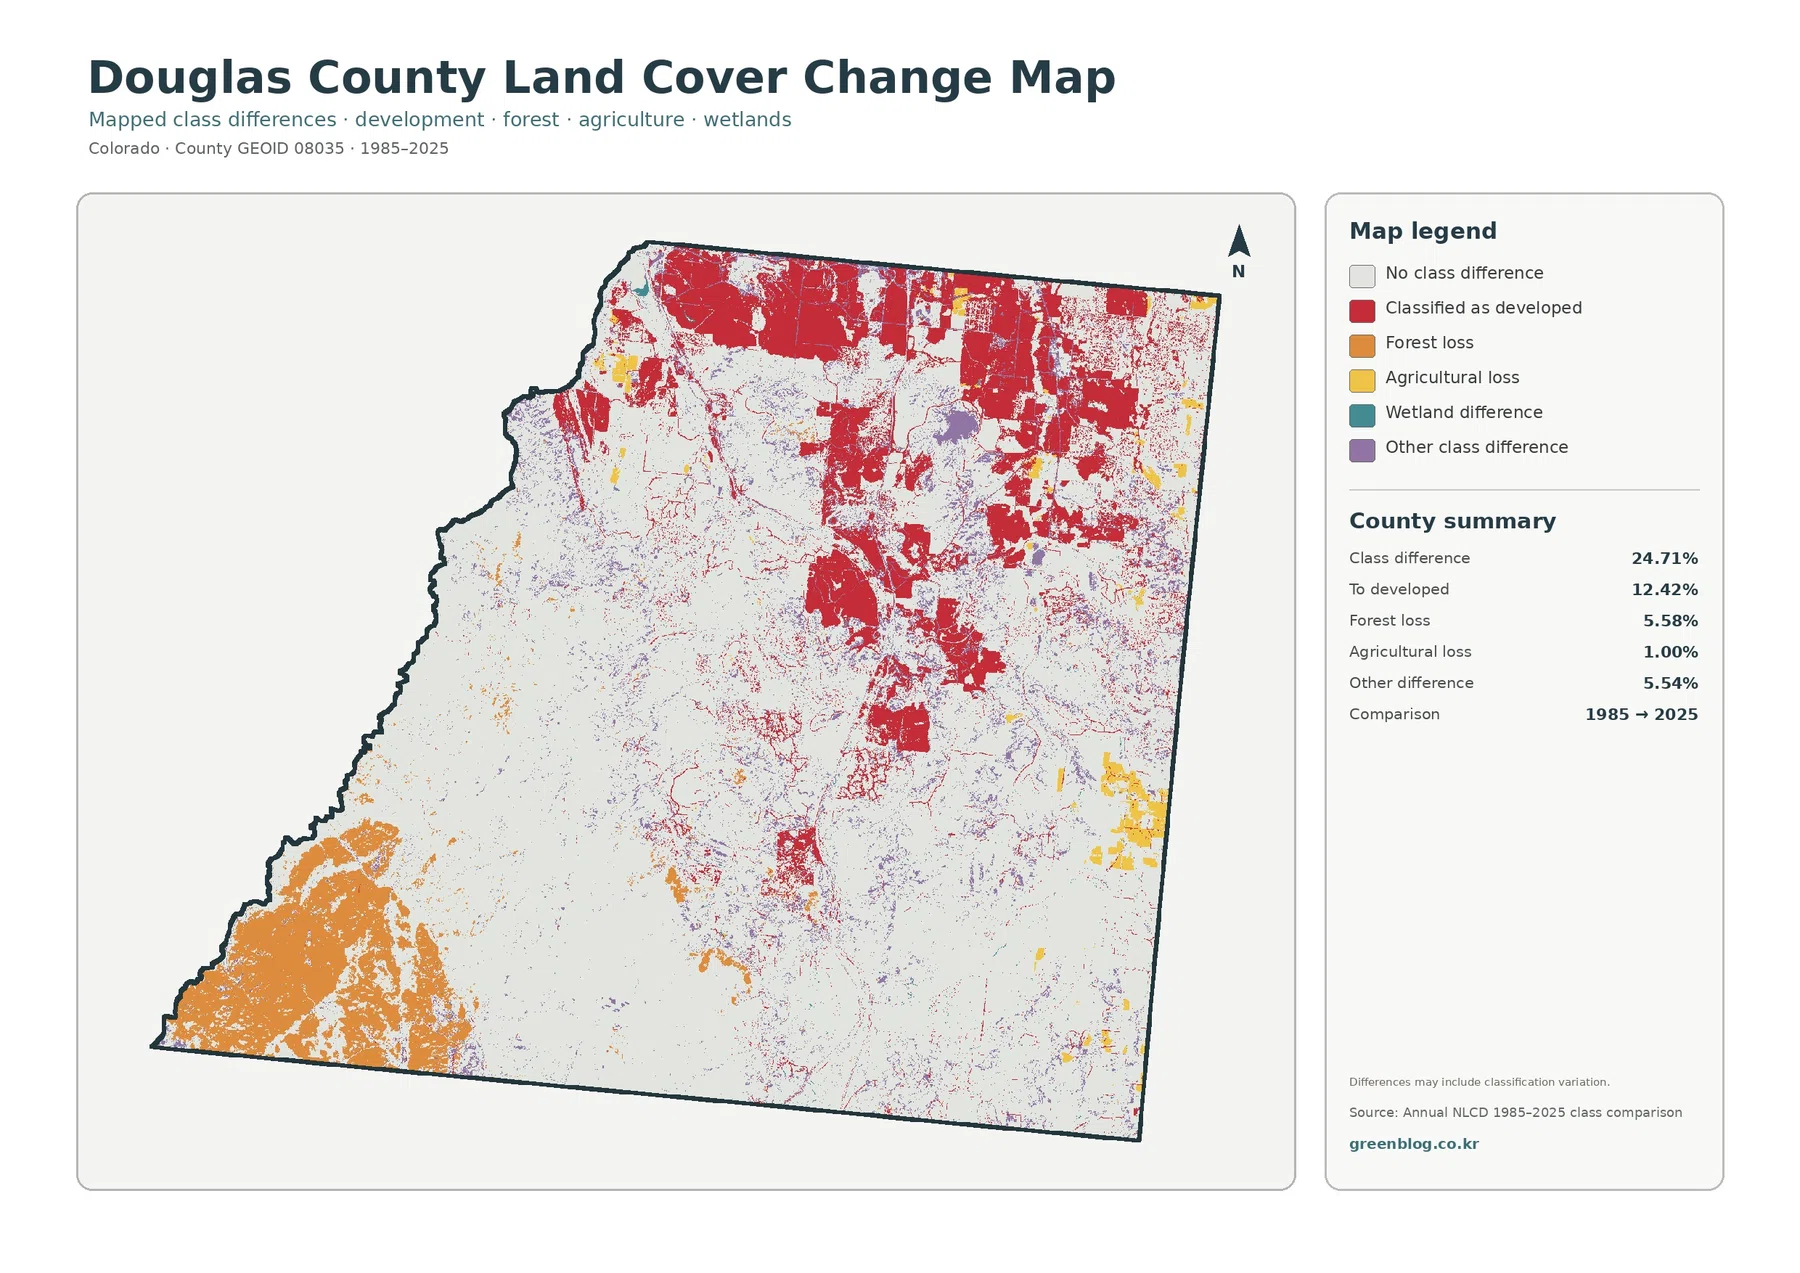
The change layer reports where the 1985 and 2025 classifications differ. Its county summary shows a class difference across 24.71% of the area. The largest named component is “to developed” at 12.42%, followed by forest loss at 5.58%, other differences at 5.54%, and agricultural loss at 1.00%. These values describe mapped class differences, not a complete explanation of why each location changed.
Red conversion-to-developed areas are concentrated across the north and continue through sizable central patches. That geography resembles the current concentration of developed cover, which makes the two maps convenient to align. Their meanings remain different, however. The current map answers what was classified as developed in 2025, while the change map identifies cells that differ between 1985 and 2025 and fall into the developed-change category.
One of the most visually striking areas is the southwest, where a large orange forest-loss region appears on the change map. The current map still shows substantial forest and shrub cover in that part of the county. This is a useful reminder that a forest-loss color does not mean the whole area is treeless today. It marks a classification difference over the comparison period and should be interpreted with the current cover map beside it.
Smaller purple, yellow, and red differences are scattered through the central and eastern county. Fine speckling and narrow edge changes are harder to interpret than large, repeated clusters because classification methods and mixed pixels can influence small features. If the reason for a particular change matters, the map should be treated as a starting point for locating the area rather than as proof of a specific land-management or development event.
Three comparison zones make the four-map set easier to read
The northern tier is the clearest place to begin. It is heavily developed in the current map, strongly colored on the impervious layer, and contains broad red conversion-to-developed areas on the change map. In the forest-and-farmland view, much of that same region falls into developed or other cover. Matching these locations demonstrates how a single landscape can be described with four different variables without the maps becoming redundant.
The west and southwest form a second useful reference area. Current cover is dominated by forest, the simplified map makes that green block even more obvious, and the impervious layer is mostly near zero. The change layer then adds a different time dimension through its large forest-loss area in the southwest. Using all four views keeps “forest now,” “hard surface now,” and “class difference since 1985” separate.
The southeast provides a third contrast. Grass and shrub cover dominate much of the present-day map, hard surfaces are sparse, and the change layer contains more no-difference background with scattered small changes. It is neither as forested as the west nor as developed as the north. That makes it a useful example of the open nonurban surface that accounts for a large share of Douglas County.
Once those three zones are familiar, smaller features become easier to place. Water bodies, wetland strips, isolated developed patches, and minor class changes can be located relative to a known part of the county. This is more reliable than trying to interpret every small color immediately, especially when the map is being viewed on a screen rather than at full image size.
Why official county planning and open-space sources add context
Douglas County’s 2040 Comprehensive Master Plan is designed to address both urban and nonurban land use, along with open space, natural resources, transportation, water, and wildlife. That planning context is useful because the land-cover maps show the same county containing strong urban development and extensive natural or open cover. The two sources should not be merged into one dataset: the plan describes policy and planning areas, while NLCD describes mapped surface cover.
The county’s Open Space and Natural Resources program reports more than 65,000 acres of protected open-space land. That figure is not equivalent to the 27.44% forest share, the 32.39% grassland share, or any other NLCD percentage. Protected open space can contain several types of physical cover, and land-cover classes can occur both inside and outside protected properties. The value of the local source is to explain why natural lands remain an important county topic, not to provide a substitute land-cover percentage.
For readers comparing growth and conservation, the maps offer a practical visual overview. The north and central county contain major developed and impervious clusters, while the west retains a broad forested block and the southeast remains much more open. The official planning sources then provide the policy framework for urban, rural, and natural-resource questions. Parcel zoning, development approvals, and ownership still require the specific county records created for those purposes.
Scale and classification limits matter most for small features and change colors
Annual NLCD is raster data, so the landscape is represented as a grid of cells. A real-world cell may contain several surfaces at once, especially beside roads, neighborhoods, shorelines, and vegetation edges. The final class simplifies that mixed ground into a mapped value. For that reason, a color boundary should not be treated as a surveyed parcel line, exact property edge, or legal wetland boundary.
Small classes are particularly sensitive to map scale. Agriculture is only 0.16%, and water is 0.40%. A small blue or yellow feature may be clear in the full JPG but nearly disappear in a browser thumbnail. The reverse can also happen: a few enlarged cells can look more important than their countywide percentage. The summary numbers and map location should always be read together.
The 24.71% class-difference figure also deserves careful wording. It does not say that exactly 24.71% of Douglas County physically changed for one reason. It summarizes cells classified differently in the 1985 and 2025 comparison, and the map notes that classification variation can be part of those differences. Broad clusters are useful for identifying areas of interest, but explaining causes requires additional evidence.
The date range sets another boundary on interpretation. Current land-cover and impervious maps are labeled 2025, while the change map compares 1985 with 2025. Construction, vegetation change, wildfire effects, restoration, or other conditions after 2025 are outside this set. For current site decisions, pair the maps with newer official information at the appropriate local scale.
Choosing the right Douglas County map for a specific question
Start with the general land-cover map if the goal is to summarize Douglas County in one image. It puts the four largest classes—grassland, forest, shrubland, and development—into the same legend and makes the north-west-east contrast immediately visible. It is the most useful introduction before moving to a specialized layer.
Use the forest-and-farmland map when the main question is the balance between forested and open land. The simplified palette makes the western forest block and eastern shrub-and-grass cover easier to compare. If the focus is urban surface intensity, the impervious map is more informative because it distinguishes lightly developed cells from the harder surfaces concentrated in the north and center.
Choose the change map when the task specifically involves the 1985–2025 comparison. It works best beside the 2025 current-cover map because similar colors can mean different things. Red in the current map is developed cover; red in the change map indicates conversion to developed classification. Keeping both legends and years visible prevents a time-change category from being mistaken for present-day cover.
For classroom use, printing, or presentations, two larger maps are often easier to understand than four very small panels. A current-versus-change pair works well for time comparison, while a forest/open-cover versus impervious pair separates natural cover from hard-surface intensity. Because the county outline is consistent across the set, readers can align the northern tier, western forest, and southeastern grassland without needing additional geographic layers.
Download the four Douglas County JPG land-cover maps
The download ZIP contains four separate JPG maps for Douglas County: general land cover, forest and farmland, impervious/developed land, and land-cover change from 1985 to 2025. The WebP images in the article are optimized for page viewing, while the downloadable JPG files preserve each map as an individual image with its title, legend, and county summary.
Keep the map title, year, and legend with the image when reusing it. The current land-cover layer, impervious surface layer, and historical change layer all use warm colors around development, but they measure different variables. A clear caption is enough to prevent most confusion when the files are inserted into a report, presentation, lesson, or personal reference collection.
These maps are suitable for county-scale reference and comparison. They are not parcel surveys, zoning determinations, ownership records, legal wetland delineations, or engineering maps. If a decision depends on those details, use the map set for broad context and consult the corresponding Douglas County or other official source for the site-specific information.
Frequently Asked Questions
What is the largest land-cover class in Douglas County in 2025?
Grassland is the largest class at 32.39%, followed by forest at 27.44%, shrubland at 19.64%, and developed cover at 17.78%. The map places much of the grassland in the east and southeast, the broadest forest in the west and southwest, and the strongest developed areas in the northern and central county.
Why is developed cover 17.78% while mean impervious surface is only 6.27%?
Developed cover and impervious surface measure different things. Developed cover is a land-cover class, while impervious surface is the share of each mapped cell covered by pavement, rooftops, and other hard surfaces. The two percentages therefore do not need to match.
What does the large red area in northern Douglas County mean on the 1985–2025 change map?
Red on the change map indicates cells classified as changing to developed cover in the comparison, and the county summary gives that category as 12.42%. It is not simply a second version of the 2025 developed-land layer. The two maps should be viewed together so present-day development is kept separate from the historical classification difference.
Map File Information
The ZIP includes four original JPG land-cover maps for Douglas County.
- Included Files: Use only the versions confirmed in the article and supplied images
- File Type: Use the confirmed download contents
- Intended Use: Printing, education, presentations, and map-based projects
Related Maps
- Adams County Colorado Land Cover Map
- Alamosa County Colorado Land Cover Map
- Arapahoe County Colorado Land Cover Map
Sources and References
- MRLC Annual NLCD Data – official access point for Annual NLCD data used for current and historical land-cover comparison.
- USGS Annual NLCD Land Cover Classification – definitions and interpretation guidance for grassland, forest, shrubland, developed land, and other classes.
- U.S. Census Bureau TIGER/Line Shapefiles – official geographic boundary source used for county-level mapping.
- Douglas County 2040 Comprehensive Master Plan – official local context for urban, nonurban, open-space, natural-resource, and long-range planning areas.
- Douglas County Open Space & Natural Resources – official information about protected open space and natural-resource programs in the county.
Green Map creates custom-edited map images using open geographic data sources such as geoBoundaries, Natural Earth, OpenStreetMap, and government open data.
These maps are edited visual materials, not raw data files, and are provided for education, documents, presentations, and graphic reference.