Crowley County’s 2025 land-cover picture is unusually simple at the county scale: grassland covers 91.75% of the mapped area. Most of the north and center appears as one broad grassland field, while farming, water, wetlands, and developed surfaces are much more noticeable in the southern part of the county. This page uses four separate views to explain that contrast and provides the original JPG map files in a single ZIP download.
Land cover describes what is physically covering the ground, such as grass, crops, water, wetlands, or developed surfaces. It is not a zoning map, parcel map, ownership map, or statement about where development is legally allowed. The maps are useful for county-scale comparison and for seeing where major cover classes cluster, but they should not be used to make parcel-level legal or engineering decisions.
Table of Contents
What stands out in the 2025 land-cover summary
The county summary identifies grassland as the dominant class at 91.75%. Shrubland accounts for 2.54%, agriculture 1.77%, developed land 1.63%, and water 1.21%. The forest-and-farmland view also reports wetlands at 1.08% and forest at 0.00%. Those smaller percentages matter because they are not spread evenly across the county. Several of them are concentrated in the south, where the map becomes much more varied than the broad grassland areas farther north.
A viewer who looked only at the percentages might expect an almost uniform map. The spatial pattern is more interesting. Grassland is indeed continuous across most of Crowley County, but rectangular agricultural patches appear in the southwest and south-central area, blue water bodies stand out nearby, and narrow wetland colors follow portions of the same southern zone. Developed cover is limited in area yet visible as thin lines and compact clusters. The result is a county with a very strong overall grassland identity and a much more complex southern belt.
A grassland-dominated map with a more varied southern edge
The general land-cover map makes the 91.75% grassland share immediately visible. Pale grassland color fills nearly the entire northern half and most of the center. Shrubland appears in scattered patches, especially toward the west and southwest. Agriculture is easier to recognize because its yellow blocks have more regular shapes and are concentrated primarily in the southern part of the county rather than distributed evenly from edge to edge.
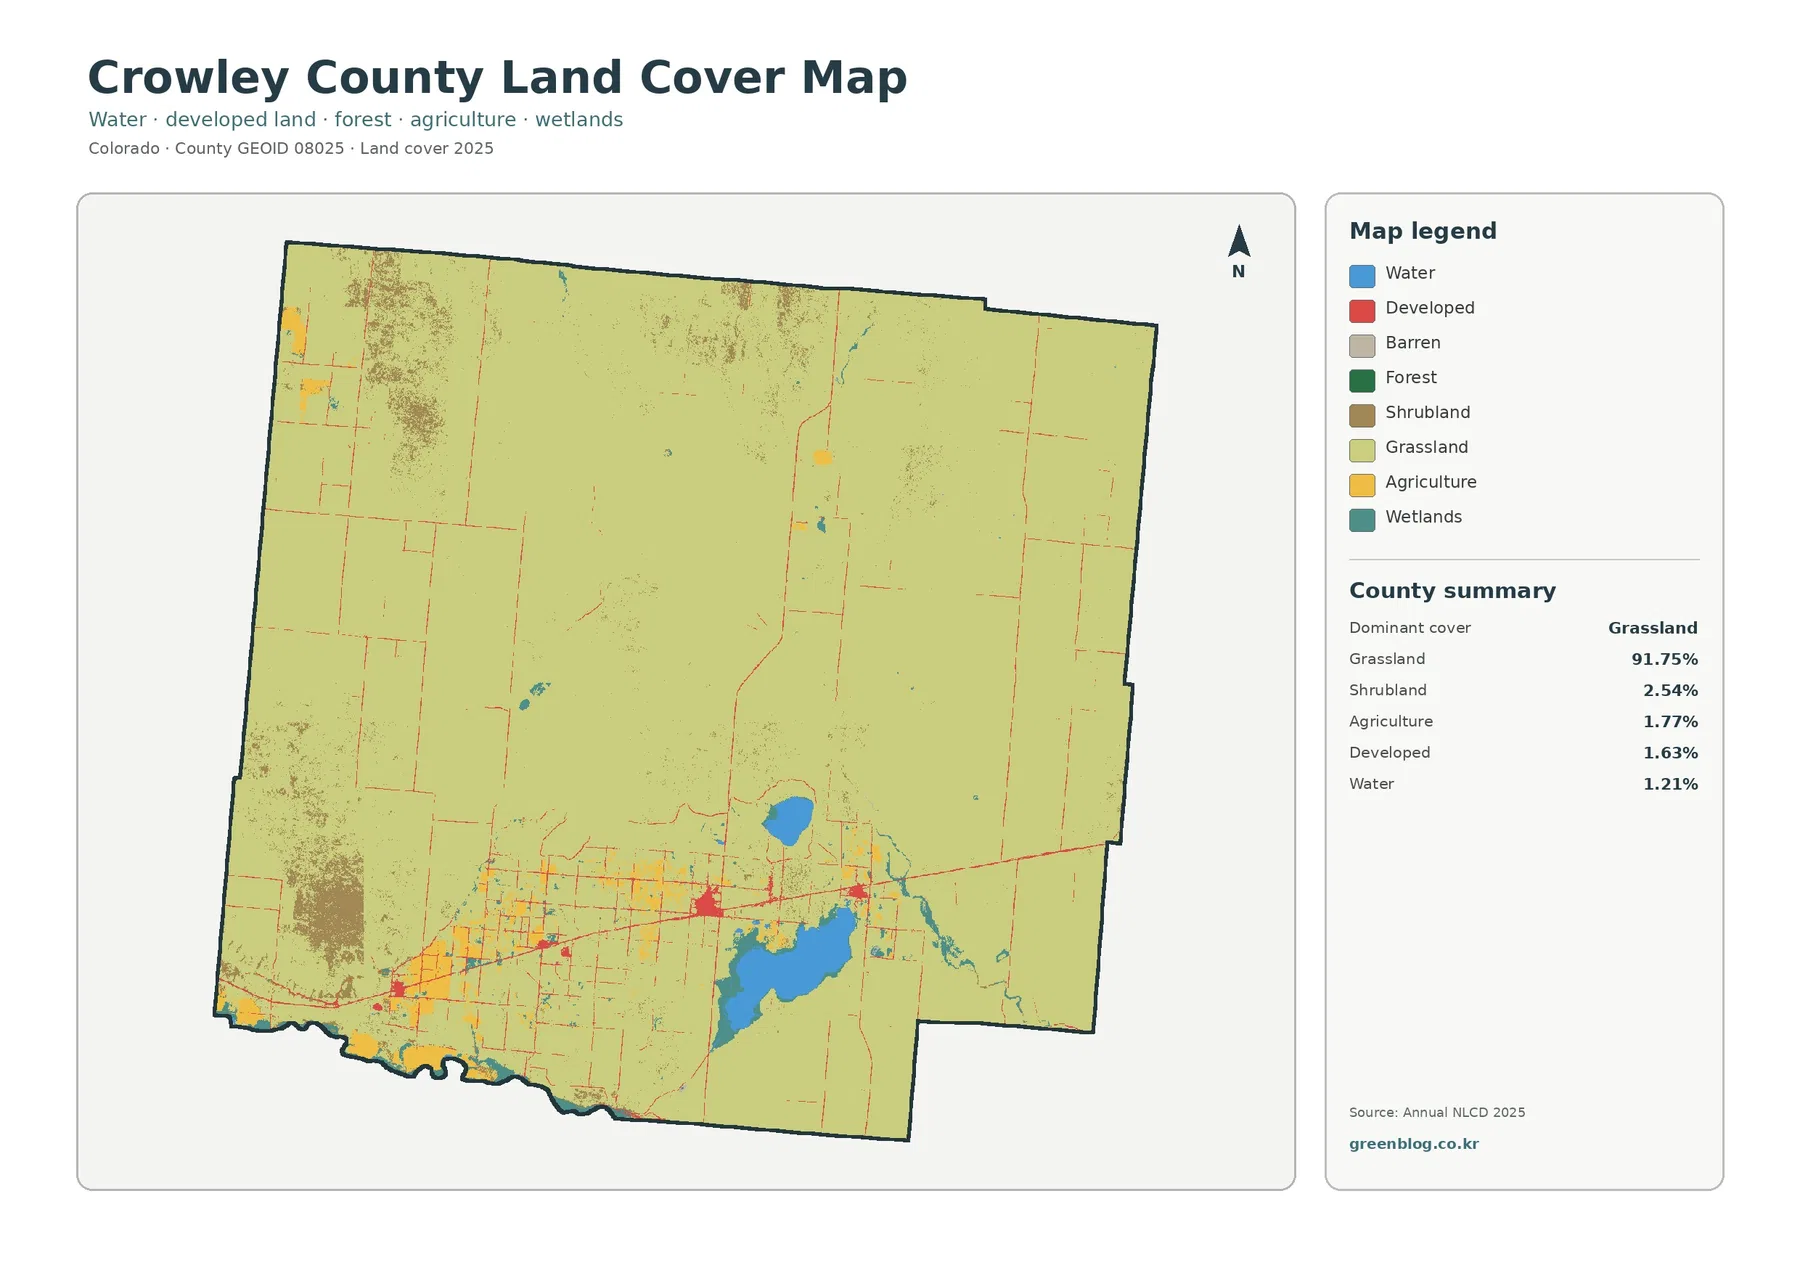
Water represents only 1.21% of the county summary, yet several blue areas are visually prominent because they form compact shapes instead of being scattered cell by cell. The largest mapped water features lie in the southern portion of the county, with wetland colors appearing around or near some of those areas. The package does not label the individual water bodies, so this article does not assign names to them. That distinction keeps the description tied to what the supplied map actually shows.
Developed land, at 1.63%, appears mostly as narrow lines and small clusters across the southern part of the map. Crowley County’s official and federal community pages identify Ordway as the county seat and also discuss Crowley, Olney Springs, and Sugar City as local communities. Because the land-cover image itself does not label those places, it is better to describe the visible red areas as a southern settlement and transportation pattern rather than claim that each individual red patch belongs to a specific town or road.
Forest is absent from the county summary, so grass and farms become the main comparison
The forest-and-farmland map changes the emphasis by grouping the landscape into a simpler set of classes. Forest is reported at 0.00%, so there is no broad green forest zone competing with the other categories. Instead, the map is overwhelmingly covered by shrub-and-grass color, with cropland, water, wetlands, and developed or other surfaces forming smaller patches. For Crowley County, this view is more useful for comparing open rangeland-like cover with agricultural blocks than for studying forest distribution.
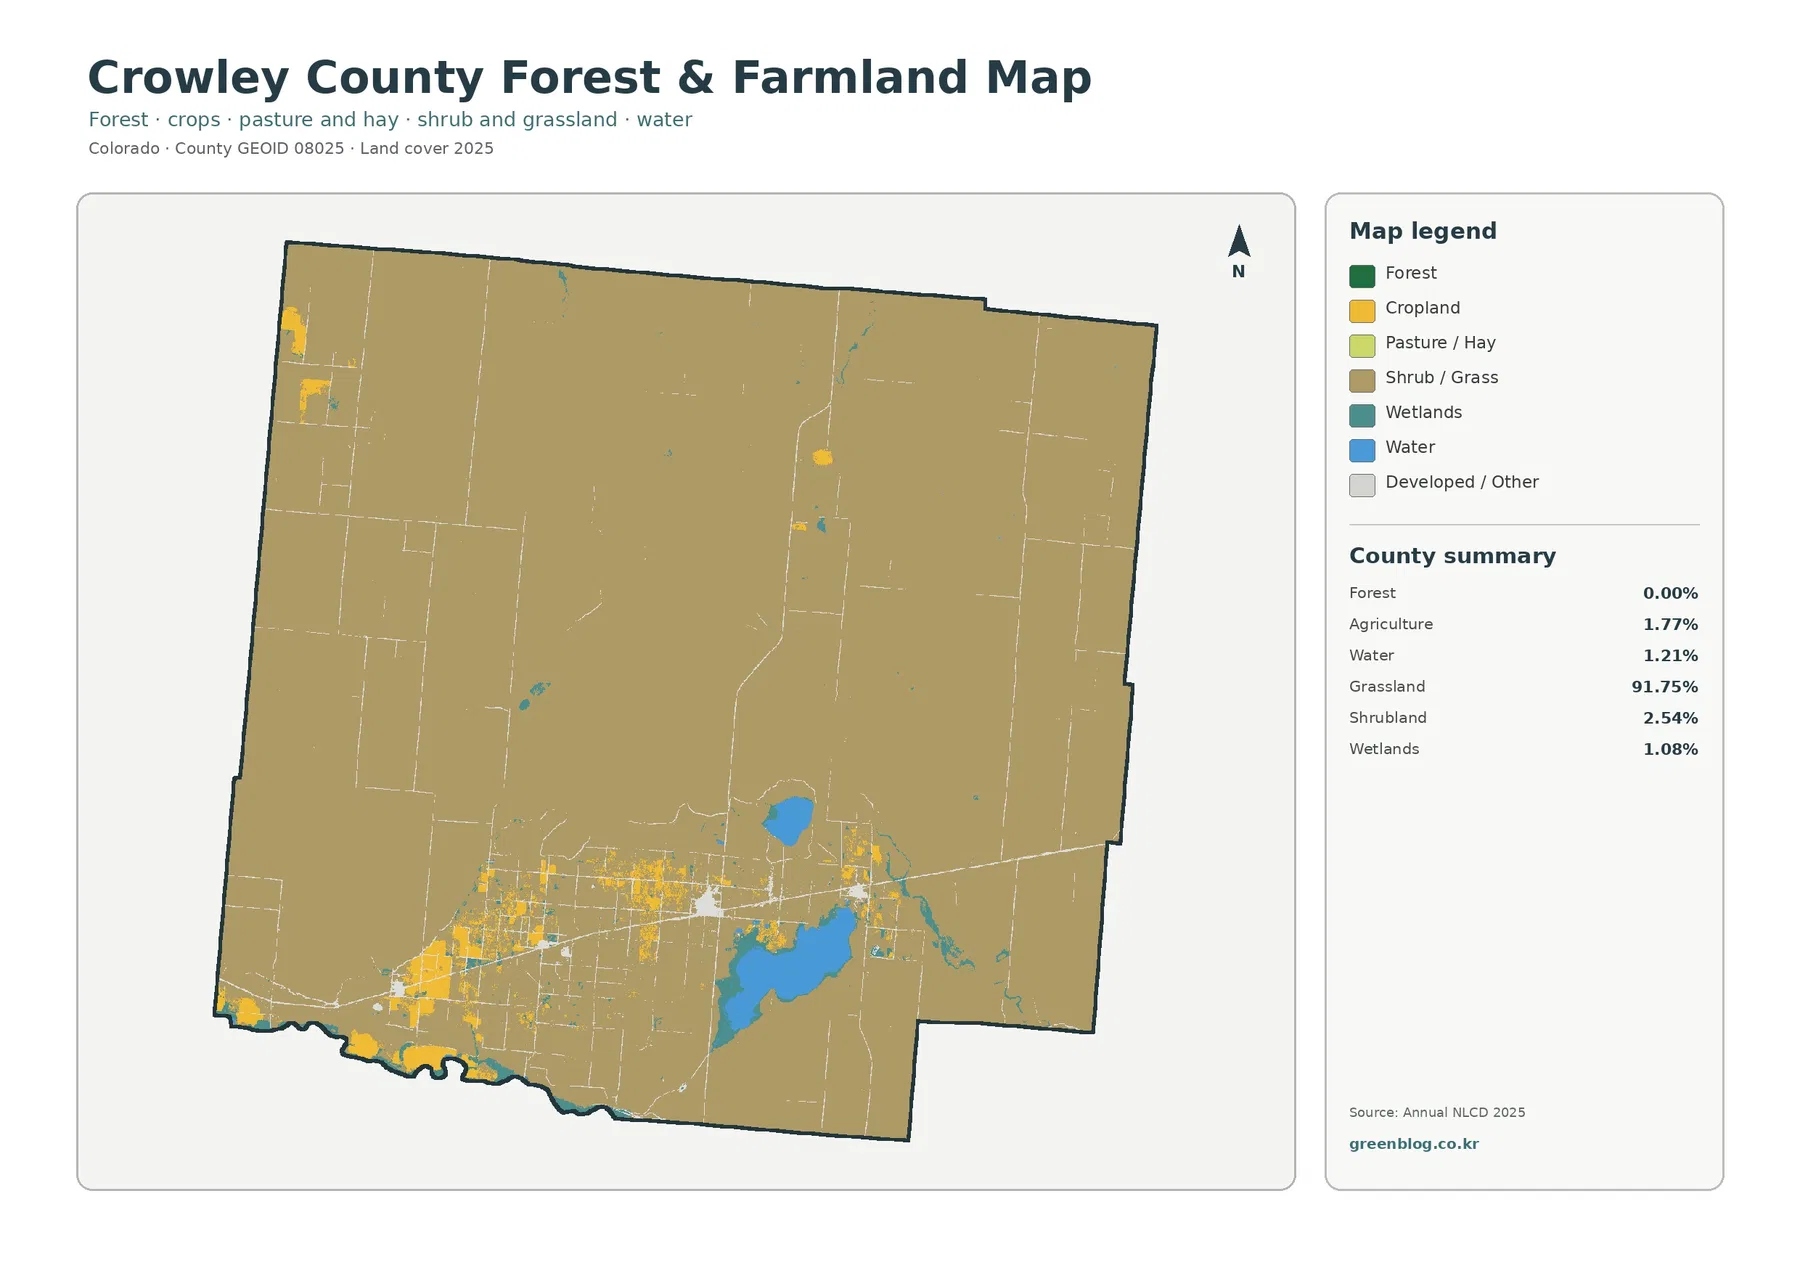
Agriculture covers 1.77% in the Annual NLCD summary. The mapped agricultural areas are especially easy to recognize in the southwest and south-central portion because many have straight edges and block-like forms. Smaller agricultural patches also occur farther north and toward the eastern side, but they are much less extensive. The USDA 2022 Census of Agriculture provides a separate county profile showing that farms, cropland, and pasture are part of the local agricultural economy. Its acreage categories are not the same as the 2025 NLCD land-cover classes, so those numbers should not be treated as interchangeable.
Wetlands account for 1.08% in the map summary and are most noticeable around parts of the southern water network. A wetland class does not mean that the mapped ground is permanently open water, and it does not establish a regulatory wetland boundary. It indicates the land-cover classification assigned to those cells. That makes the layer useful for broad environmental comparison, but site-specific wetland work requires newer and more specialized information.
Impervious cover stays very low across most of Crowley County
The impervious-surface map measures the share of a mapped cell covered by surfaces such as pavement and rooftops. Crowley County’s mean impervious value is 0.31%, and only 0.03% of the county is reported in the 50%-or-higher impervious category. Developed land in the general land-cover summary is 1.63%. Together, these values show that developed classification exists, but highly sealed urban surfaces occupy only a very small share of the county.
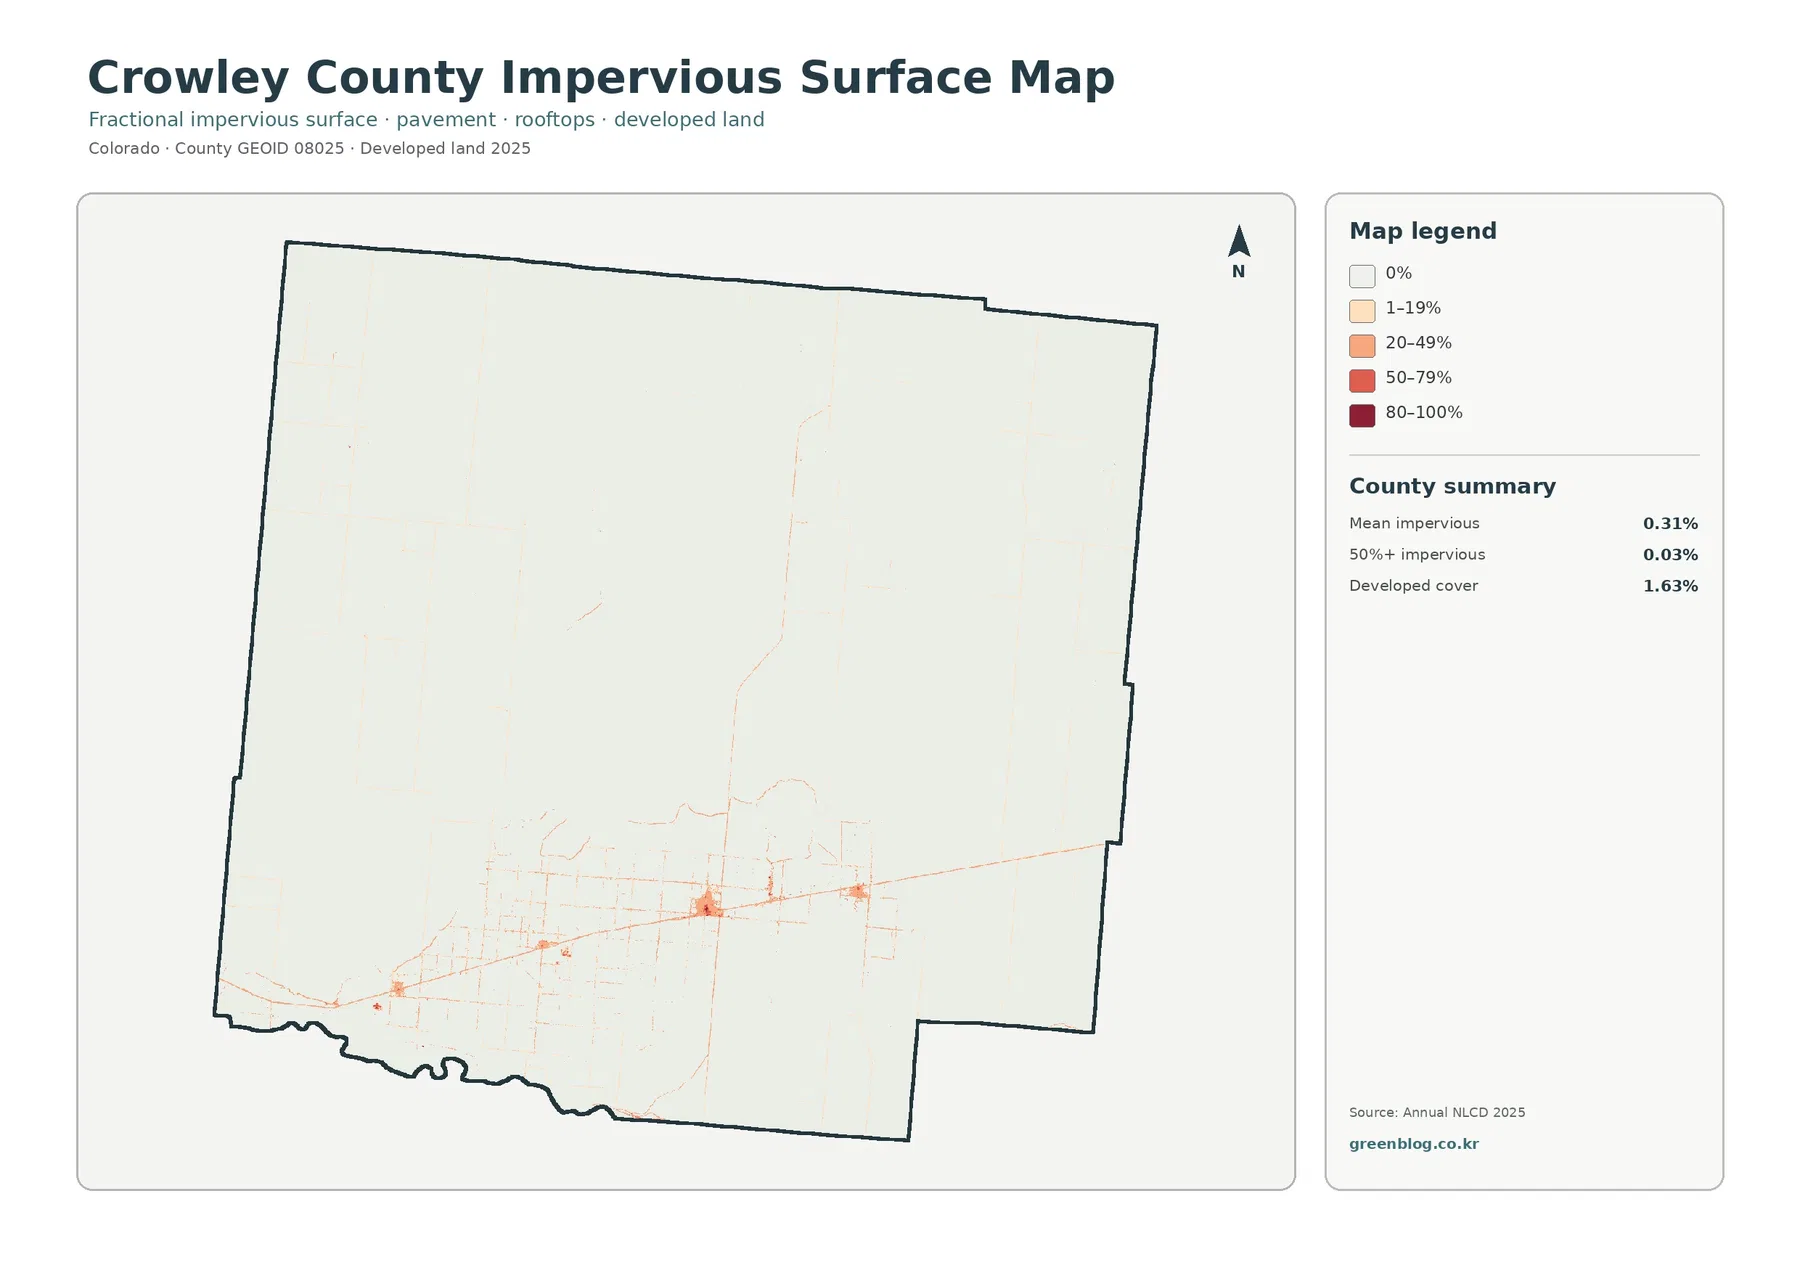
The visible pattern is concentrated along the south. Thin peach and red lines connect a series of small clusters, while the broad northern and central areas remain nearly blank on the impervious map. This is a useful way to separate the idea of “developed land” from the amount of hard surface actually present. A lightly developed cell can fall into a developed land-cover class while still containing substantial vegetation or open ground.
The 0.31% county mean should not be used as a direct measure of population, housing units, road mileage, or building count. Impervious cover is a surface characteristic. Its value here is that it helps a reader see where human-made surfaces are relatively concentrated and how limited they are compared with the enormous grassland background. For transportation planning or property-scale analysis, a dedicated road or parcel dataset would be more appropriate.
The 1985–2025 comparison highlights agricultural-loss classes
The change map compares the 1985 and 2025 classifications. It reports a total class difference of 13.46%. Agricultural-loss classification accounts for 9.42%, other class difference for 3.48%, change to developed for 0.25%, and forest loss for 0.00%. These are change categories, not the same statistics as the current 2025 cover shares. The current agriculture value of 1.77%, for example, cannot be subtracted directly from the 9.42% agricultural-loss value to calculate farm acreage change.
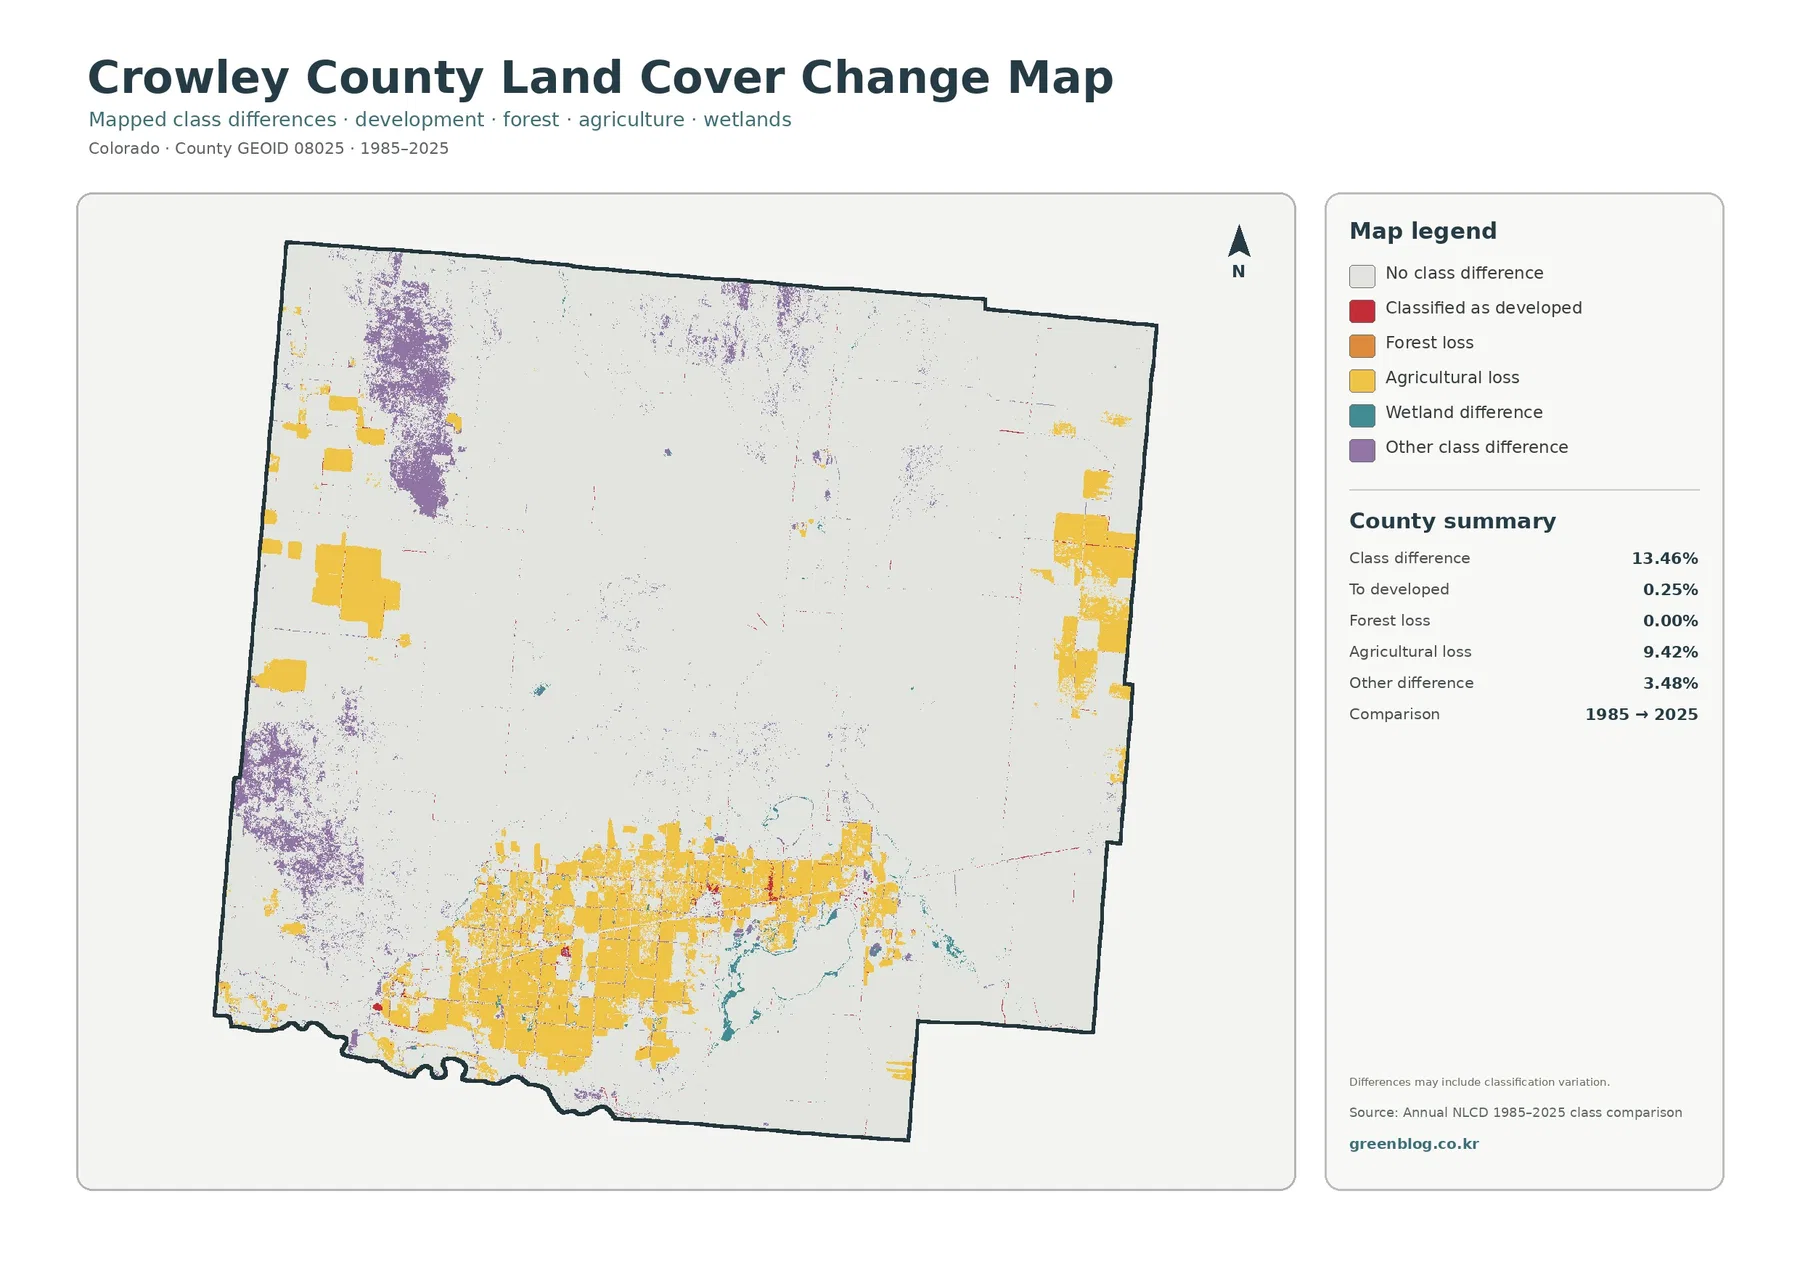
Yellow agricultural-loss areas are especially extensive in the southern part of the map, where many block-shaped patches form a broad band. Additional yellow areas appear near the western and eastern edges. Purple “other class difference” is more prominent in parts of the northwest and southwest and also appears as scattered smaller patches elsewhere. Red change-to-developed cells are present but limited, which matches the small 0.25% county summary value.
The map includes an important caution that class differences can include classification variation. A colored cell therefore should not automatically be described as land degradation, abandonment, or a documented development event. Historical material about Crowley County describes major long-term changes in irrigation and agricultural activity, and modern USDA statistics document the county’s farm sector from another perspective. Those sources can provide context, but determining the cause of a particular mapped change would require time-specific water, agricultural, imagery, and local land records.
How the southern settlement belt fits the broader grassland pattern
Public information about Crowley County identifies Ordway as the county seat and discusses Crowley, Olney Springs, and Sugar City among the county’s communities. Federal historic-preservation material places these communities along the Highway 96 and rail corridor north of the Arkansas River. The supplied land-cover and impervious maps independently show a stronger concentration of developed lines and small clusters across the county’s southern section. Because the maps are unlabeled, the article treats this as a broad regional correspondence rather than assigning every mapped feature to a named community.
This context helps explain why the county should not be summarized only as “91.75% grassland.” That number describes the dominant cover very well, but the smaller southern classes are where much of the mapped variety occurs. Farms, water, wetlands, and developed surfaces occupy modest countywide shares while forming recognizable local concentrations. A reader studying Crowley County gets a more accurate picture by considering both scales: the countywide prairie dominance and the southern patchwork of other land-cover types.
Ways to use the four maps in classes, comparisons, and reports
For a classroom exercise, begin with the 91.75% grassland statistic and ask students to locate the areas where the map departs from that dominant pattern. Moving to the forest-and-farmland view makes the southern cropland, water, and wetland patches easier to isolate. The exercise demonstrates that a category with a small countywide percentage can still be important when it is strongly concentrated in one part of the county.
County-to-county comparisons work best when the maps use the same observation year and classification system. Crowley County can be compared with more forested Colorado counties, more heavily farmed plains counties, or more urban counties to show how different cover types affect the appearance of a county map. The impervious layer is particularly helpful when two counties have similar developed-land shares but different concentrations of pavement and rooftops.
The change map is useful for adding a time dimension, but it needs careful wording. An agricultural-loss class of 9.42% does not by itself prove that farm acreage declined by exactly that percentage, nor does a change-to-developed class identify a specific construction project. In research or planning documents, the safest approach is to use this map to locate broad areas of classification difference and then consult agricultural statistics, water records, local planning material, or higher-resolution imagery for the question being studied.
Important limits of county-scale land-cover classification
Annual NLCD is a raster classification, which means the landscape is represented as cells rather than legal parcels. A cell can contain more than one real-world surface but still receive a single dominant class. Small roads, isolated buildings, narrow wetlands, or tiny water features can be generalized or mixed with surrounding cover. Boundaries between colors therefore should not be interpreted as surveyed property lines or exact field edges.
The current cover map represents 2025, while the change product compares 1985 with 2025. Conditions after the observation period may not be represented. Differences between years can also reflect classification behavior in addition to physical land change, which is why the change map itself warns about classification variation. The 13.46% class-difference figure is best read as a screening and comparison statistic rather than as a direct measure of environmental damage or development.
The original JPG files in this package are 2480×1754 pixels each. They preserve the supplied source resolution and are not artificially enlarged to claim more detail. The files are suitable for viewing, presentations, teaching, and county-scale reference. If a project requires precise site boundaries, legal status, engineering measurements, or current field conditions, use a purpose-built official dataset in addition to these maps.
Download the Crowley County land-cover JPG set
The ZIP below contains the original JPG versions of the 2025 land-cover map, forest-and-farmland map, impervious-surface/developed-land map, and 1985–2025 land-cover change map. Each file is 2480×1754 pixels and is provided at the original resolution supplied in the package. Use the on-page maps for quick comparison, then download the JPG set when you need the files for a lesson, presentation, county comparison, or reference document.
Frequently Asked Questions
What is the dominant land cover in Crowley County?
Grassland is the dominant 2025 class at 91.75%. Shrubland is 2.54%, agriculture 1.77%, developed land 1.63%, and water 1.21%, while wetlands are reported at 1.08% in the forest-and-farmland summary. The map shows the same pattern visually, with grassland covering most of the county.
Does 0.00% forest mean there are no trees anywhere in the county?
No. It means the county-scale Annual NLCD summary reports 0.00% in the mapped forest class. Individual trees, narrow tree rows, or small wooded patches can be too small or too mixed with surrounding cover to appear as a separate forest area at this mapping scale.
What does the 9.42% agricultural-loss class mean?
It marks areas where the 1985 and 2025 classifications indicate a change away from an agricultural class. It does not mean that official farm acreage fell by exactly 9.42%. Determining the cause or agricultural significance of those cells requires additional farm, water, imagery, and local records.
Map File Information
The ZIP contains four original Crowley County land-cover JPG maps.
- File Type: Four JPG files in one ZIP archive
Related Maps
- Adams County Colorado Land Cover Map
- Alamosa County Colorado Land Cover Map
- Arapahoe County Colorado Land Cover Map
Sources and Data References
- MRLC Annual NLCD Data — official access point for the land-cover data family used for the maps.
- USGS Annual NLCD Land Cover Classification — official class definitions and background for interpreting the mapped categories.
- U.S. Census Bureau TIGER/Line Shapefiles — official geographic boundary reference.
- Colorado.gov — Crowley County — official county contact and government information.
- USDA 2022 Census of Agriculture — Crowley County Profile — official county-level agricultural context.
Green Map creates custom-edited map images using open geographic data sources such as geoBoundaries, Natural Earth, OpenStreetMap, and government open data.
These maps are edited visual materials, not raw data files, and are provided for education, documents, presentations, and graphic reference.