Chaffee County sits in central Colorado where broad mountain slopes surround the long Arkansas Valley. The 2025 land-cover summary is led by forest at 42.59% and shrubland at 33.79%, while developed cover occupies only a small share and clusters along the central valley. That sharp contrast between wooded mountains, open slopes, and compact settlement areas gives the county a land-cover pattern that is easy to recognize.
This page brings together four views of the same county: current land cover, forest and farmland, impervious surface, and mapped class differences from 1985 to 2025. The four original JPG maps are available in one download later on the page. You can use the set to compare mountain vegetation with the valley floor, locate the most developed surfaces, or place present-day cover beside the long-term change map.
Table of Contents
Mountain ranges frame a very different valley-floor pattern
The general land-cover map shows the countywide structure before any one class is isolated. Forest forms large connected areas along much of the western and eastern mountain terrain and continues through substantial parts of the north and south. A long central band contains much more shrubland, grassland, wetland, agriculture, and developed cover. The contrast is not a simple east-versus-west split; instead, a more open valley runs between heavily vegetated uplands on both sides.
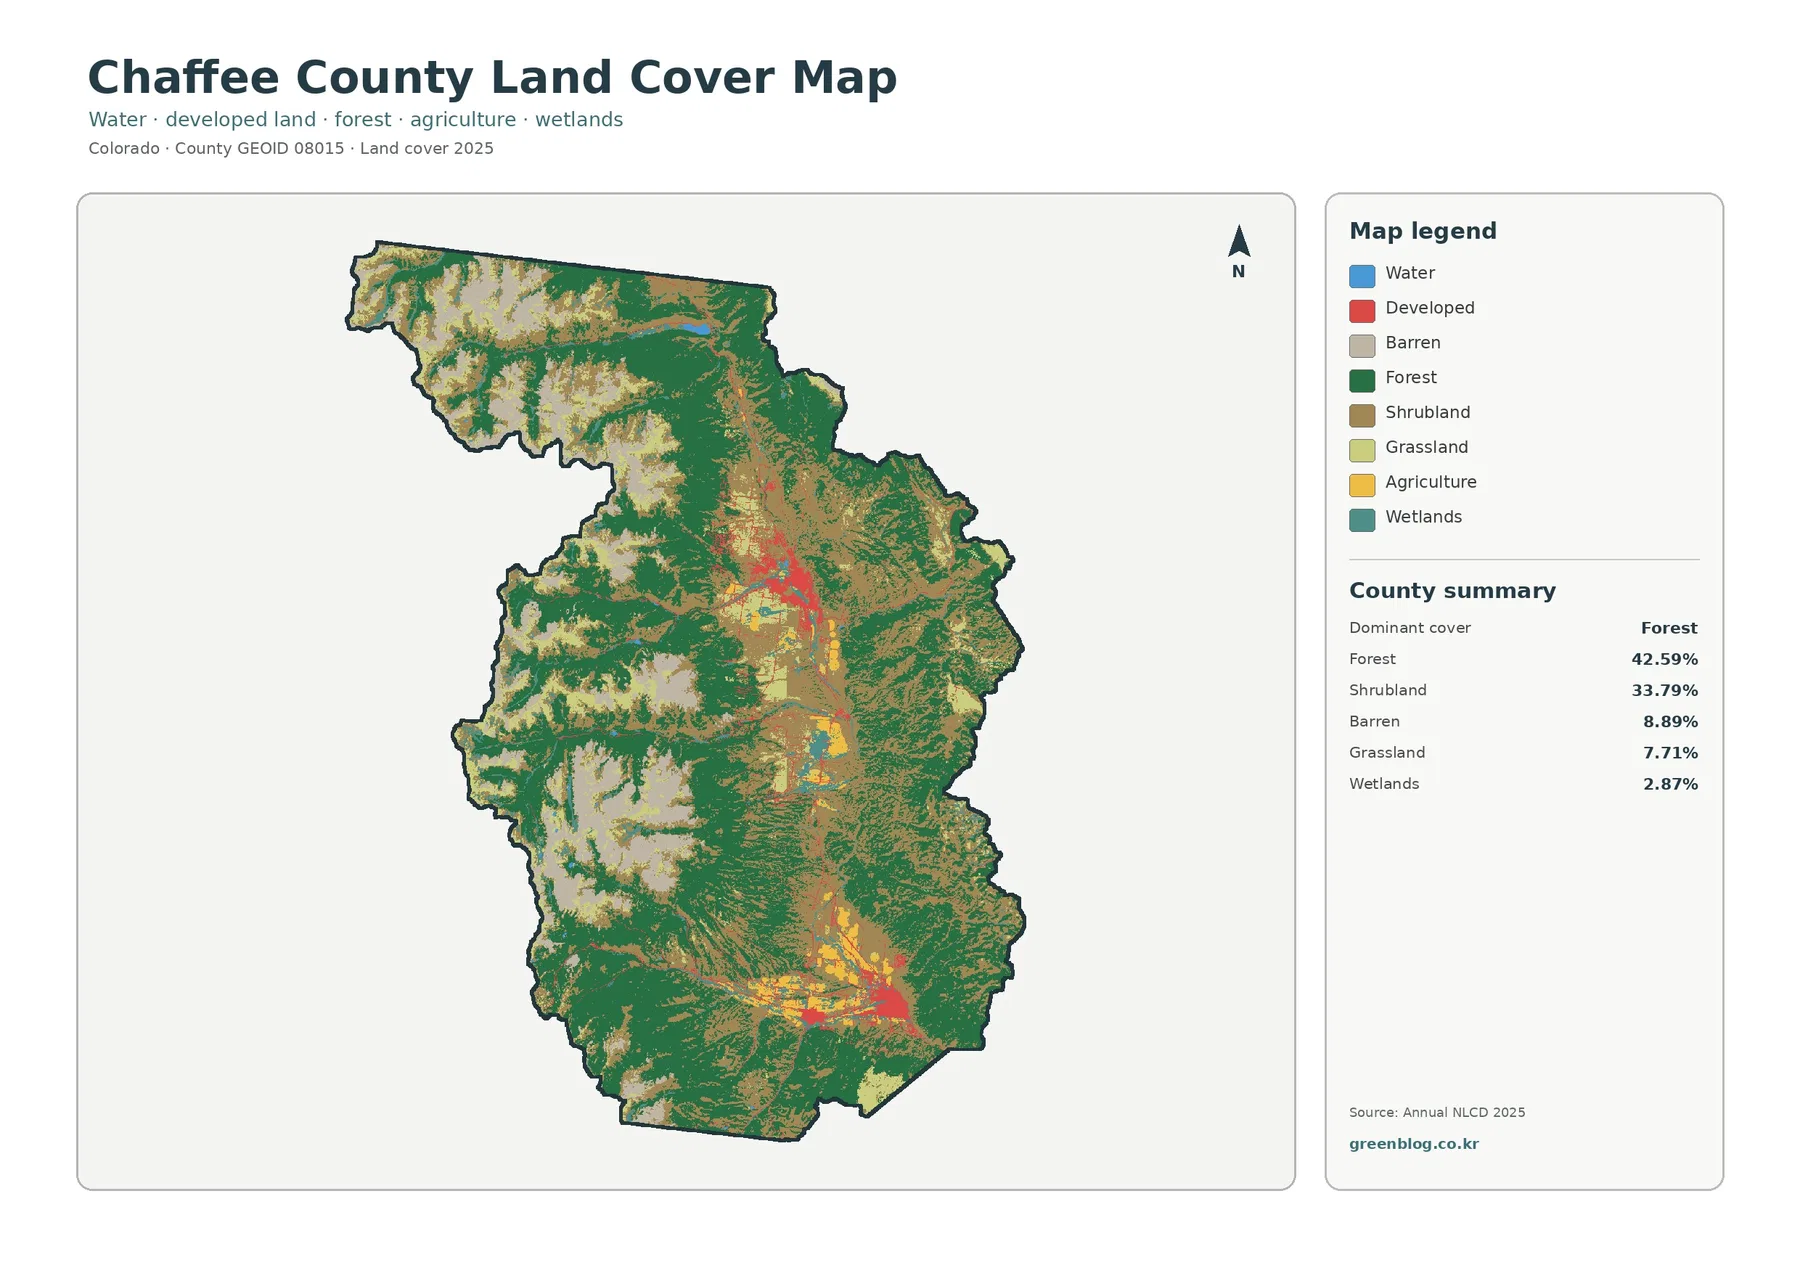
The supplied summary lists forest at 42.59%, shrubland at 33.79%, barren land at 8.89%, grassland at 7.71%, and wetlands at 2.87%. Those numbers explain why the map looks overwhelmingly green and tan rather than urban or agricultural. Barren areas stand out most clearly on high mountain terrain where pale patches interrupt the forest. Grassland is more scattered, often appearing where shrub and forest cover become less continuous. Wetland cells form much narrower features than either forest or shrubland.
Chaffee County’s own planning material describes the county as lying on the eastern side of the Rocky Mountains in central Colorado. The Sawatch Range forms the western side, the Mosquito Range lies to the east, and the Arkansas Valley runs between them. That official geographic description gives names to the broad pattern visible in the land-cover image. The map does not show elevation directly, but the distribution of forest, barren ground, and open valley cover clearly follows the county’s mountain-and-valley setting.
Land cover is different from zoning, ownership, or legal land use. Annual NLCD classifies the surface into categories such as forest, shrubland, developed land, agriculture, wetland, and water. A forest-classified cell does not tell you who owns the land or whether it is protected, and a developed cell does not identify the zoning district. For parcel boundaries, development rights, or regulatory decisions, the county’s official planning and GIS resources are the appropriate sources.
Impervious cover stays confined to small valley clusters
The impervious-surface map strips away most vegetation classes and focuses on hard surfaces such as rooftops, streets, parking areas, and other pavement. Nearly the entire county is very pale, indicating little or no impervious cover. The strongest orange and red concentrations appear in a few compact places along the central valley, with thin lines extending away from them. The mountain areas that dominate the general land-cover map are almost blank in this view.
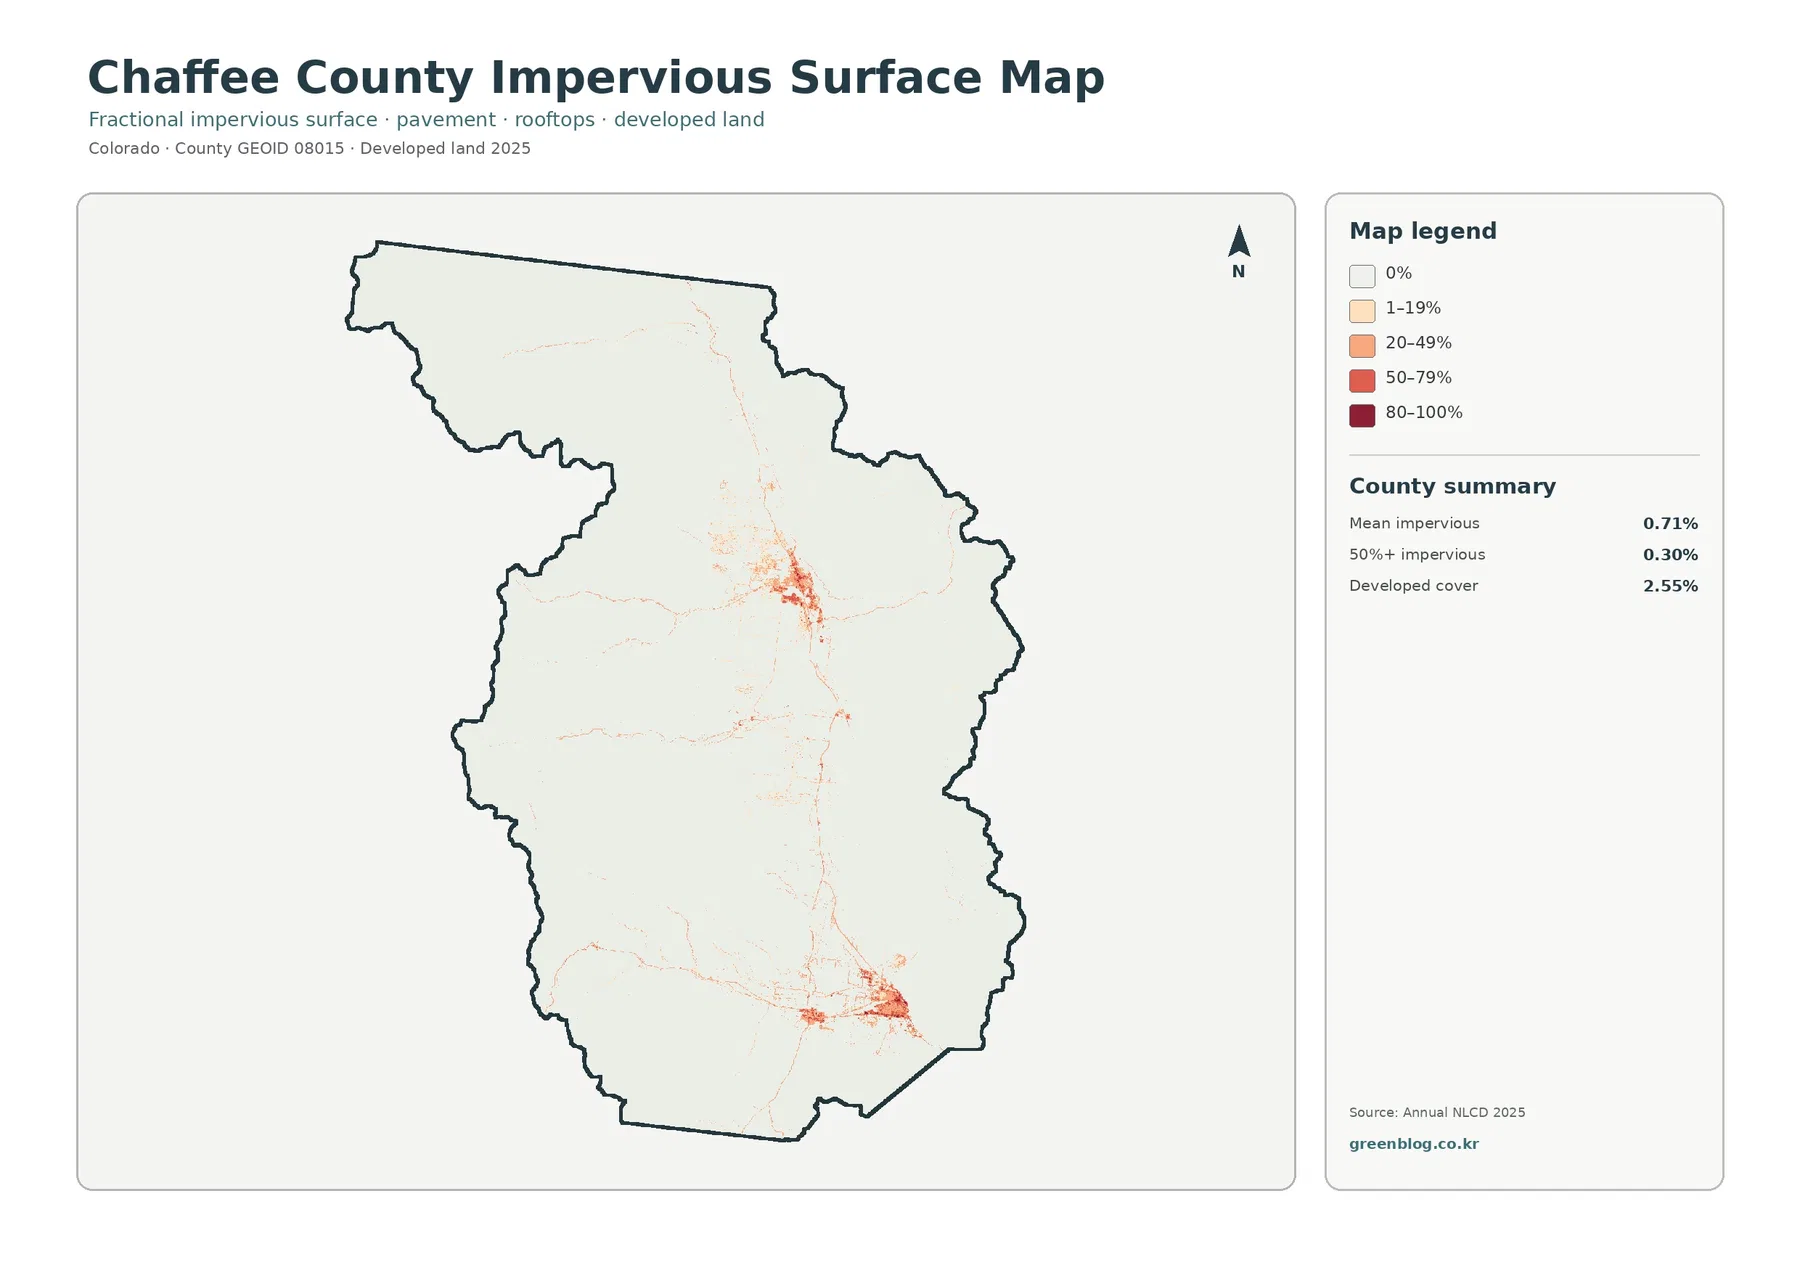
The supplied statistics put mean impervious cover at 0.71%. Only 0.30% of the county falls in the 50% or greater impervious category, while developed land cover totals 2.55%. Those figures describe different measures and should not match. A developed land-cover cell can include lawns, bare soil, trees, and other permeable ground along with buildings or pavement. High impervious fractions occur only where hard surfaces occupy much more of the cell.
The forest and farmland view exposes small features along the Arkansas Valley
When developed and miscellaneous cover is visually muted, the central valley becomes much easier to examine. Forest still occupies the broadest continuous areas on the mountain sides, but the tan shrub-and-grass belt through the middle is more obvious. Cropland and pasture or hay appear as small yellow and light-green blocks rather than a wide agricultural plain. Their limited extent makes location more important than area: they are concentrated in the valley instead of being spread evenly across the county.
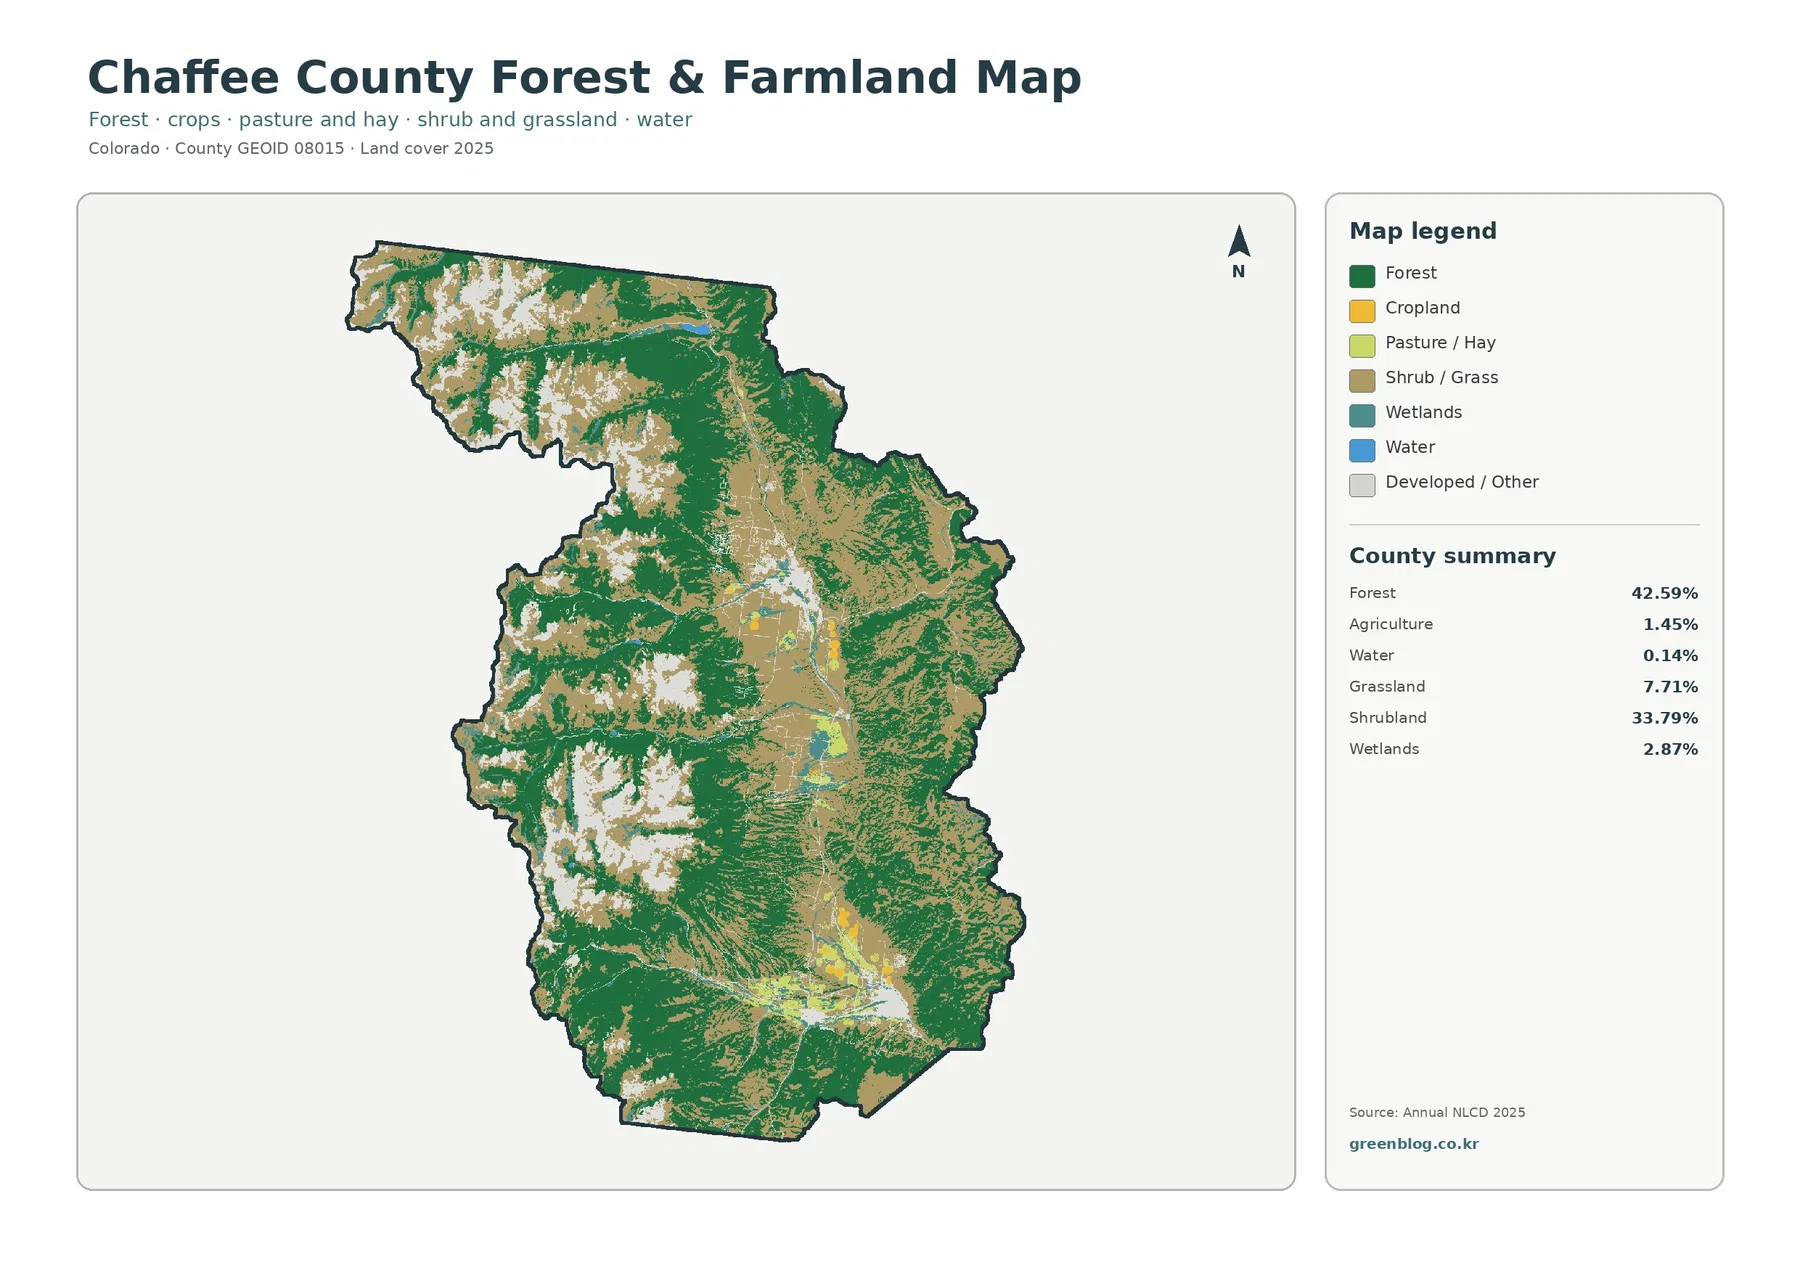
The map summary reports agriculture at 1.45% and water at just 0.14%, alongside forest at 42.59%, shrubland at 33.79%, grassland at 7.71%, and wetlands at 2.87%. Agriculture therefore represents a very small fraction of the county, yet its bright color makes the valley patches easy to locate. This is a useful reminder that a class can have a small countywide percentage and still be geographically distinctive when it is concentrated in one corridor.
Change from 1985 to 2025 is scattered rather than countywide
The change map compares the classified land cover in 1985 with the 2025 result. Gray means no class difference in this two-date comparison. Red marks cells classified as developed, orange marks forest loss, yellow indicates agricultural loss, and purple represents other class differences. Most of Chaffee County remains gray, while the colored changes appear as small clusters and scattered pixels. Red is most noticeable around parts of the central settlement corridor rather than across the broad mountain landscape.
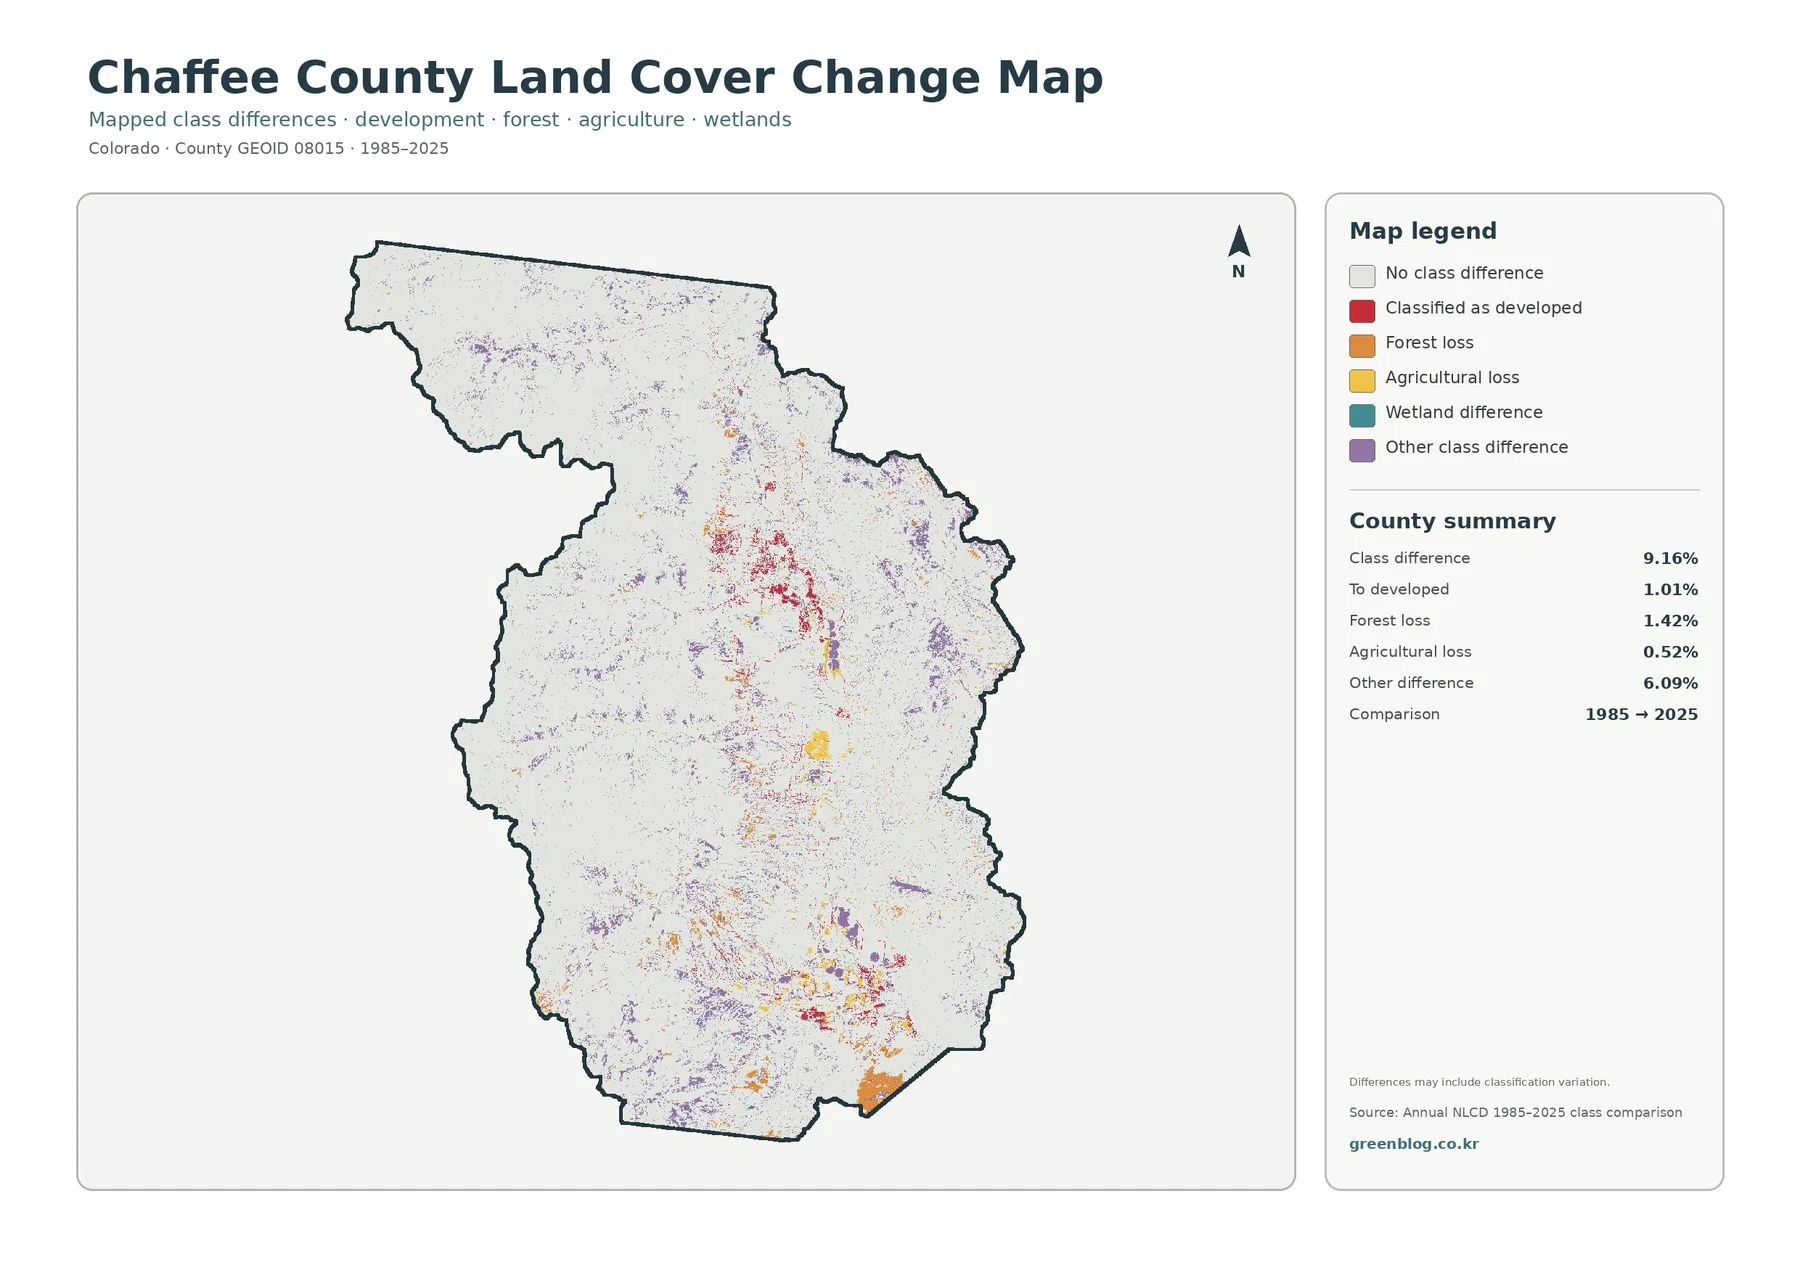
The county summary reports class differences across 9.16% of the mapped area. Of that total, 1.01% is listed as change to developed, 1.42% as forest loss, 0.52% as agricultural loss, and 6.09% as other differences. The relatively modest developed-change share fits the present-day impervious map, where built surfaces remain concentrated in small areas. At the same time, the change map identifies enough colored locations to show that the landscape has not been completely static.
What these maps can and cannot tell you
Annual NLCD is a raster dataset, meaning the landscape is represented by a grid of cells rather than parcel-by-parcel boundaries. A single cell can contain more than one real surface, such as a road beside grass or a house surrounded by trees. That mixed-pixel effect is one reason narrow roads, small streams, isolated buildings, and tiny vegetation patches may look generalized. The county maps are well suited to broad spatial comparison, not to engineering measurements or legal boundary work.
The 2025 classification also represents a dated snapshot. Construction, fire, vegetation recovery, or other changes after the observation period will not appear until a later dataset captures them. Likewise, the 1985–2025 comparison does not provide a year-by-year history. It tells you that the endpoint classes differ, not when the transition occurred. These limitations matter most when the map is being used to discuss a specific site rather than the countywide pattern.
Download the Chaffee County map files
The ZIP package contains four original JPG files: general land cover, forest and farmland, impervious/developed land, and the 1985–2025 land-cover change map. Each supplied JPG is 2480×1754 pixels and is provided at the package’s original resolution. The WebP versions in the article are convenient for quick viewing, while the JPG files are better suited to saving, inserting into documents, or placing side by side for comparison.
Frequently Asked Questions
Why do forest and shrubland dominate the Chaffee County map?
The supplied 2025 summary classifies 42.59% of the county as forest and 33.79% as shrubland. Chaffee County’s official geographic description places the Arkansas Valley between the Sawatch and Mosquito ranges, which helps explain why the map contains large mountain vegetation zones around a more open central corridor. Those percentages describe surface cover, not ownership or protected-land status.
What does mean impervious cover of 0.71% mean?
It indicates that hard surfaces such as rooftops and pavement occupy a very small share when averaged across the entire county. The map shows that these surfaces are not evenly distributed; they cluster in a few valley settlements and along transportation lines. The 2.55% developed-cover value is a different classification measure and should not be treated as the same statistic.
Does the 1985–2025 change map show the exact year development occurred?
No. It compares the classified endpoints in 1985 and 2025. A red cell indicates that the later result is classified as developed under this comparison, but it does not identify the year or cause of the transition. Aerial imagery, permits, or other annual records are needed for a detailed timeline.
Map File Information
The ZIP contains four original JPG maps for comparing Chaffee County land cover, vegetation, hard surfaces, and long-term class differences.
- File Type: Four JPG files in one ZIP archive
Related Maps
- Adams County Colorado Land Cover Map
- Alamosa County Colorado Land Cover Map
- Arapahoe County Colorado Land Cover Map
Sources
- MRLC Annual NLCD Data — Official access to Annual NLCD land-cover products used for current and historical comparison.
- USGS Annual NLCD Land Cover Classification — Definitions for developed land, forest, shrubland, grassland, agriculture, wetlands, and other mapped classes.
- Chaffee County Planning & Zoning — Official county information on land area, public lands, incorporated communities, land-use planning, and GIS resources.
- U.S. Census Bureau TIGER/Line Shapefiles — Official county boundary and geographic reference data.
Green Map creates custom-edited map images using open geographic data sources such as geoBoundaries, Natural Earth, OpenStreetMap, and government open data.
These maps are edited visual materials, not raw data files, and are provided for education, documents, presentations, and graphic reference.