Plumas County has a land-cover profile that is unusually balanced among three large natural classes. In the supplied 2025 map, grassland leads at 32.52%, forest follows at 29.99%, and shrubland accounts for 27.83%. Developed cover is much smaller at 3.87%, while lakes, wetlands, and small agricultural areas create distinct local features. The four maps on this page separate current cover, forest and farmland, impervious surface, and 1985–2025 class differences so those patterns can be compared without treating them as the same measure.
The WebP images are quick page previews. The four original JPG maps are available together in one download farther down the page, which makes it easy to use one map in a report or keep all four for side-by-side reference. Land cover describes the physical surface category assigned to mapped cells; it does not establish zoning, parcel ownership, legal land use, or whether a site can be developed.
Table of Contents
A 0.73% mean impervious value reveals how lightly hard surfaces cover the county
Plumas County has a mean impervious value of 0.73%, and only 0.12% of the county is mapped at 50% impervious or higher. Those numbers are far below the 3.87% developed-cover figure because the two measures answer different questions. Developed land is a broad land-cover category that may contain lawns, trees, bare soil, and other permeable surfaces. Imperviousness estimates the harder portion made up of pavement, roofs, and similar surfaces that shed water rather than allowing it to soak into the ground.
Most of the impervious map is white or nearly white. The strongest orange and red cells form a few compact clusters instead of a continuous urban field. One of the clearest concentrations lies south of the large northern lake, with another compact group farther south near the middle of the county and smaller traces in the southeast. Thin lines also cross portions of the map, but this is not a road map and those lines should be read as narrow hard-surface patterns rather than assigned to a specific route without another reference.
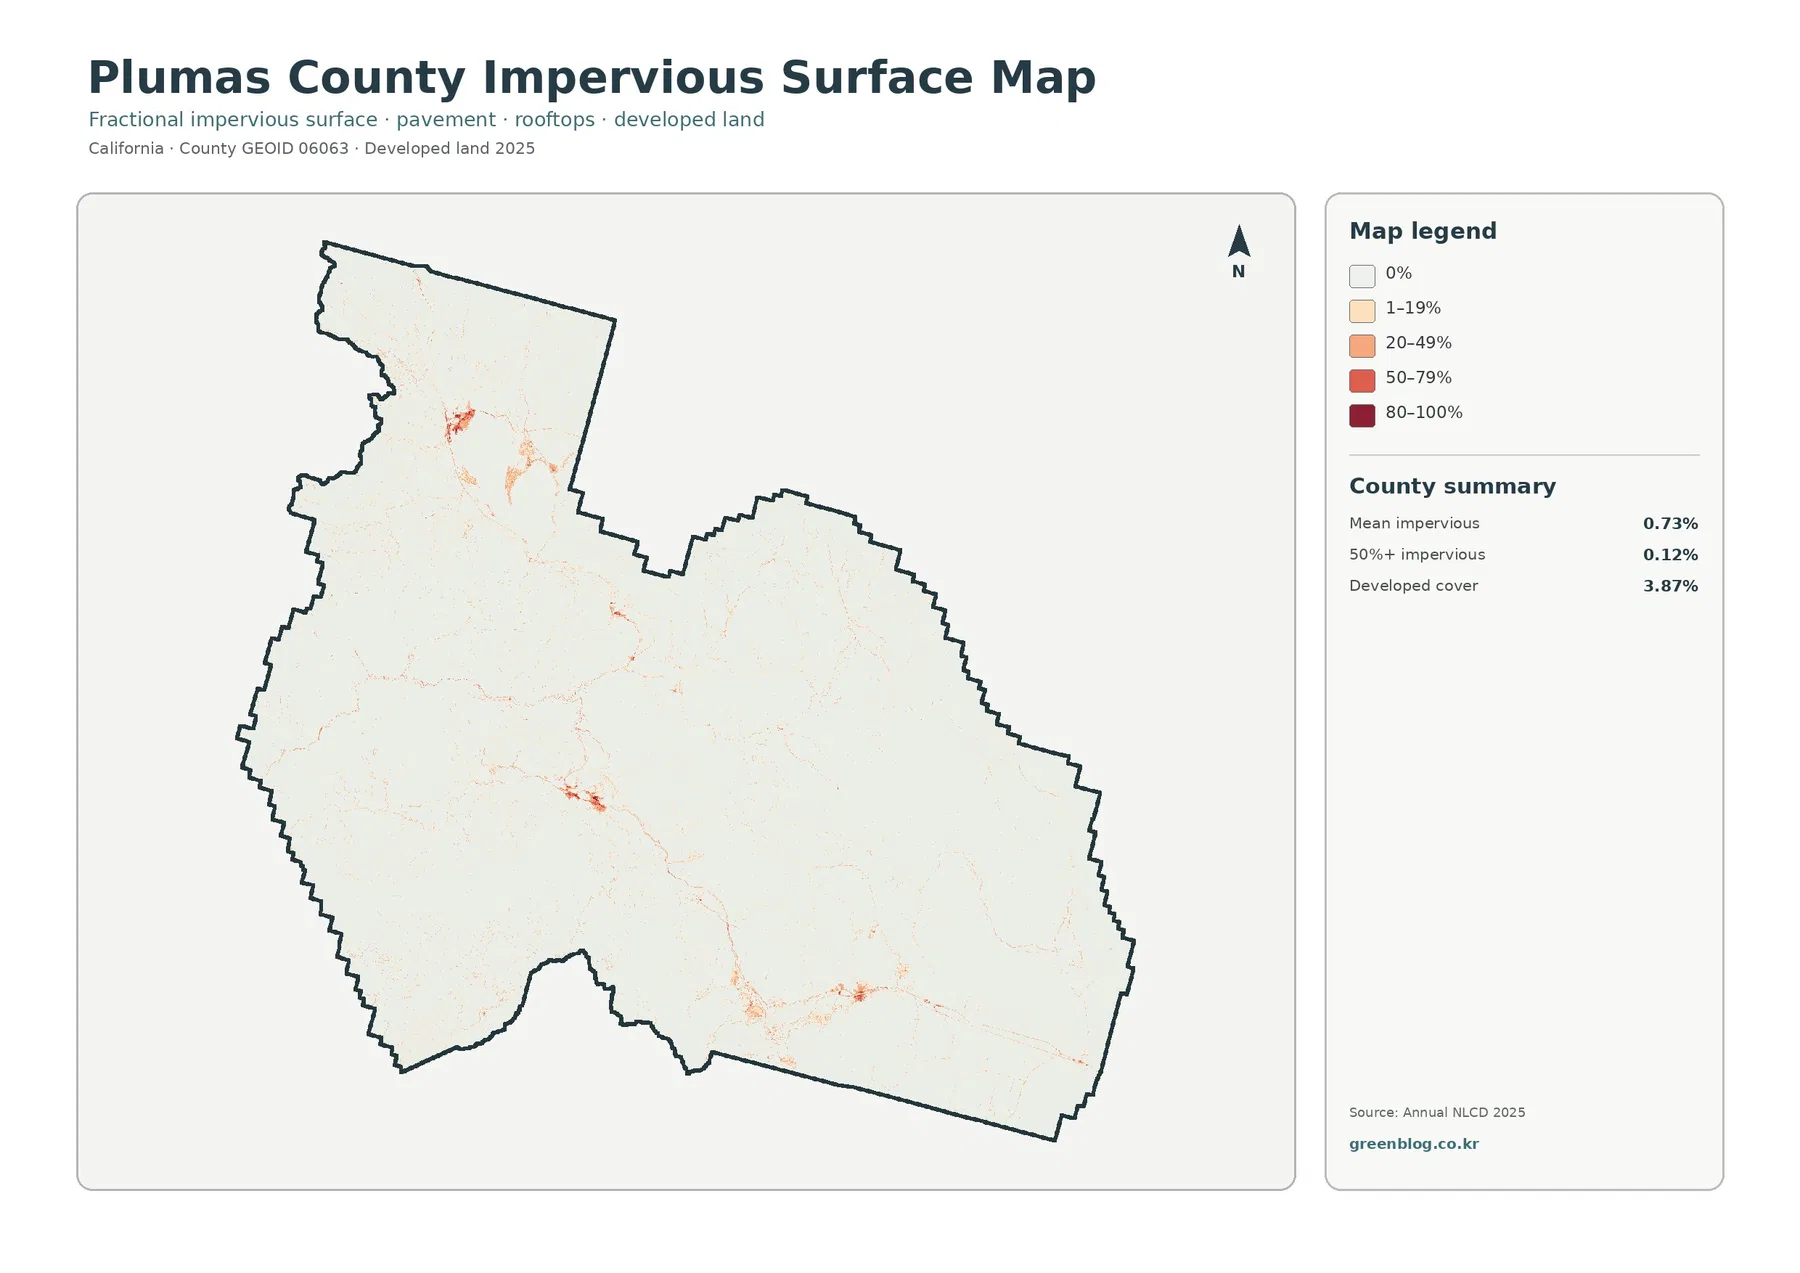
The low countywide average can hide those local concentrations. A small town can contain a much higher share of roofs and pavement than the surrounding forest, shrubland, or grassland, yet still contribute little to the county average because Plumas County covers a broad rural and mountain landscape. The impervious map is therefore most useful when the overall 0.73% figure is read together with the location of the darker clusters.
Imperviousness is not a flood-risk rating. Runoff also depends on slope, soil, rainfall, streams, wetlands, drainage systems, and the size of the contributing watershed. The map can help identify places where hard surfaces are concentrated, but a drainage or hazard question requires additional hydrologic and engineering information.
Grassland, forest, and shrubland divide most of the 2025 map
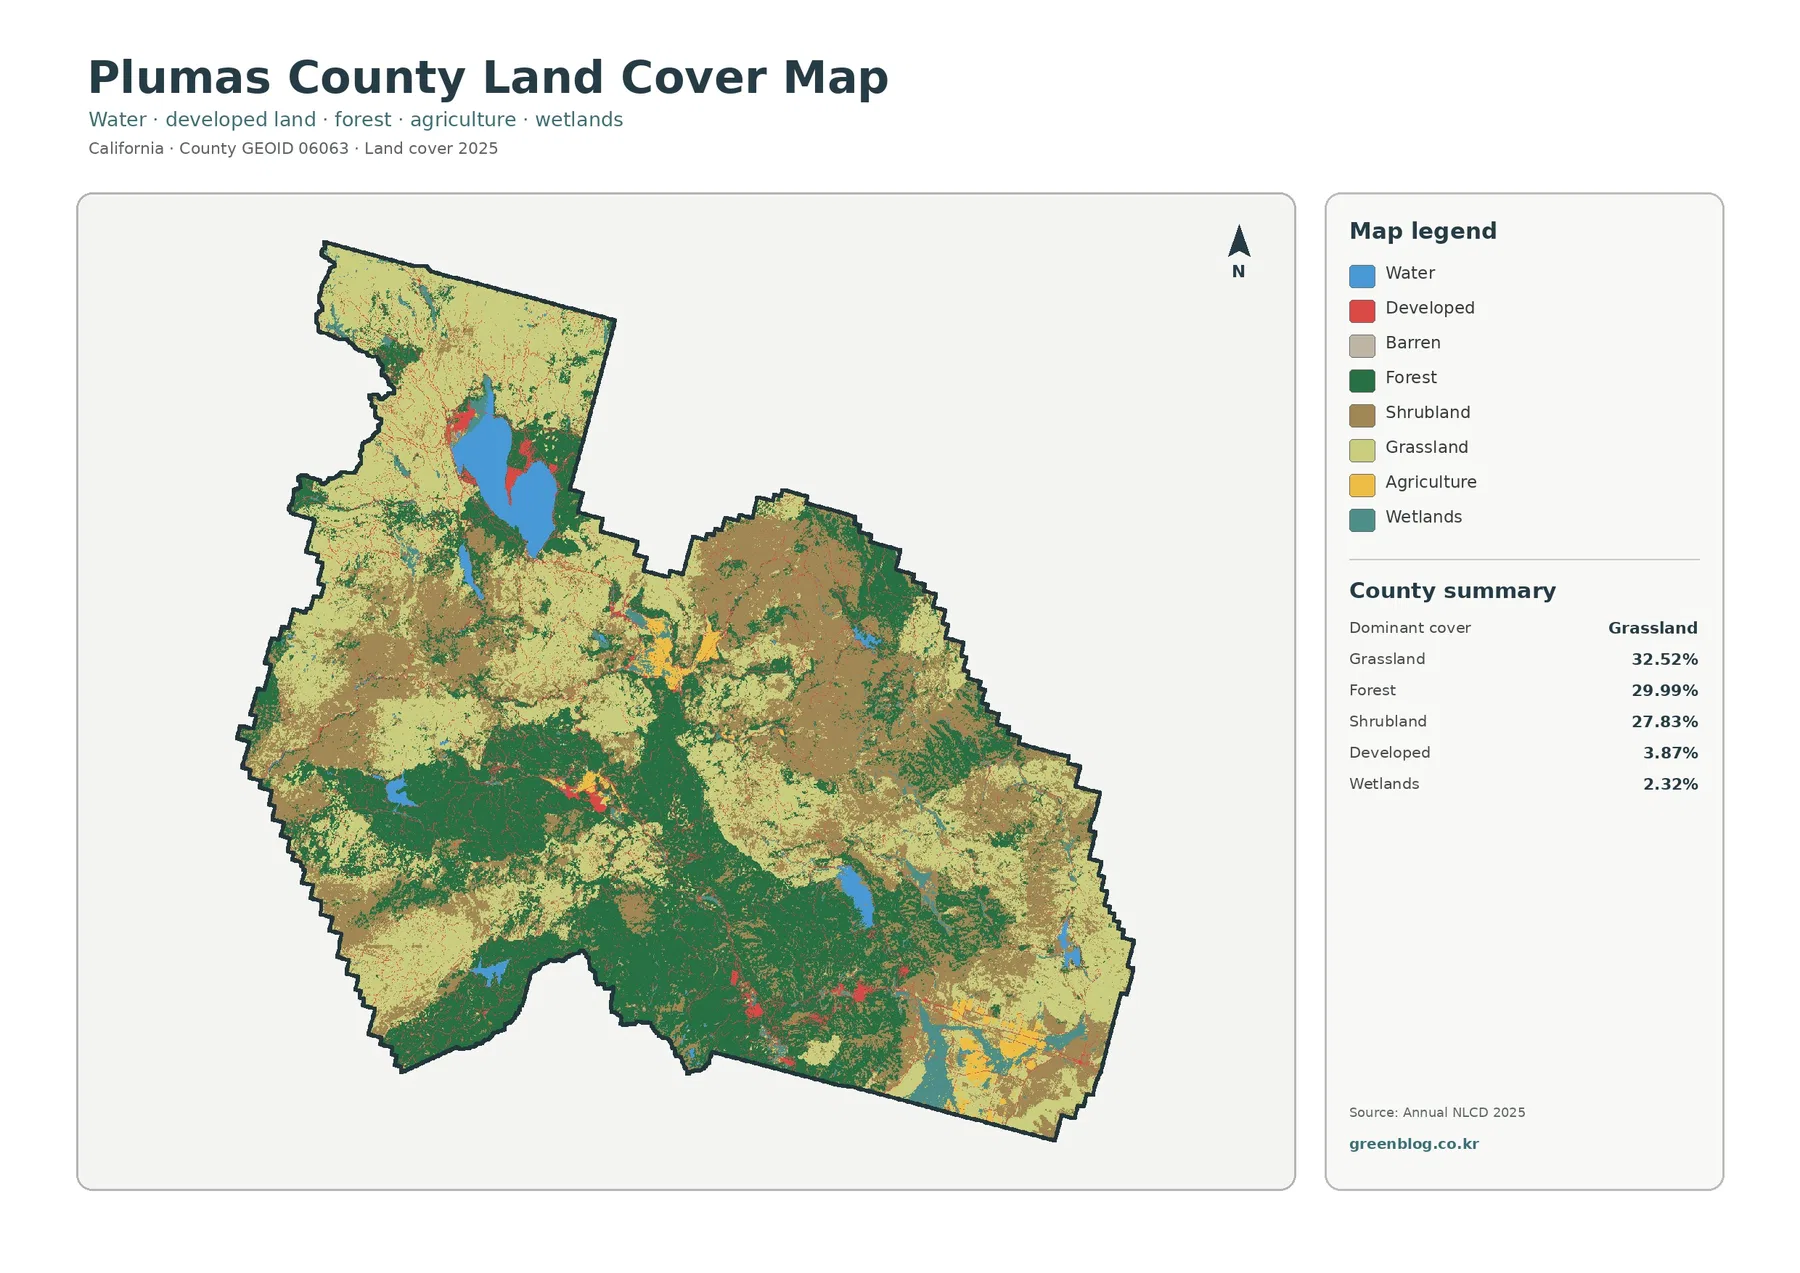
The general land-cover map explains why the impervious image is so light. Grassland occupies 32.52% of the county, forest 29.99%, and shrubland 27.83%. Together, those three classes account for most of the mapped area. Forest is especially broad across the south and southwest, while large grass and shrub areas cover much of the center, north, and east. The result is not one uniform natural landscape but a patchwork in which the leading class changes from one part of the county to another.
A broad forest block spans much of the southern portion of the county, with green extending into several central and eastern areas. Farther north and east, tan shrubland and pale green grassland become more prominent. These open-cover classes do not form neat bands; they interlock with forest in irregular shapes. That pattern is important because the countywide percentages are close enough that a visitor looking only at the totals might expect a more even visual mixture than the map actually shows.
The U.S. Forest Service describes Plumas National Forest as a northeastern Sierra Nevada landscape extending from western foothills toward the Great Basin, with much of the upper Feather River watershed within the forest. That regional description helps place the map in a wider mountain-and-watershed setting. It should not be used as a boundary substitute: a green land-cover cell does not automatically mean federal forest land, and a non-green cell can still fall within a managed forest boundary.
Lake Almanor makes water a small percentage with a large visual footprint
Water accounts for 2.24% in the forest-and-farmland summary, yet the largest northern water body occupies a conspicuous part of the map. Plumas County regional information identifies this feature as Lake Almanor, a reservoir on the Feather River system. Its size makes the blue area easy to find even though water is a small share of the county total. Several smaller lakes and water bodies appear elsewhere, especially through the western and southern portions of the county.
The land immediately around Lake Almanor is not mapped as a single cover type. Forest, grassland, shrubland, wetlands, and developed cells all occur near the shoreline area. The most visible northern developed cluster sits close to the lake, while wetland patches and smaller water features add narrow blue-green elements around the broader landscape. This is a good example of why land-cover percentages need a location: 2.24% water has a very different meaning when much of it is concentrated in one major lake rather than evenly scattered.
Wetlands make up 2.32% of the 2025 summary. Their patches are much smaller than the main forest, grassland, or shrubland fields, so they can disappear visually when the map is reduced. For watershed or habitat comparisons, it helps to locate the wetland color on the general map and then return to the simplified forest-and-farmland view, where surrounding classes are easier to separate.
Forest and farmland become easier to compare when developed cover is muted
The forest-and-farmland map reduces developed and other classes to gray, allowing vegetation and water to carry most of the visual detail. Forest remains 29.99% and forms its strongest continuous area across the south. Large shrub-and-grass expanses occupy much of the north and east, while smaller green forest patches continue through those open areas. The map is especially useful for seeing where forest is continuous and where it breaks into smaller pieces among shrubland and grassland.
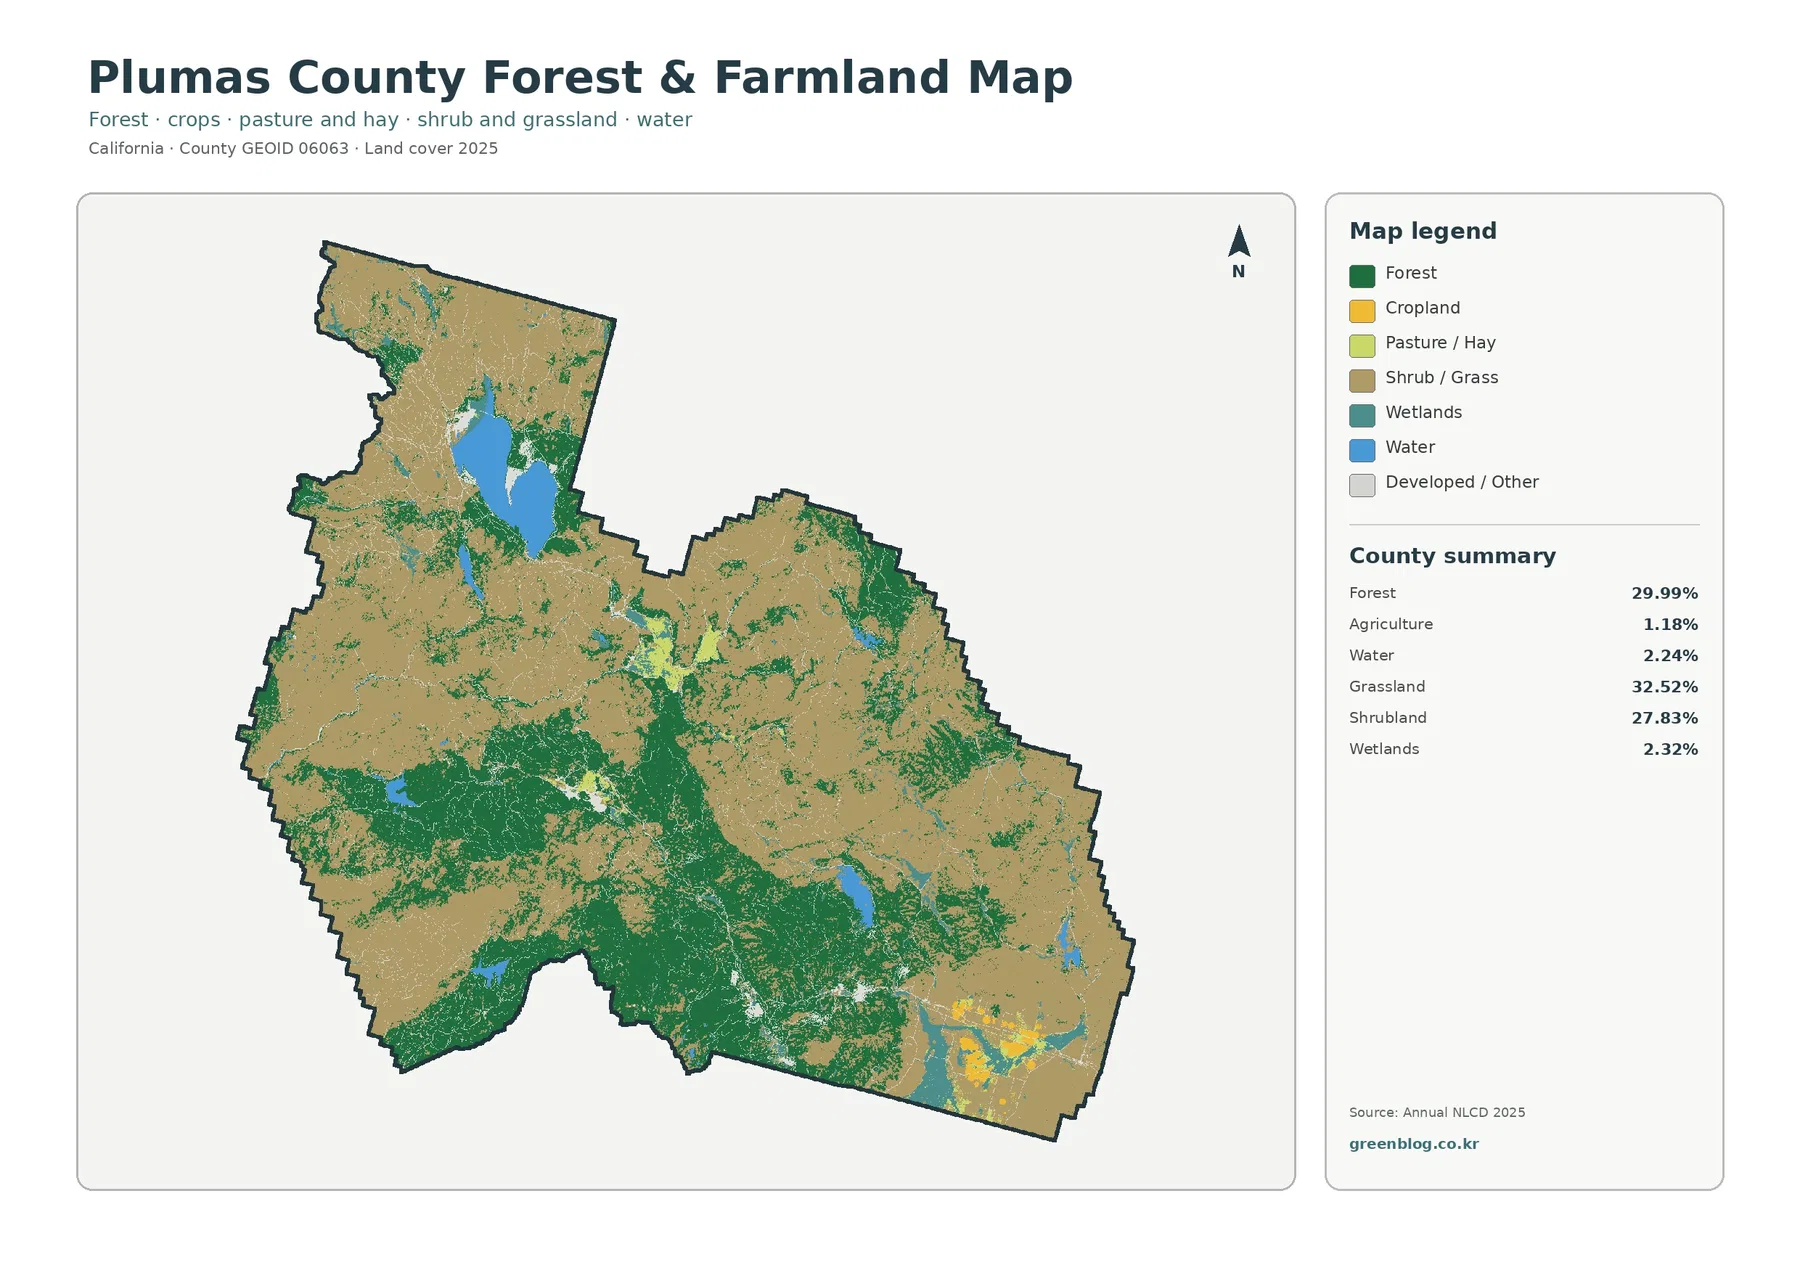
Agriculture is only 1.18% countywide. Even so, yellow agricultural cells are visible in the southeast and in a few smaller valley-like pockets elsewhere. Their limited area is part of the county story: agriculture does not form a large continuous plain here. Instead, it appears as a relatively small surface class surrounded by much larger forest, shrub, and grass cover.
Quincy provides useful local context for that mixture. Plumas County regional information places the county seat along the southern edge of American Valley after the Feather River Canyon opens into a broader valley setting. That description helps explain why open cover, small agricultural patches, and developed areas can appear within a county otherwise dominated by mountain vegetation. The mapped agricultural cells are still only a surface classification; they are not a legal agricultural district or parcel inventory.
Forest also should not be equated with ownership. The Forest Service manages extensive land in the region, but the 29.99% forest figure comes from the supplied 2025 land-cover classification rather than a property map. A parcel can be federally managed and mapped as shrub or grass, and privately owned land can be mapped as forest. Questions about jurisdiction, timber management, conservation status, or zoning need separate boundary data.
The 1985–2025 comparison is visually dramatic but requires the most caution
The change map reports a 53.55% class difference between the 1985 and 2025 endpoints. Its summary identifies 41.05% in the forest-loss category, 0.99% classified to developed, 0.42% agricultural loss, and 10.78% other class difference. Orange forest-loss cells cover large areas in the northwest, west, northeast, and other parts of the county, making this the most visually dominant change category.
A 41.05% forest-loss category does not prove that the same share of Plumas County experienced permanent deforestation. The map itself warns that mapped differences may include classification variation. Endpoint imagery, mixed pixels, vegetation condition, class rules, and real ground change can all contribute to a different label. The orange areas are best treated as locations where the two endpoint classifications disagree in a forest-related way, not as a complete history of what happened there.
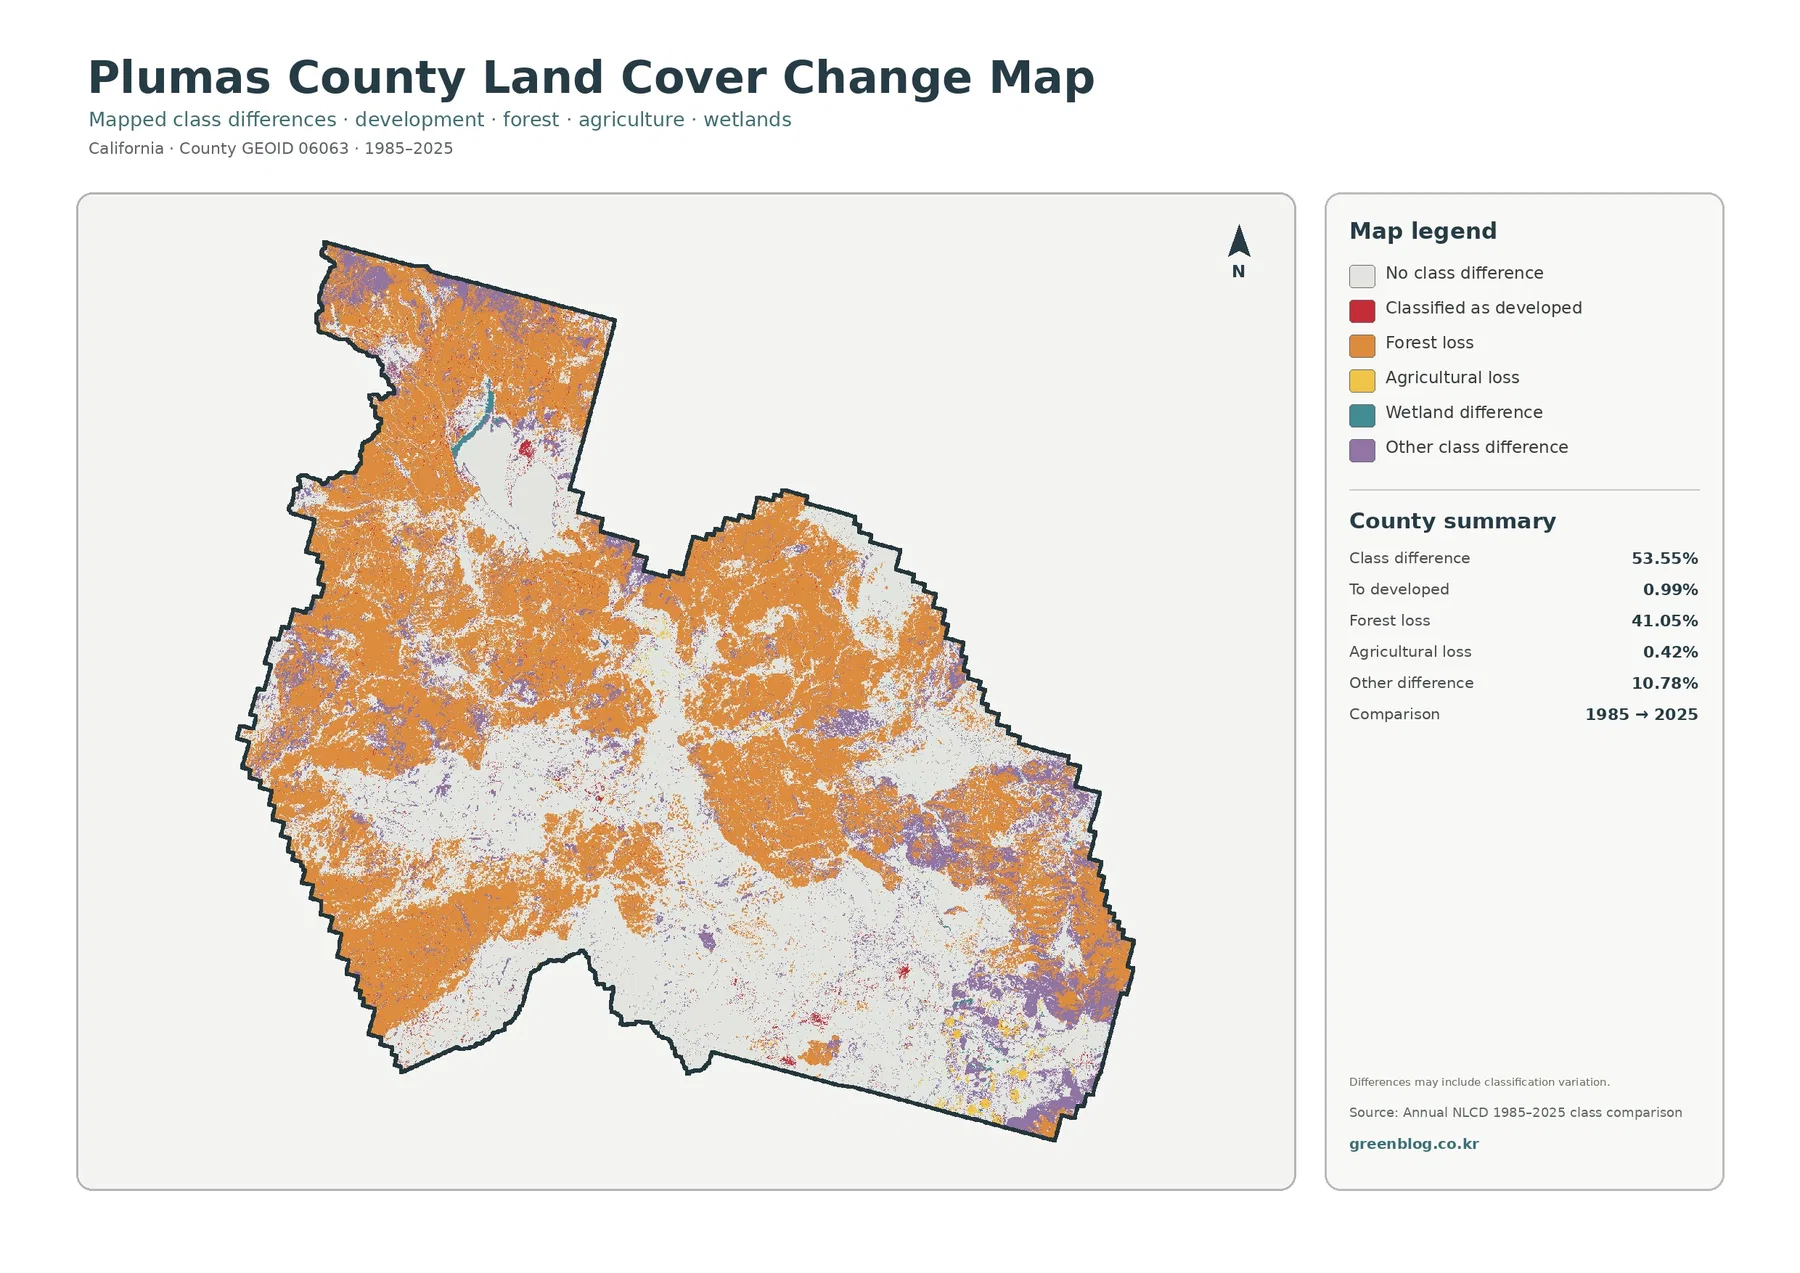
White areas deserve careful interpretation as well. White means the large endpoint class did not differ in the supplied comparison; it does not mean the ground remained unchanged every year for four decades. A location could have been disturbed and later returned to the same broad class, or it could have changed within a class without crossing the classification threshold. Intermediate Annual NLCD years are needed to reconstruct timing.
The map also contains sizable purple patches for other class differences, especially toward the southeast and in scattered portions of the county. Red developed differences are much smaller and appear mainly as compact points or short bands near existing settlement areas. Yellow agricultural-loss cells are limited. Comparing these colors with the 2025 current-cover map is more informative than reading any change color by itself.
Plumas National Forest materials discuss forest restoration, watershed work, and resilience as important management themes across the region. Those documents are useful follow-up sources when a mapped change area needs more context, but they do not establish the cause of a specific orange cell. Fire history, forest-treatment records, aerial imagery, and intermediate land-cover releases would be needed for a site-specific explanation.
The four maps answer different questions about the same county
For a quick orientation, start with the general land-cover map and identify three things: the broad southern forest, the extensive grass-and-shrub cover through the center and east, and Lake Almanor in the north. Once those anchors are clear, the countywide percentages become easier to interpret because each leading class has a visible geographic setting rather than being only a number in the legend.
Move to the impervious map when the question is settlement intensity. It shows that hard surfaces occupy a very small share overall but cluster sharply in a few places. Use the forest-and-farmland map when the question is vegetation or the limited agricultural footprint. That view removes much of the developed-color detail and makes the southern forest and scattered agricultural cells easier to compare.
Use the change map last. Current forest at 29.99% and the 41.05% forest-loss change category are not competing estimates of the same thing. One describes the 2025 surface class; the other identifies cells whose endpoint classifications differ in a particular way. Reading the current maps first reduces the chance of mistaking a change category for the amount of land in that class today.
Different combinations work for different presentations. A watershed or habitat discussion may pair the general map with the forest-and-farmland view so water, wetlands, forest, shrub, and grass can be compared. A settlement-focused presentation can pair current land cover with imperviousness. A long-term comparison should keep the 1985–2025 change legend visible and should state that the map is an endpoint classification comparison.
Map file information and JPG download
The download contains four separate JPG images for Plumas County: general land cover, forest and farmland, impervious surface and developed land, and the 1985–2025 land-cover change comparison. The preview images on the page help identify the useful map before saving the set. After download, each JPG can be placed separately in a document, slide, or print layout, or all four can be kept together for comparison.
Keep each map legend and date visible when reusing the files. The current-cover, forest-and-farmland, and impervious views use the supplied 2025 mapping, while the change image compares 1985 with 2025. If the date is cropped away, a later reader can easily confuse the map with another release or comparison period. The JPGs are finished reference graphics rather than raw raster datasets.
For printing, the general map is the best single-page overview because it preserves all major cover classes. The forest-and-farmland map is cleaner when the emphasis is vegetation, and the impervious map is useful when the small settlement footprint would otherwise be lost among stronger natural-cover colors. The change map is most effective beside a current-cover map so a reader can see what the same area is classified as in 2025.
Thirty-meter cells simplify shorelines, roads, and vegetation boundaries
Annual NLCD products use raster cells to summarize land cover. At the 30-meter scale associated with these products, one cell may contain trees, grass, a roof, pavement, and a stream edge at the same time. The finished map assigns a class or impervious value to that cell, which necessarily simplifies the real boundary. Lake Almanor shoreline areas, narrow wetlands, small settlements, and transitions between forest and open cover are places where that generalization matters.
The same issue affects the very low impervious percentages. A narrow road may occupy only part of a cell and be diluted by surrounding vegetation, while a compact developed cluster can produce much stronger values. Mean imperviousness of 0.73% is useful for countywide comparison, but it is not a parcel-level measurement of pavement or roof area.
Change mapping adds another layer of uncertainty because two classifications are compared. A mixed cell can receive one label in 1985 and another in 2025 even when the real-world boundary is gradual. The 53.55% class-difference total should therefore be used to locate broad areas for follow-up, not as a stand-alone measurement of permanent physical conversion.
Legal land use remains outside the scope of all four maps. Agricultural cover does not establish agricultural zoning, forest does not identify federal or protected ownership, and developed cover does not indicate what construction is permitted. Parcel, zoning, ownership, and planning questions should be checked against Plumas County administrative information rather than inferred from land-cover colors.
Frequently Asked Questions
Why is grassland the largest 2025 class when large forest areas are so obvious on the map?
Grassland leads at 32.52%, but forest is close behind at 29.99%. The forest is especially concentrated across the south, where large connected green areas stand out strongly. Grassland is spread more broadly through several central, northern, and eastern areas, while shrubland also occupies 27.83%. The map makes more sense when the three large natural classes are compared by location rather than ranked only by their countywide totals.
What is the difference between 3.87% developed cover and 0.73% mean imperviousness?
Developed cover is a broad land-cover class and can include permeable surfaces such as yards, trees, and soil within developed settings. Imperviousness estimates the hard share made up of pavement, roofs, and similar surfaces. Because much of the county is rural and mountainous, developed cover remains limited and the countywide mean hard-surface percentage is even smaller.
Does the 41.05% forest-loss category mean 41.05% of the county was permanently cleared between 1985 and 2025?
No. It means that 41.05% of the county falls in the supplied endpoint comparison category where a forest class changed to another broad mapped class. The map notes that classification variation may be included. Real vegetation change can be part of the result, but mixed pixels, imagery conditions, classification rules, and later recovery can also affect the endpoint labels. Intermediate years and local records are needed to determine cause and timing.
Sources and reference material
These sources provide the land-cover classification background, county boundary reference, and local context for Plumas National Forest, Lake Almanor, and Quincy/American Valley. Land-cover rasters, administrative boundaries, and resource-management documents serve different purposes, so they are best used together rather than treated as interchangeable maps.
- MRLC Annual NLCD Data — annual land-cover and related data products
- USGS Annual NLCD Land Cover Classification — land-cover class and legend documentation
- U.S. Census Bureau TIGER/Line Shapefiles — county boundary reference data
- Plumas National Forest Ecological Restoration Program — Forest Service context for the forest and upper Feather River watershed
- Lake Almanor | Plumas County — regional information about the major northern lake
- Quincy | Plumas County — regional context for Quincy and American Valley
Map File Information
The ZIP includes all four original JPG land-cover maps for Plumas County, California.
- File Type: ZIP containing four JPG files
Related Maps
- Alameda County California Land Cover Map
- Alpine County California Land Cover Map
- Amador County California Land Cover Map
Green Map creates custom-edited map images using open geographic data sources such as geoBoundaries, Natural Earth, OpenStreetMap, and government open data.
These maps are edited visual materials, not raw data files, and are provided for education, documents, presentations, and graphic reference.