The Glenn County California Land Cover Map set makes the county’s east–west contrast easy to see. Grassland is the largest 2025 class at 38.58%, followed by agriculture at 32.86% and shrubland at 18.92%. Most of the broad agricultural cover lies across the flatter central and eastern part of the county, while grass, shrub, and scattered forest occupy much of the western uplands. Developed cover is only 4.04%, but the larger developed patches are clearly concentrated around the county’s principal I-5 communities.
Four map views are included here: general 2025 land cover, forest and farmland, impervious surface and developed land, and a 1985–2025 land-cover change comparison. The page images are WebP versions for quick viewing, and the four original JPG maps are available together in one ZIP download. Land cover describes what physically covers the ground—such as crops, grass, shrubs, trees, water, wetlands, or built surfaces. It does not show ownership, zoning, parcel boundaries, or whether a site can legally be developed.
Table of Contents
A county split between western grass and eastern farmland
The general map is dominated by two broad patterns rather than a single countywide color. On the western side, pale green grassland and brown shrubland cover large areas, with darker green forest appearing in smaller patches. Moving east, yellow agricultural cover becomes much more continuous across the valley floor. This contrast is more informative than the percentages alone because it shows where the leading land-cover classes are concentrated inside the county boundary.
The Glenn County Resource Conservation District describes the county as lying in the Sacramento Valley between the Coast Range on the west and the Sacramento River on the east, with Interstate 5 running north–south through the middle. That local description matches the broad arrangement visible in the maps: upland vegetation to the west, major travel and community areas near the middle, and extensive agricultural cover across the flatter eastern valley. The map supports that geographic comparison, but it should not be used to assign a single cause to every change in vegetation or development.
Agriculture accounts for 32.86% of the mapped 2025 cover. The yellow area is extensive, yet it is not a perfectly uniform block. Small developed patches, narrow nonagricultural features, wetlands, and water interrupt the agricultural color in many places. That detail matters because a countywide percentage can make a category sound more uniform than it really is. At map scale, farms and fields share the valley with roads, communities, drainage features, water, and other surfaces.
Wetlands make up 2.30% of the summary, and water is listed at 0.58% on the forest-and-farmland map. Although those percentages are small, teal and blue areas are still visible along the eastern edge and in several interior locations, including a larger wetland area in the southern part of the county. The winding eastern boundary is also useful for orienting the map toward the Sacramento River side. Narrow streams and small wet areas can be generalized by a 30-meter raster, so this image is not a substitute for a legal wetland delineation or detailed hydrography.
Developed land represents 4.04% of the county. Two larger red concentrations stand out in the valley portion of the map, with smaller red marks and thin lines scattered around them. The RCD identifies Willows and Orland as the county’s two major cities along I-5, which provides a reliable local frame for reading those developed concentrations. The preview does not label every settlement, however, so smaller red patches should not be assigned to specific towns without another reference map.
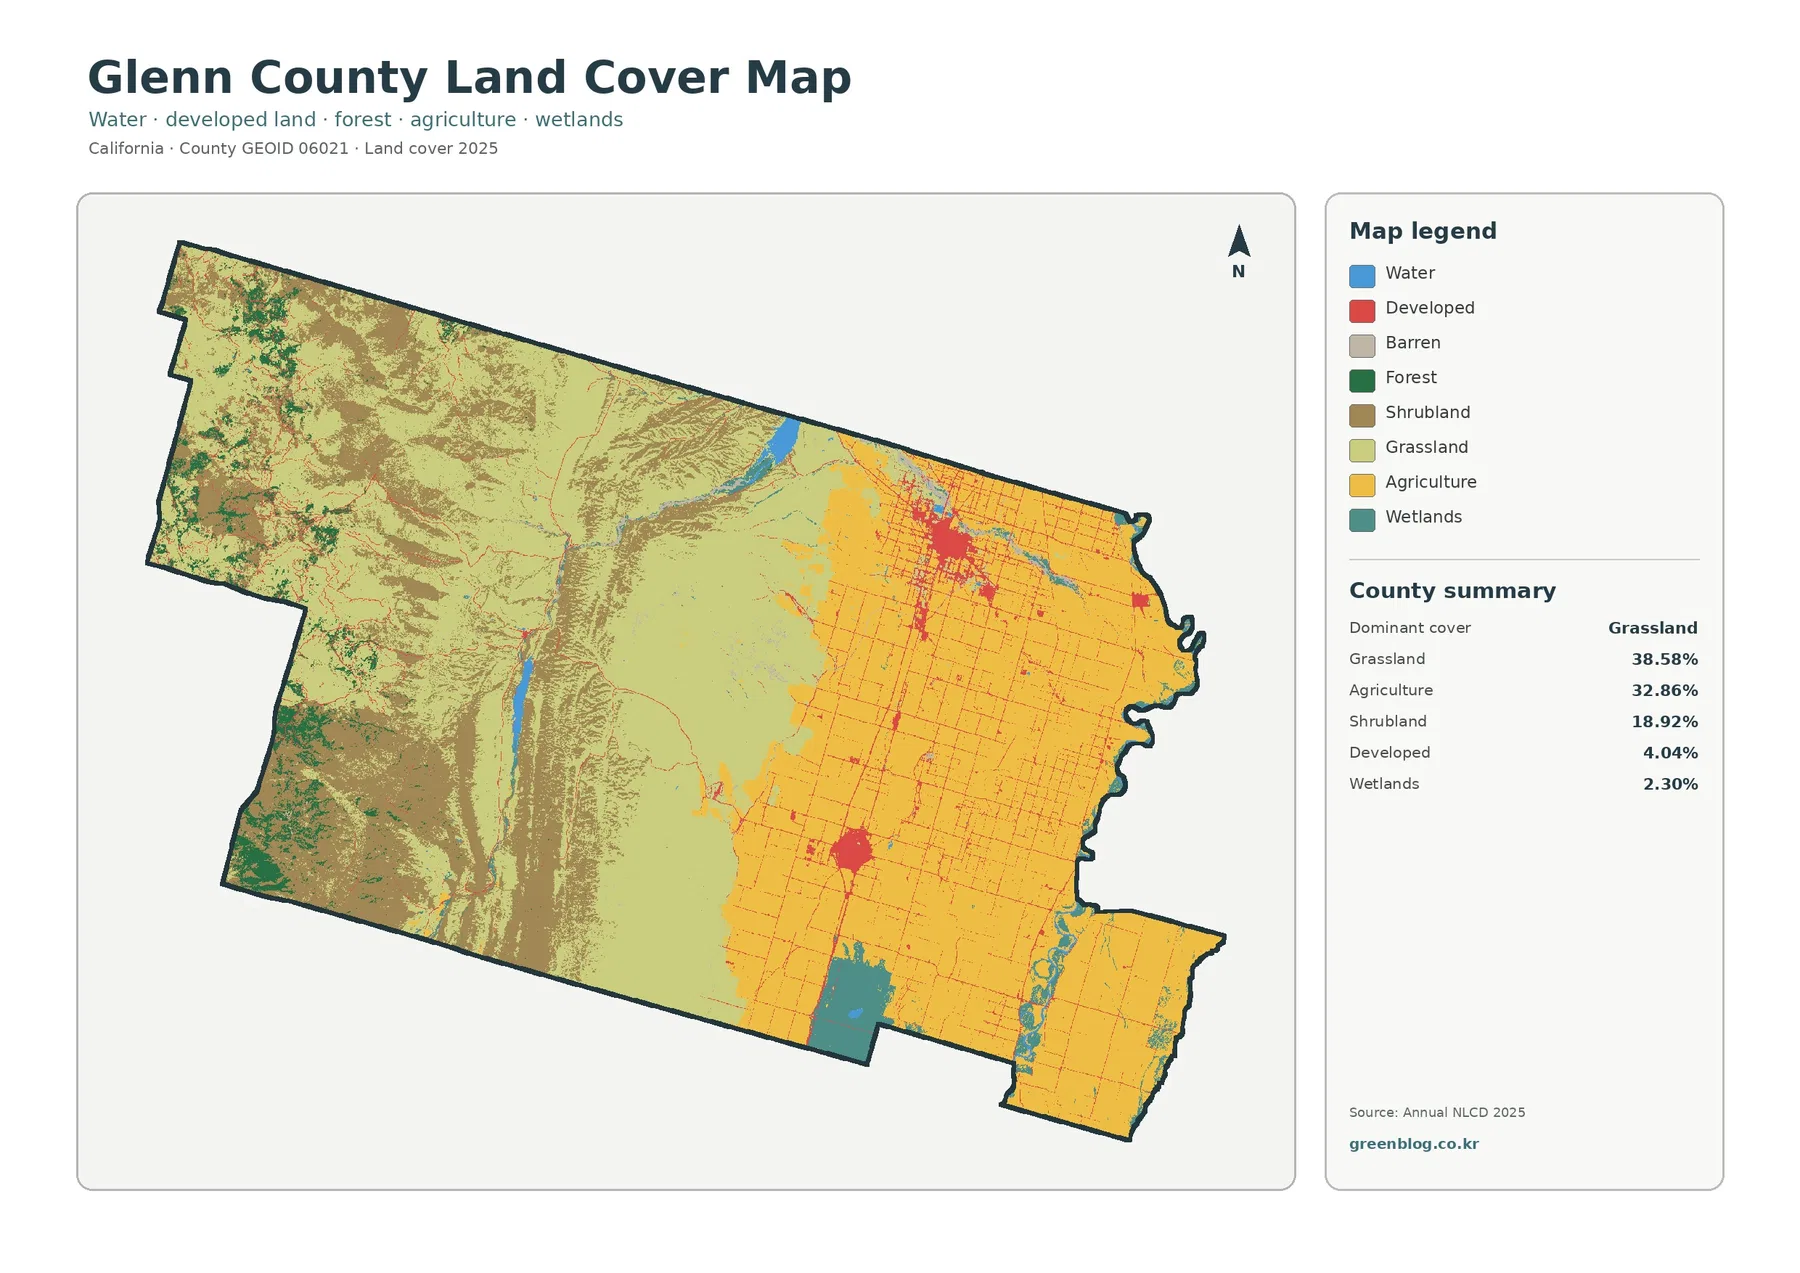
A practical way to read this map is to start with the broad west–east split and then add the smaller classes. First locate the western grass and shrub cover, then the eastern farmland, and finally the red developed areas, teal wetlands, blue water, forest patches, and minor barren areas. This sequence keeps the major landscape pattern clear while still showing how smaller features fit within it. It is usually more useful than comparing legend colors without paying attention to their location.
Forest and farmland become easier to compare in a simplified view
The forest-and-farmland map reduces the number of competing categories so the county’s dominant natural and agricultural cover is easier to compare. Grassland remains 38.58%, agriculture 32.86%, and shrubland 18.92%. Forest is 2.27%, wetlands 2.30%, and water 0.58%. The small forest percentage can look unimportant in a table, but the map shows that forest is not evenly distributed; it appears mainly as distinct patches in the western uplands rather than as a thin amount spread across the whole county.
Much of the western half is shown as shrub/grass cover, with forest breaking through in several clusters. The Glenn County RCD long-range plan discusses the western foothills and the county’s connection to the Mendocino National Forest. That context is useful for understanding why woodland and open vegetation occur together in this part of the county. The land-cover layer does not identify tree species, canopy age, ownership, timber status, or forest management units, so those questions require forestry or parcel data.
Farmland is much more prominent across the eastern valley. Glenn County’s General Plan treats agriculture as a major land use and contains policies intended to preserve agricultural land, but a planning designation is not the same thing as a satellite land-cover class. The yellow pixels here indicate land classified as agricultural cover in 2025. They do not tell a reader whether a parcel is zoned for agriculture, enrolled in a conservation program, or currently subject to a particular land-use policy.
The RCD long-range plan also notes more than 1,000 farms and roughly 705,000 acres under cultivation, with commodities including rice, almonds, dairy, walnuts, corn, and wheat. Those local facts help explain the importance of farming in Glenn County, but the map cannot distinguish those individual commodities. Its agricultural class groups many field conditions and crop types into a broader mapped category. Crop-specific production, acreage, or economics should therefore come from agricultural reports rather than from the color of a land-cover pixel.
Wetlands and water provide another reason to keep the legend visible. A larger teal area appears in the southern valley, while smaller wetland and water features occur along the eastern side and in interior drainage areas. The RCD identifies the Sacramento National Wildlife Refuge as one of the important federal lands connected with Glenn County, but the land-cover preview should not be treated as the refuge boundary. It shows physical cover, not jurisdiction or protected-area limits.
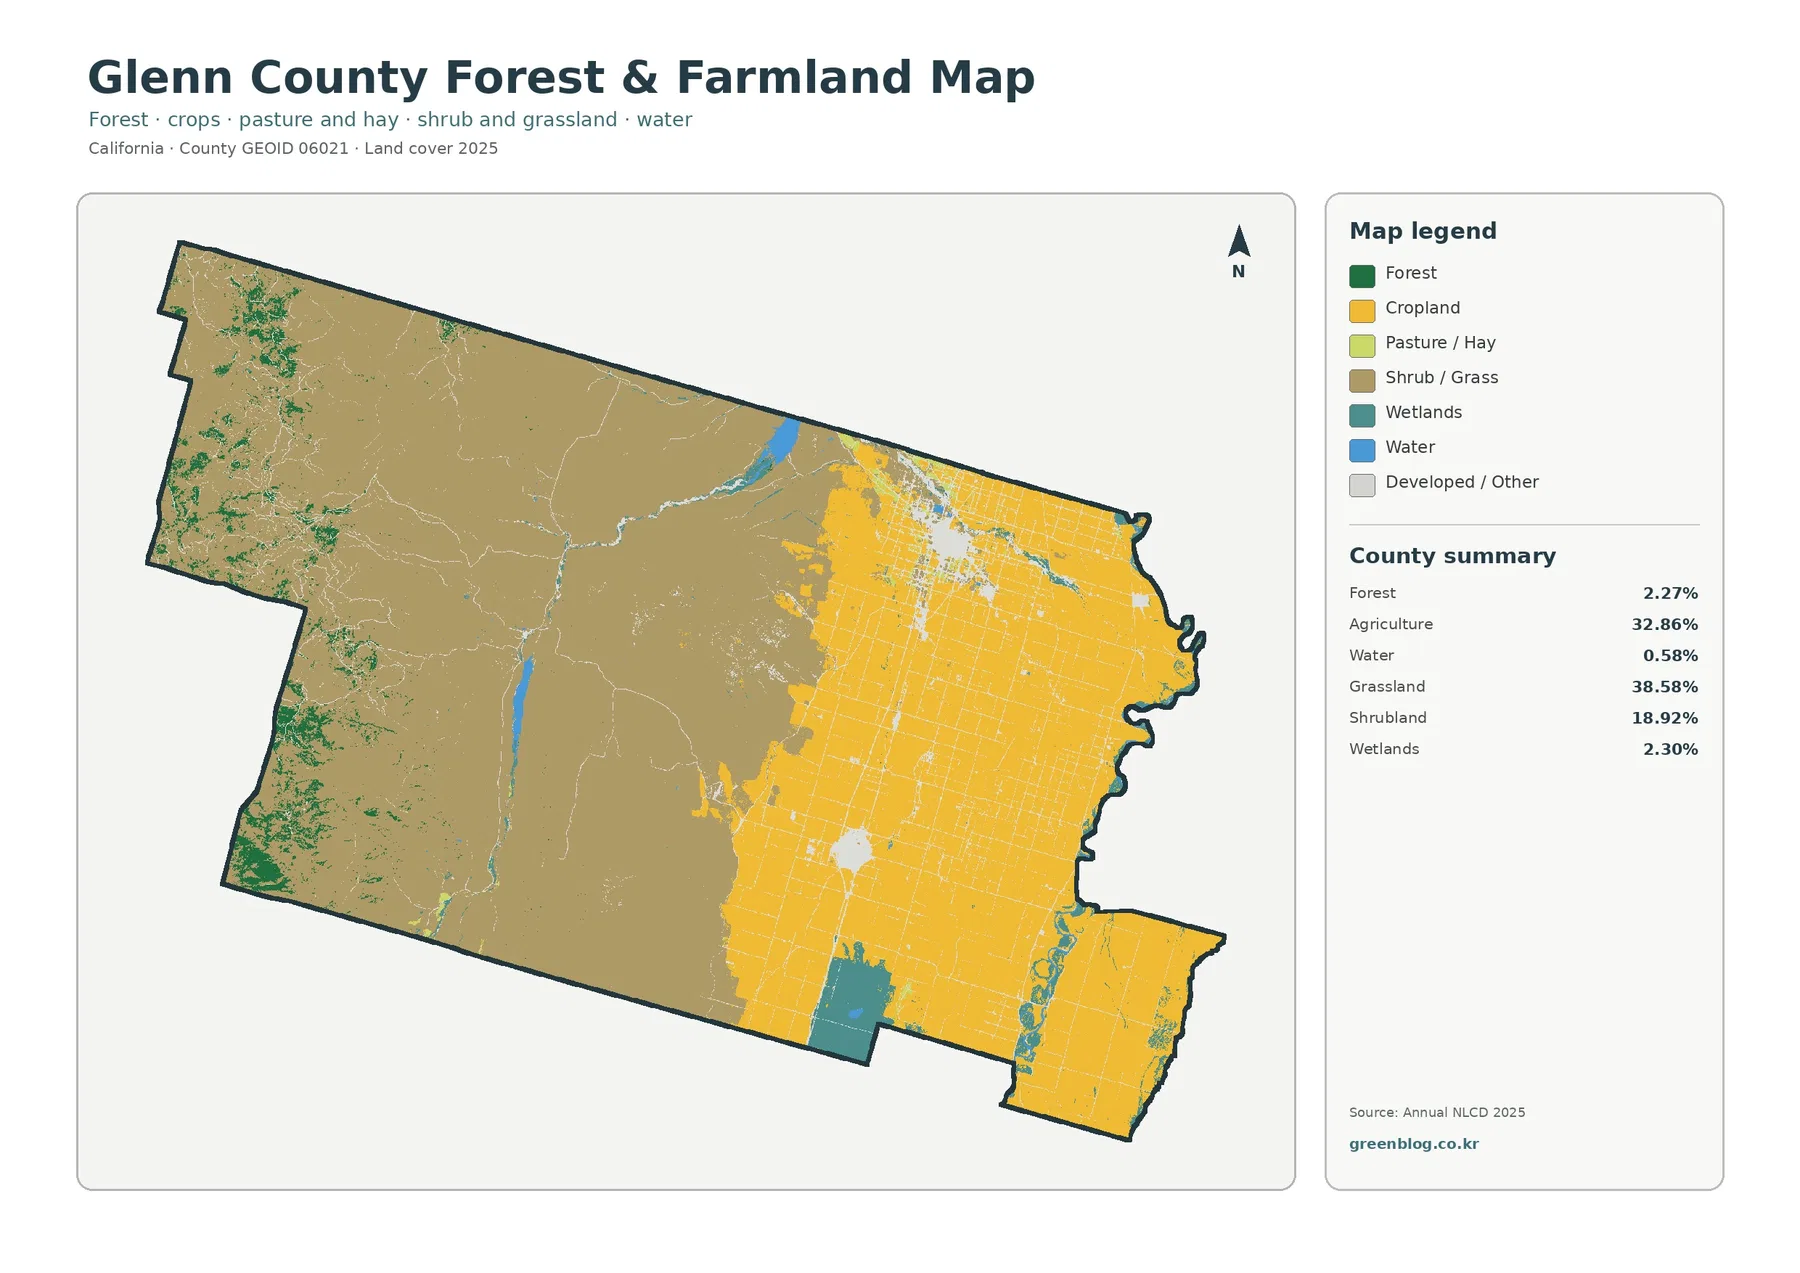
This view works especially well in lessons, slide decks, and reports that need a quick comparison between working farmland and open natural cover. The general map is better when developed classes, wetlands, barren ground, and other details must remain visible. Using the two maps together lets a reader move from a simplified landscape comparison to a more detailed class-by-class interpretation without changing the county outline.
Impervious surfaces reveal how compact the developed footprint is
Impervious surface means hard ground cover such as rooftops, pavement, and parking areas where water does not readily soak into the soil. Glenn County’s mean impervious surface is 1.13%, and only 0.57% of the county is mapped at 50% impervious or higher. Those values are lower than the 4.04% developed-cover share because a developed land-cover class can still include lawns, trees, exposed soil, and other permeable surfaces. The two measures describe development from different angles rather than duplicating one another.
The strongest impervious values are concentrated in two main valley centers. Glenn County RCD identifies Willows and Orland as the county’s two principal cities along Interstate 5, and the darkest concentrations on the map line up with that central I-5 settlement pattern. Smaller hard-surface traces extend beyond the city centers as thin lines and scattered spots. Across the broad agricultural area, however, most of the map remains very light compared with the concentrated urban patches.
The western uplands are also overwhelmingly light in the impervious map. Comparing that view with the general land-cover layer shows that the areas dominated by grass, shrub, and scattered forest generally coincide with low mapped hard-surface percentages. This is a useful spatial comparison, but it should not be turned into a claim that one cover type caused the other. The maps only show that the patterns occur in the same parts of the county.
Thin reddish lines across farmland indicate places where impervious values rise above the surrounding fields. At this scale, they can represent road and built-surface patterns, but the image does not name individual roads or facilities. The correct interpretation is that hard surfaces are more concentrated along certain narrow corridors and around settlements. Identifying a specific roadway, parcel, or structure requires a road map, aerial image, or local GIS layer.
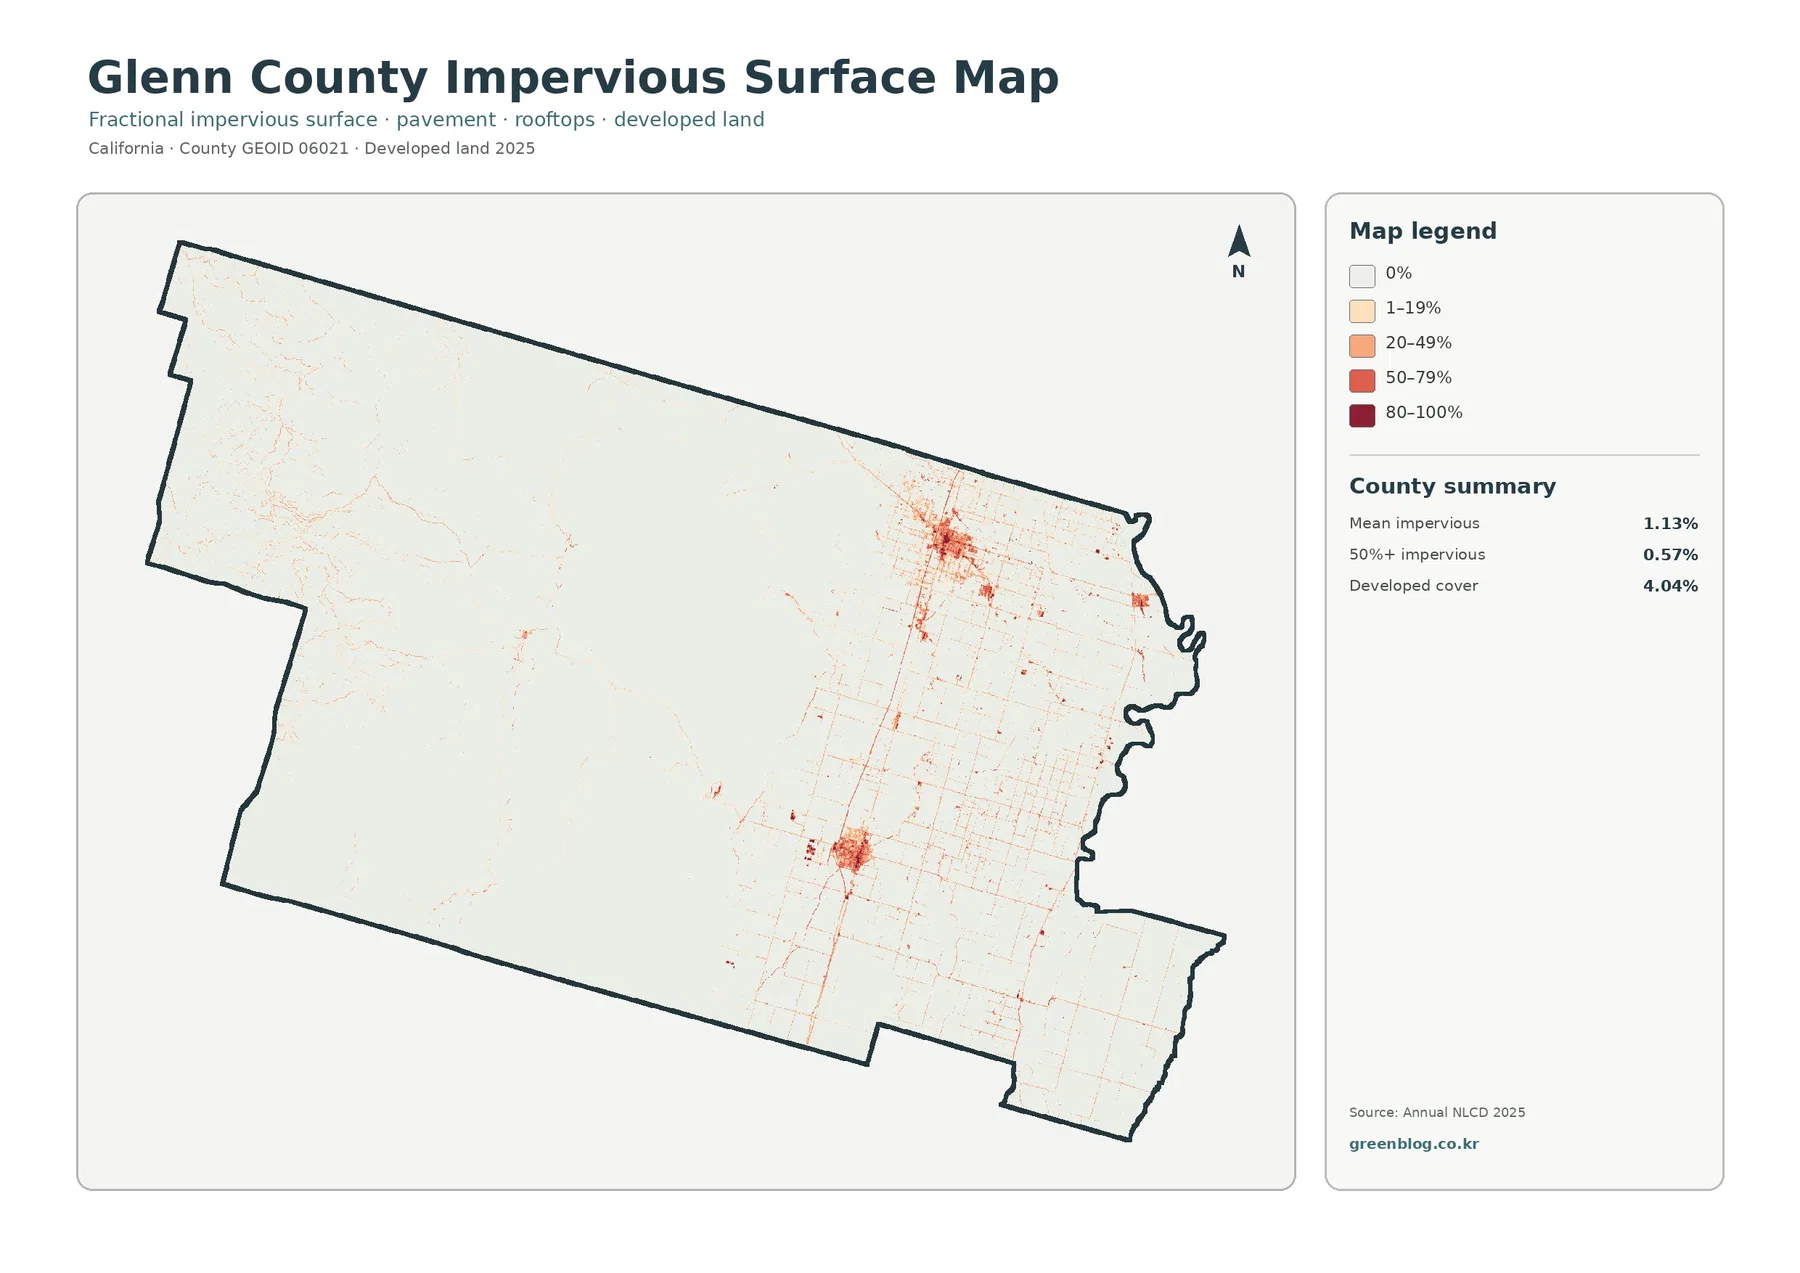
Impervious cover can be useful for watershed education and broad planning context because it identifies where hard surfaces are most concentrated. It does not, by itself, calculate runoff, flood risk, erosion, recharge, or drainage capacity. Those outcomes depend on rainfall, soils, slopes, channels, irrigation and drainage systems, and many other local conditions. The map is best used as a countywide screening and comparison layer before turning to more detailed hydrologic information.
Placing the 4.04% developed-cover figure next to the 1.13% mean impervious value also helps prevent a common misunderstanding. A neighborhood can be mapped as developed even if a large part of it remains permeable. For that reason, the general map is more useful for seeing the footprint of developed land, while the impervious map is more useful for comparing how much hard surface is present within and between developed areas.
What changed between the 1985 and 2025 classifications
The change map compares land-cover classes for 1985 and 2025. Its county summary reports that 25.37% of the area has a different mapped class between the two endpoints. The displayed categories include 10.23% forest loss, 13.02% other class difference, 1.17% classified as developed, and 0.66% agricultural loss. These numbers should be described as classification differences. They do not mean that one quarter of the county underwent one confirmed type of physical or human-caused transformation.
Orange forest-loss areas are most prominent across the western uplands. Looking back at the 2025 land-cover map, many of those locations now contain a mixture of grassland, shrubland, and smaller forest patches. The Glenn County RCD notes extensive recent wildfire impacts in the Mendocino National Forest portion of the county, which is relevant local context. Even so, the change layer cannot prove that every orange cell is a fire effect. Vegetation change, harvest, image timing, mixed pixels, and classification methods can also influence an endpoint comparison.
Purple other-class differences account for 13.02%, the largest named subtotal in the summary. Purple occurs in both western and valley locations, so it should not be treated as one single process. The category collects changes that are not placed in the specific developed, forest-loss, or agricultural-loss groups. A good follow-up is to compare the same place on the 2025 map and then consult intermediate-year imagery or a more detailed time series if the exact transition matters.
Red areas classified as developed account for 1.17%. They are most evident around the main valley communities and appear in smaller fragments elsewhere. Comparing those red change areas with the current impervious layer helps show where long-term class changes overlap today’s more pavement- and building-heavy surfaces. The percentage is not a building-permit total, annexation measure, or change in city limits; it is the share of raster cells whose endpoint classification falls into the developed-change category.
Agricultural loss is listed at 0.66%, a small share relative to the large 2025 agricultural footprint. Yellow change marks are scattered through parts of the valley rather than replacing the broad agricultural area. Fallow conditions, crop cycles, moisture, image date, and classification variation can all affect whether a pixel is placed in an agricultural class at a given endpoint. A question about actual farmland conversion should be answered with land-use and agricultural records, not this class-difference percentage alone.
The legend also includes wetland difference as a distinct teal category. Small teal areas can be seen near river and wetland locations, but the summary panel does not print a separate percentage for that category. Wetland appearance can vary with water level, vegetation, and season, so a two-year comparison is most useful for locating places that merit closer study. It should not replace a wetland inventory or hydrologic time series.
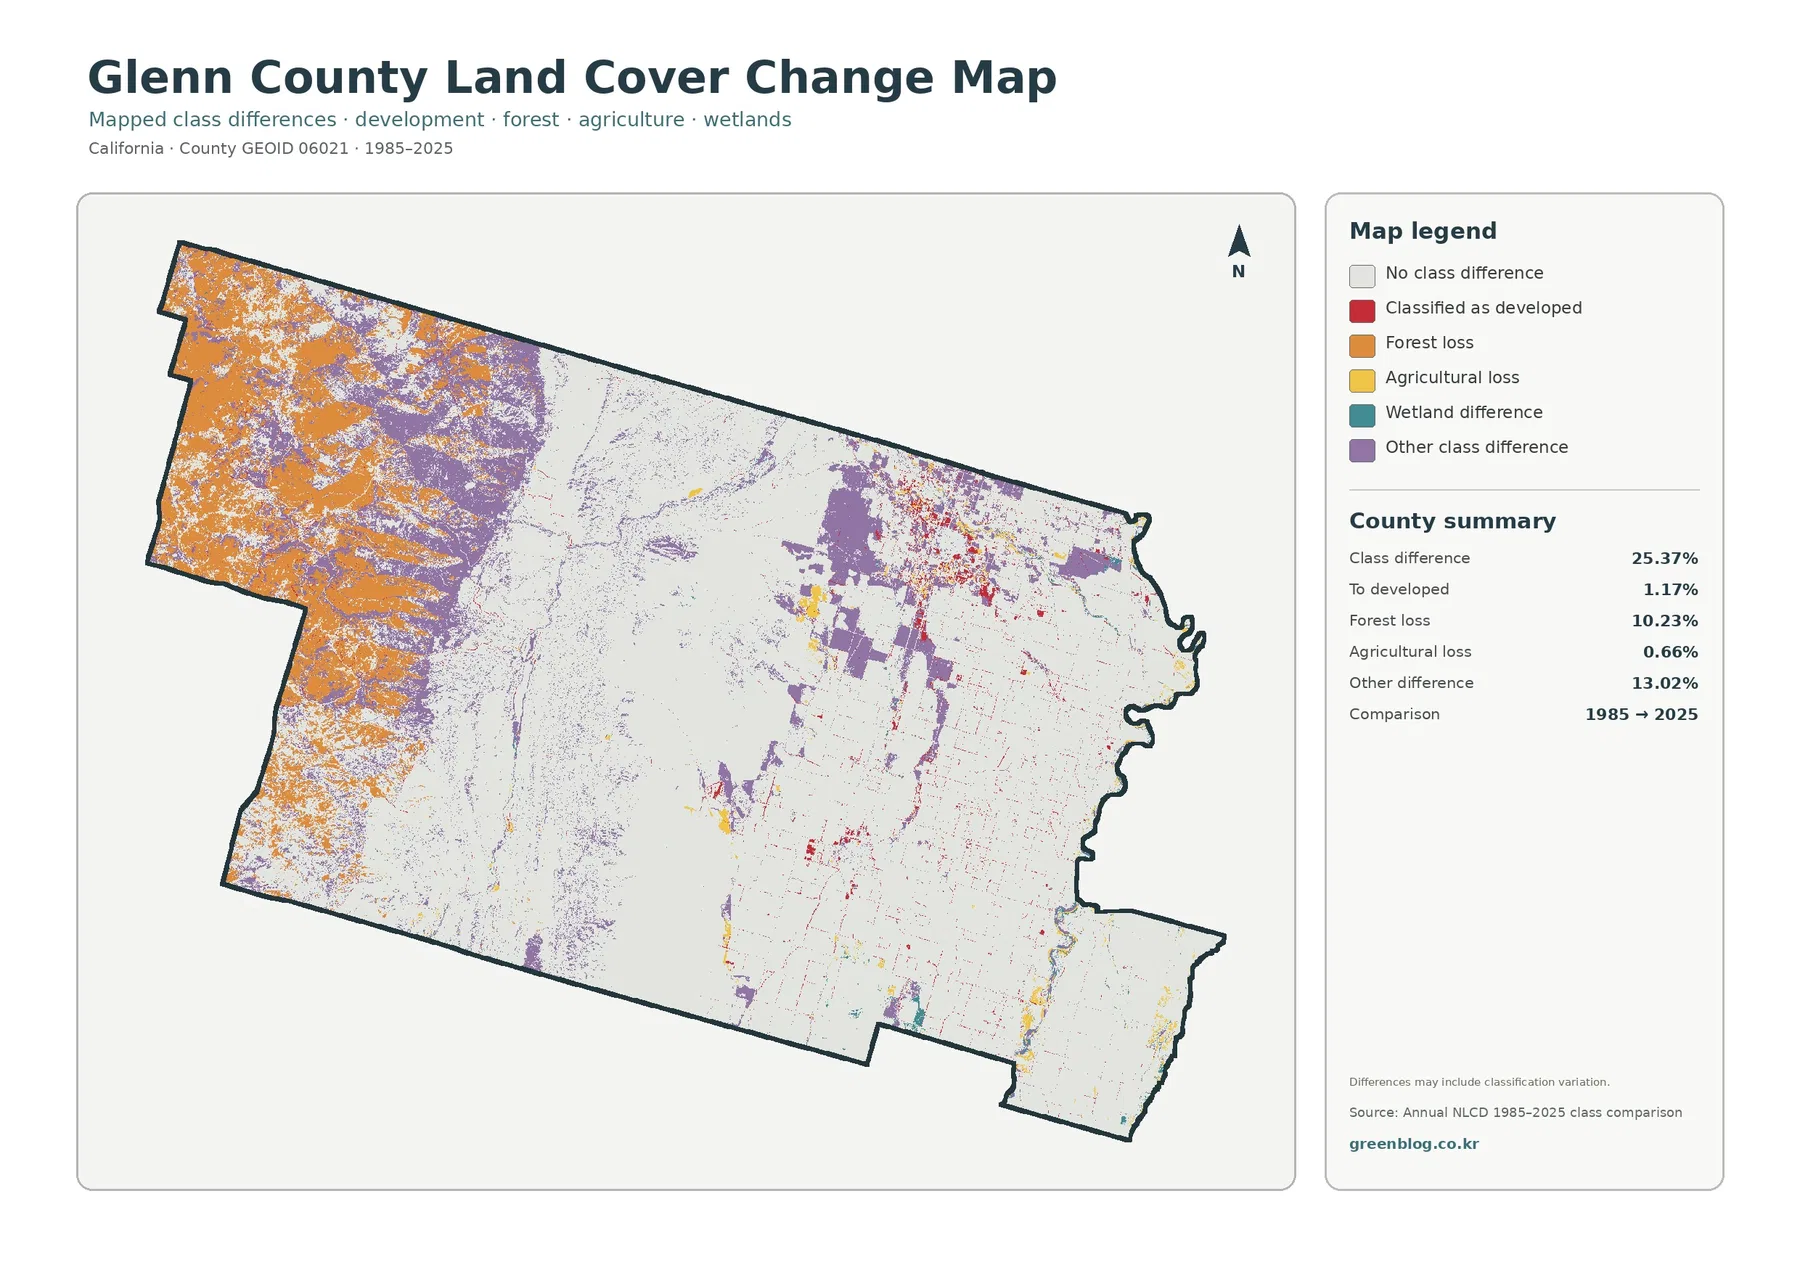
The safest reading rule is simple: treat the colors as evidence of where the two endpoint classifications differ, not as proof of why they differ. If a particular orange, red, yellow, teal, or purple area matters, compare it with the current land-cover and impervious maps first. Then add fire history, planning records, aerial imagery, agricultural data, or wetland information that is designed to address the suspected cause. That process preserves what the change map can tell you without asking it to answer a question it was not built to answer.
Choosing the right map for a report, lesson, or local comparison
For a broad overview, start with the general land-cover map because it preserves the widest range of classes. If the main question is the balance between farmland and open vegetation, the forest-and-farmland view is easier to explain. When the focus is the concentration of pavement and rooftops around communities, use the impervious map. The change layer belongs last because it is easiest to interpret after the reader already understands the 2025 landscape.
In environmental education, the set can be used to compare the Sacramento Valley agricultural side of the county with the western foothills and forest context. Wetlands and water can then be added as smaller but locally important features. For watershed or habitat discussions, these maps provide a countywide orientation, but detailed stream networks, species habitat, refuge boundaries, and jurisdictional wetlands should come from specialist datasets.
Planning users should also keep land cover separate from land use. A yellow agricultural pixel is not the same as an agricultural zoning designation, and a red developed pixel does not establish what future development is allowed. Glenn County’s General Plan addresses policy and land-use planning; the raster maps describe physical surface cover for particular observation years. Reading both can be valuable as long as their different purposes are kept explicit.
For printed graphics, keep the year, title, legend, and county summary attached to each image. This is especially important for the change map because several bright colors all represent different kinds of endpoint difference. If a presentation needs a close crop around Willows, Orland, the eastern valley, or the western uplands, include a small countywide locator view so the audience can see where the close-up sits within the larger west–east pattern.
Download the four original JPG maps
The WebP images on this page are optimized for quick viewing in a browser. The downloadable ZIP contains the original JPG versions of all four maps: 2025 general land cover, forest and farmland, impervious surface and developed land, and the 1985–2025 land-cover change comparison. Because all four share the same county outline, they can be placed side by side in presentations, handouts, research notes, and classroom materials without reconstructing the map set from separate sources.
Keep the map year with the file when it is reused. The present-day land-cover and impervious products are labeled 2025, while the change product compares 1985 with 2025. Later development, vegetation change, wildfire recovery, crop conditions, or water changes will not appear in a 2025 layer. Enlarging the JPG can make labels and symbols easier to see, but it does not create parcel-level or building-level geographic precision.
These files are reference maps rather than legal or engineering documents. They work well for countywide comparison, visual explanation, and identifying places that deserve closer investigation. Survey boundaries, parcel ownership, zoning, flood studies, detailed wetlands, and road engineering should be checked with the appropriate local or agency data instead of inferred from a 30-meter land-cover cell.
Scale, mixed pixels, and other limits to keep in mind
Annual NLCD-style land-cover products generalize the landscape into raster cells of roughly 30 meters. That scale supports consistent regional mapping, but small features can be simplified. Narrow roads, small buildings, field edges, channels, and mixed residential vegetation may occupy only part of a cell. A mixed pixel is simply a cell containing more than one real surface type even though the map must assign a representative class or impervious value.
County percentages such as 38.58% grassland and 32.86% agriculture are therefore best treated as summaries within the same classification system. They are useful for comparing the relative extent of major cover classes, not for measuring the boundary of an individual field or woodland. Small streams and wetland margins are especially sensitive to scale because they can be narrower than a raster cell or mixed with neighboring vegetation and soil.
Observation date matters just as much as cell size. A 2025 classification cannot show changes that happened after that year. The 1985–2025 map is also an endpoint comparison, so it can miss temporary changes that occurred between those dates and later returned to a similar class. When a current decision depends on recent conditions, the map should be paired with newer imagery or an annual time series.
The maps also do not identify ownership or legal status. Forest cover could be federal, state, local, or private; grassland does not automatically mean grazing land; agricultural cover does not define a farm parcel; and developed cover does not identify residential, commercial, industrial, or public use. The physical cover map and Glenn County planning documents can complement one another, but they should never be treated as interchangeable layers.
Used with those limits in mind, the set is valuable because Glenn County contains several strong landscape contrasts inside one boundary. Western grass and shrub cover, scattered forest, the central I-5 communities, eastern farmland, Sacramento River-side water and wetlands, and long-term class differences can all be compared without changing map extent. The result is a useful countywide reference for readers who want to understand the landscape before moving to more specialized GIS or local planning data.
Frequently Asked Questions
What is the largest 2025 land-cover class in Glenn County?
Grassland is the largest mapped class at 38.58%. Agriculture follows at 32.86%, with shrubland at 18.92%. The map places much of the grass and shrub cover in the western uplands and most of the agricultural cover across the central and eastern valley.
Why is developed cover 4.04% while mean impervious surface is only 1.13%?
Developed land is a broad cover class that can include lawns, trees, exposed soil, and other permeable surfaces along with buildings and pavement. The impervious layer measures hard surfaces more directly, so the countywide mean can be much lower than the developed-land share.
Does the 10.23% forest-loss category prove that wildfire removed that amount of forest?
No. The map compares 1985 and 2025 classifications. Fire may contribute to real vegetation change in some areas, but imagery conditions, mixed pixels, classification methods, harvest, and other vegetation changes can also affect the result. A specific cause requires additional evidence.
Map File Information
The ZIP contains the four original Glenn County JPG maps: 2025 general land cover, forest and farmland, impervious surface and developed land, and the 1985–2025 land-cover change comparison.
- Included Files: Use only the versions confirmed in the article and supplied images
- File Type: Use the confirmed download contents
- Intended Use: Printing, education, presentations, and map-based projects
Related Maps
- Alameda County California Land Cover Map
- Alpine County California Land Cover Map
- Amador County California Land Cover Map
Sources and references
Land-cover and impervious-surface classes can be checked through MRLC Annual NLCD Data and the USGS Annual NLCD Land Cover Classification. County boundary and FIPS information can be referenced through the U.S. Census Bureau TIGER/Line Shapefiles.
Local context comes from the Glenn County General Plan and the Glenn County Resource Conservation District Long Range Plan 2024–2028. Those sources discuss agriculture, communities, natural resources, and planning; their definitions and purposes are different from the satellite-based physical land-cover classification used in the maps.
Green Map creates custom-edited map images using open geographic data sources such as geoBoundaries, Natural Earth, OpenStreetMap, and government open data.
These maps are edited visual materials, not raw data files, and are provided for education, documents, presentations, and graphic reference.