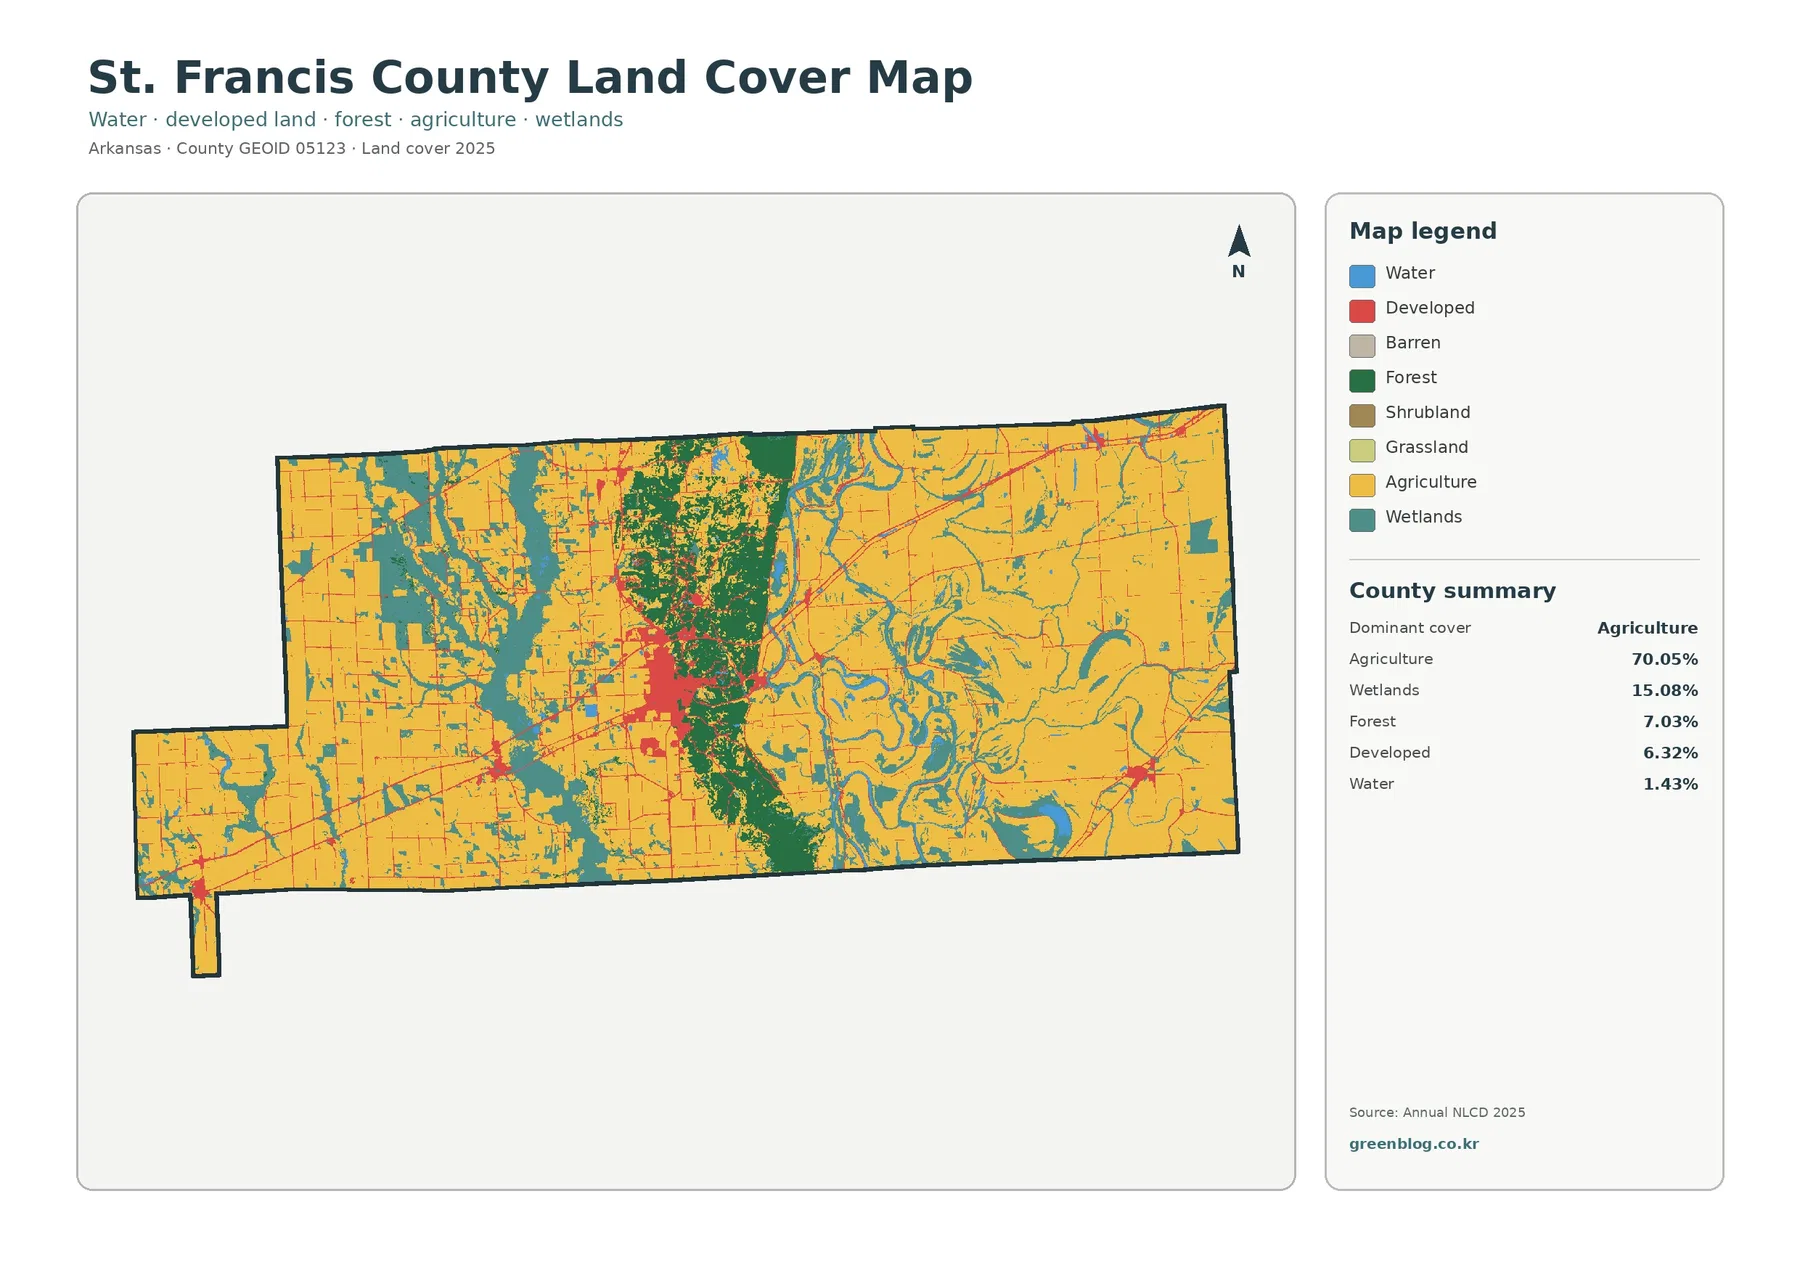
St. Francis County has one of the clearest farm–ridge–wetland contrasts in this Arkansas map set. Agriculture covers 70.05% in 2025, wetlands 15.08%, forest 7.03%, and developed land 6.32%. The largest built cluster sits near the middle of the county around Forrest City, while a north–south wooded band separates broad agricultural areas to the east and west.
Four map views make those patterns easier to separate: current land cover, forest and farmland, impervious surface/developed land, and the 1985–2025 class comparison. The WebP images below are page previews, and the four original JPG maps are available together in one ZIP download. These are surface-classification maps, not parcel, zoning, ownership, or property-boundary maps.
Table of Contents
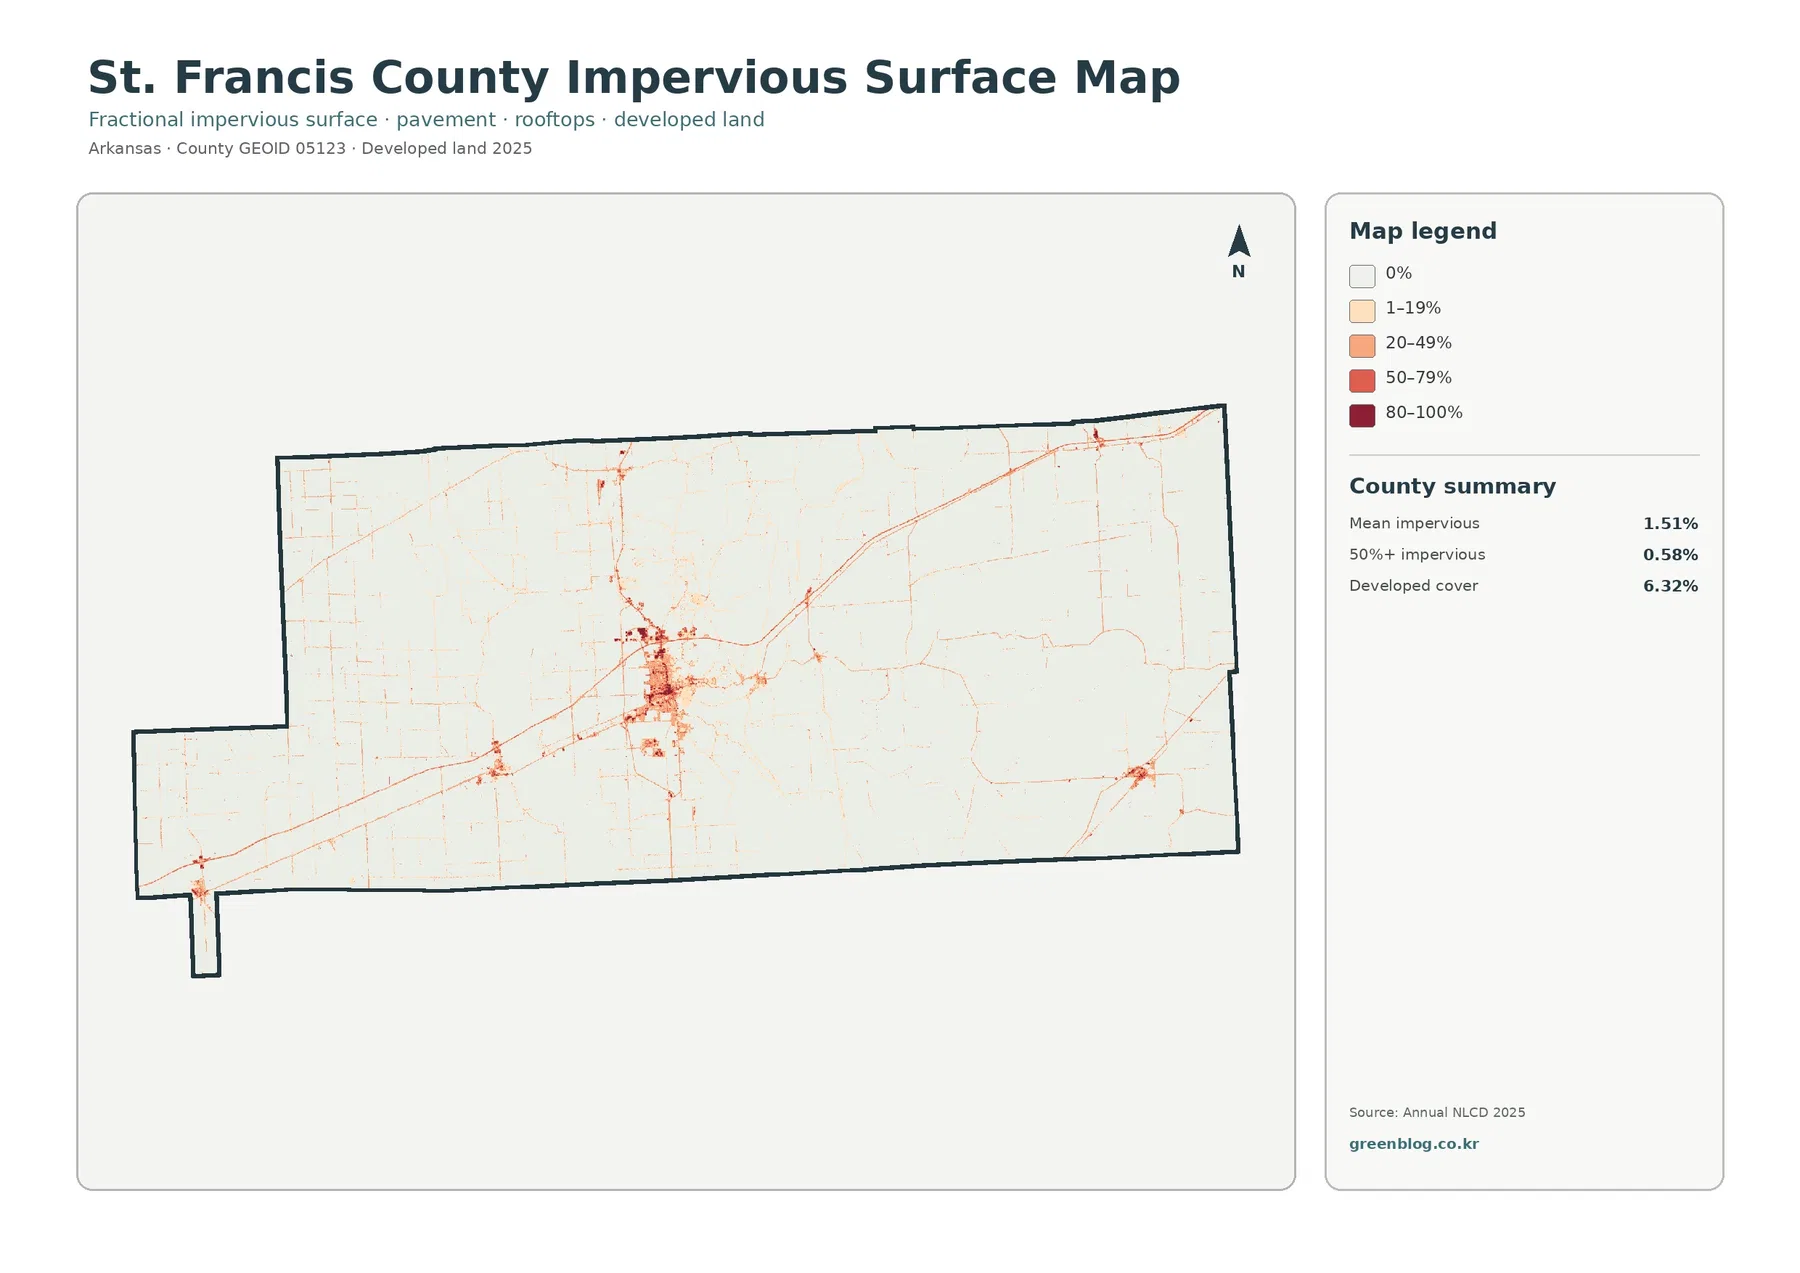
Forrest City is the county’s strongest hard-surface cluster, but impervious cover remains low overall
The impervious-surface map immediately separates the central urban area from the surrounding farm country. Most of St. Francis County is white or pale, while a concentrated orange and red patch appears near the county center. The county government website and the Association of Arkansas Counties identify Forrest City as the county seat, which places that main hard-surface concentration in a clear local context. Because the preview itself has no city labels, exact municipal limits should still be checked on an administrative map.
Mean imperviousness is 1.51%, and 0.58% of the county is mapped at 50% or greater impervious cover. Those values are much lower than the 6.32% developed-land share because a developed land-cover class can include lawns, trees, bare ground, and other permeable surfaces around roads and buildings. The two measures answer different questions: one classifies the surrounding cover, while the other estimates how much of the surface is physically hard.
Seventy percent agriculture fills both sides of a narrow wooded center
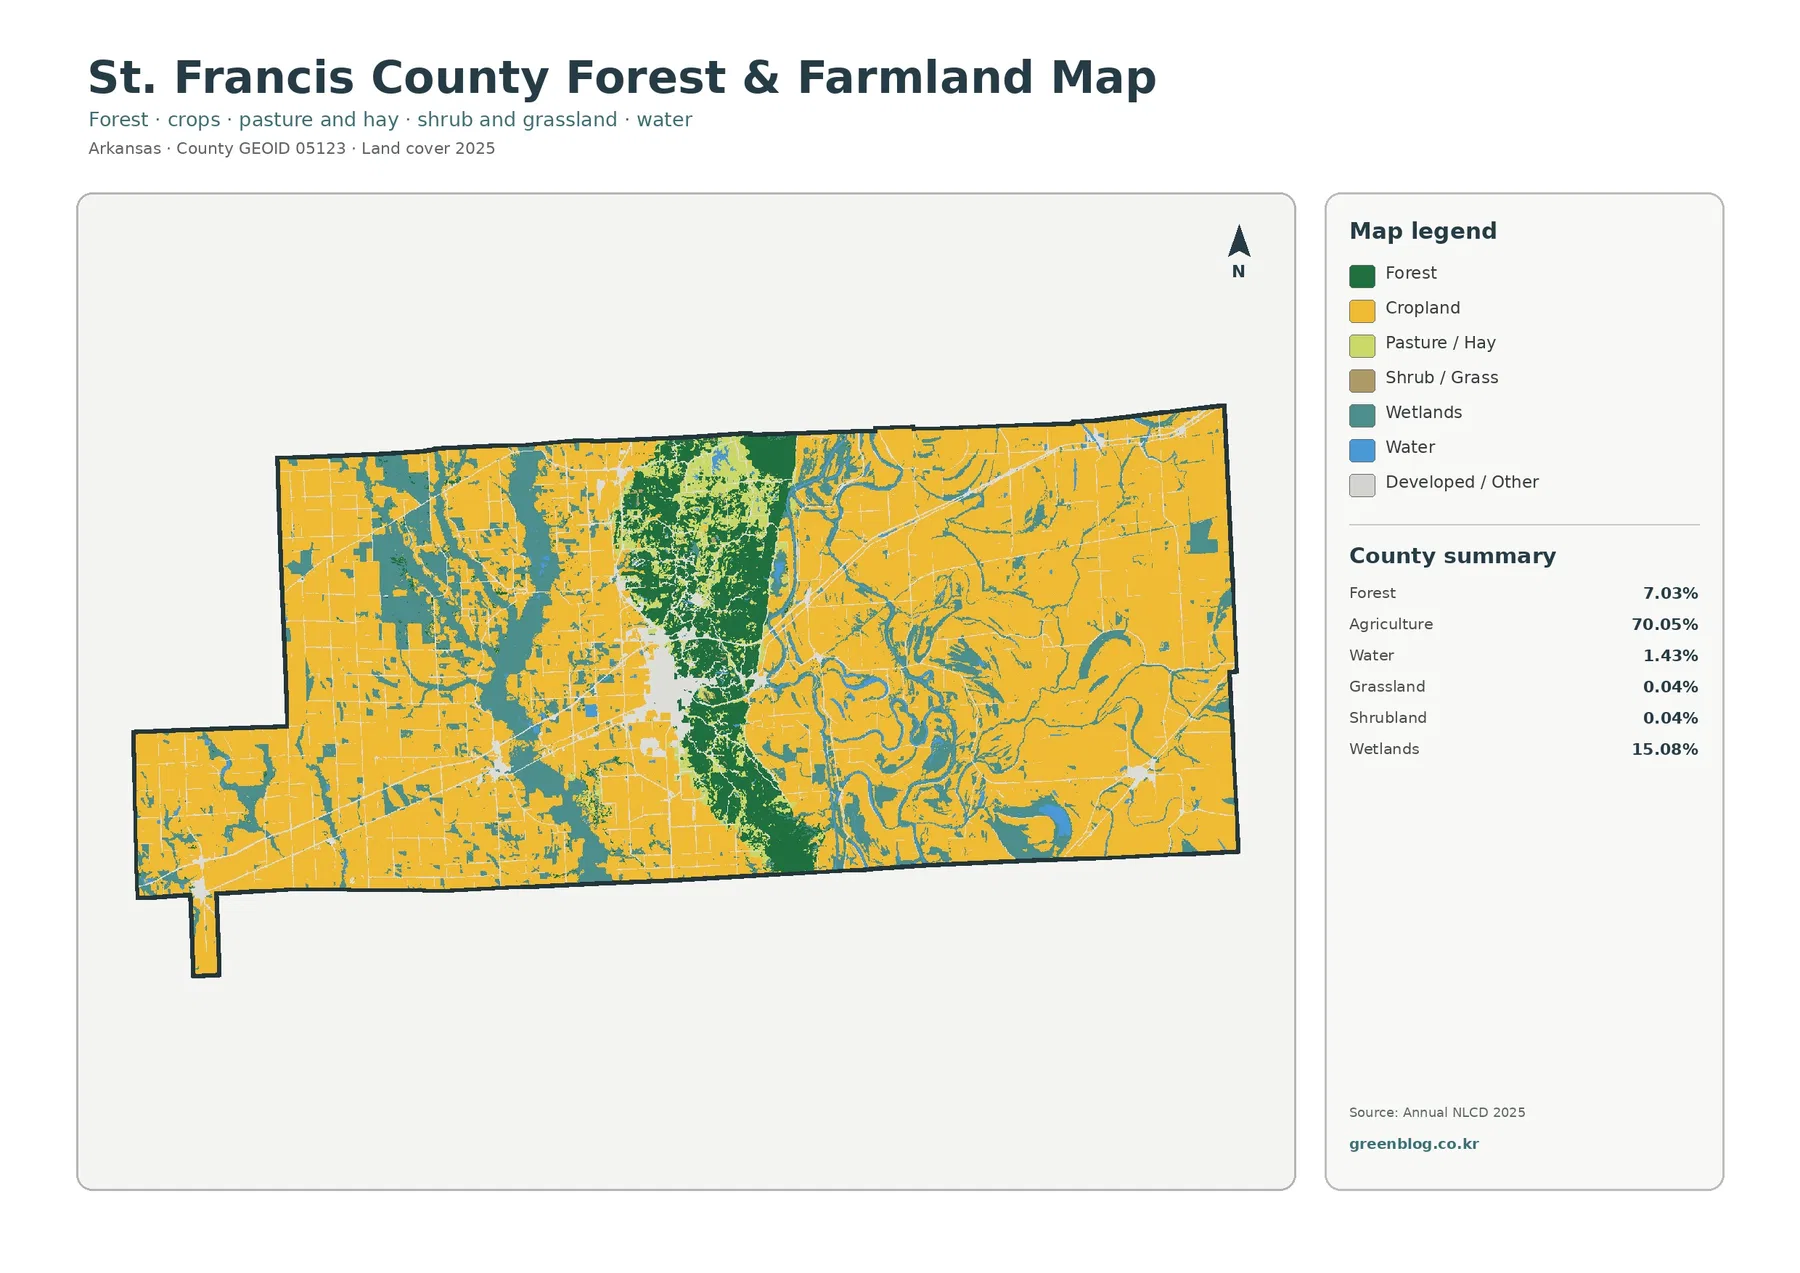
The general land-cover map is overwhelmingly agricultural. Yellow fields occupy most of the western half and an even larger share of the east, often in broad rectangular patterns that reflect the flat farm landscape. The Association of Arkansas Counties describes the eastern and western halves as rich, flat farmland. That county description closely matches the visible distribution, although the map does not identify crops, farm operators, or individual field boundaries.
A dark green band runs north to south through the center and interrupts the agricultural plain. The same county source notes that Crowley’s Ridge crosses St. Francis County and that rolling hills occur in the central part of the county. The preview does not draw the ridge boundary, so the green cells should not be treated as a precise Crowley’s Ridge polygon. Still, the wooded central corridor is one of the most distinctive map features and provides a useful visual link to the county’s known topographic setting.
Wetlands occupy 15.08%, weaving through farm fields and river corridors
The forest-and-farmland map makes the wetland pattern easier to notice because built classes are visually simplified. Teal wetland patches appear throughout the western farm landscape and become even more intricate in the east, where they follow winding channels and low-lying shapes between agricultural areas. At 15.08%, wetlands are not a minor accent. They form the second-largest mapped cover after agriculture and are essential to understanding why the county is not simply one uninterrupted field landscape.
The Association of Arkansas Counties states that the St. Francis River flows across the county. Since the preview has no waterway labels, no single blue or teal line should be assigned a river name without another map. The local fact is still useful for interpretation: St. Francis County includes a named river system within an agricultural landscape, and the supplied map shows extensive wetland and water features that need to be read as part of that broader hydrologic setting.
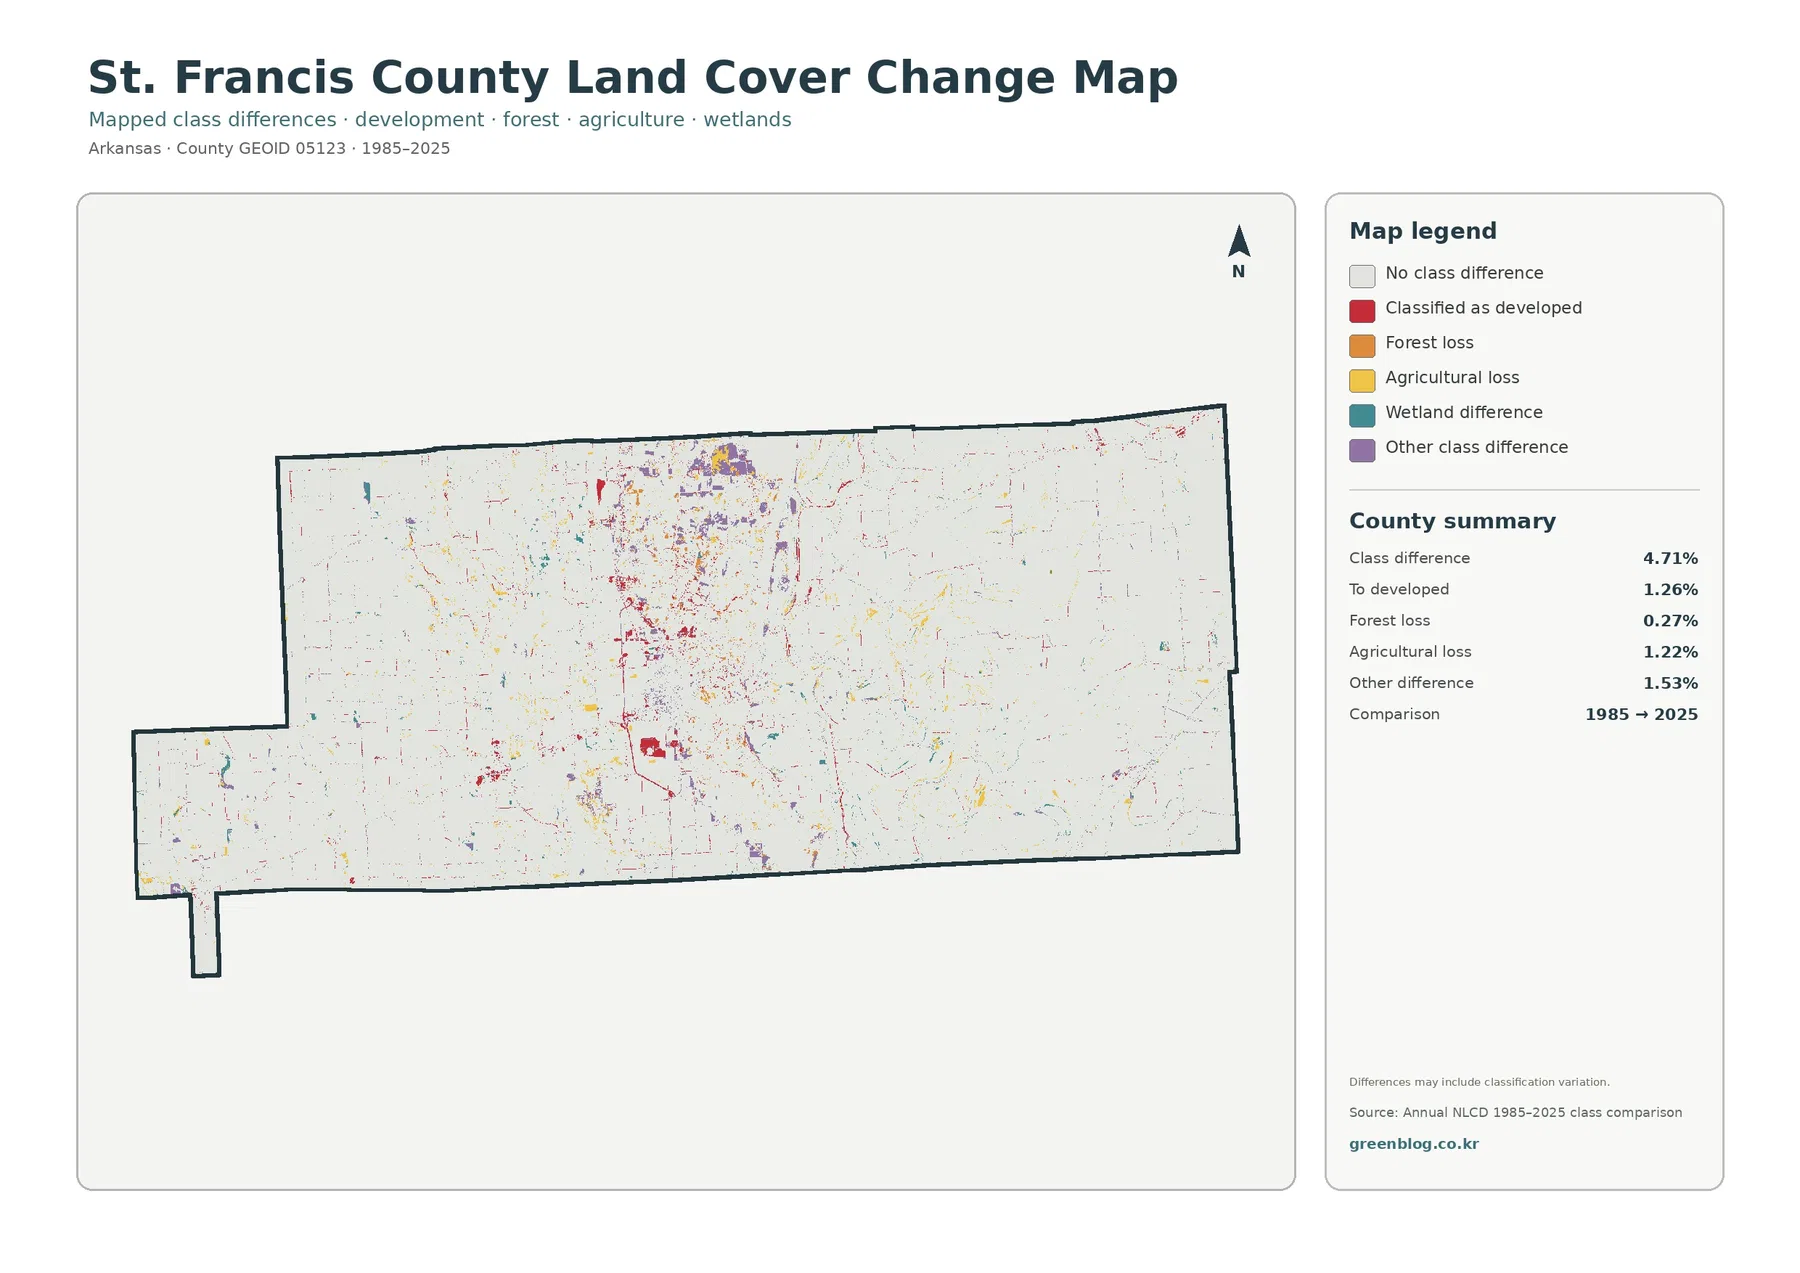
The 1985–2025 comparison is mostly stable, with class difference limited to 4.71%
Compared with counties that have widespread change colors, St. Francis County is mostly blank in the 1985–2025 comparison. The summary reports class difference across 4.71% of the county. Cells classified to developed account for 1.26%, agricultural loss for 1.22%, forest loss for 0.27%, and other class difference for 1.53%. Large areas of the agricultural plain remain in the no-class-difference background.
The most concentrated red change marks occur around the central developed area and along selected linear routes. Yellow agricultural-loss cells are scattered more broadly, while purple other-difference patches are particularly noticeable north of the central urban cluster and in a few smaller locations elsewhere. Forest-loss orange is present but sparse, consistent with the small 0.27% summary value. The pattern is mixed rather than dominated by one single transition.
A 4.71% class difference is not the same as a verified 4.71% land-use conversion. The map warns that classification variation can be included. Crop condition, water levels, soil moisture, image timing, and mixed surfaces inside a 30-meter cell can influence the assigned class. In a county with extensive agriculture and wetlands, those factors are especially relevant along field edges, drainage channels, and seasonally wet areas.
Each of the four maps answers a different St. Francis County question
Forrest City and the transportation network are better studied with the impervious layer. The countywide mean is low, yet the central cluster shows exactly where hard surfaces concentrate relative to fields and wetlands. The change map belongs last because it makes more sense after the reader knows the current cover. A red or yellow change cell is far easier to interpret when its surrounding 2025 landscape is already familiar.
Thirty-meter land-cover cells generalize field edges, drainage lines, and small built features
Annual NLCD is commonly distributed as a 30-meter raster. A single cell can contain crop rows, a ditch, trees, pavement, and water but still receive one dominant classification. In St. Francis County, this matters along the many field boundaries, wetland edges, narrow channels, and the forest–farm transition near the central ridge. Small features can look wider, narrower, or disappear into a neighboring class.
The current views use the supplied 2025 classification, while the comparison spans 1985 to 2025. Construction, field conversion, drainage changes, vegetation recovery, or wetland change after 2025 may not appear here. When a current site-level answer is needed, check for newer Annual NLCD products and compare them with recent aerial photography and local records. That extra step is especially important in an agricultural county where seasonal surface conditions can change quickly.
Frequently Asked Questions
Why is St. Francis County so strongly agricultural on the 2025 map
Agriculture is the dominant class at 70.05%. County sources describe the eastern and western halves as rich, flat farmland, and the supplied map shows broad agricultural cover on both sides of the central wooded corridor. The map does not identify individual crops or farm ownership.
What is the wooded north–south band through the middle of the county
The forest class totals 7.03% and is unusually concentrated through the center. The Association of Arkansas Counties notes that Crowley’s Ridge crosses St. Francis County and that rolling hills occupy the central area. The preview does not map the exact ridge boundary, so a topographic map should be used for precise limits.
Which map best shows Forrest City and the main developed corridors
The impervious-surface map is the clearest choice. Mean imperviousness is 1.51%, and 0.58% of the county is mapped at 50% or greater impervious cover. The strongest concentration is in the central Forrest City area, with thinner hard-surface traces extending along transportation routes.
Sources and reference material
- MRLC Annual NLCD Data – 2025 and annual land-cover dataset reference
- USGS Annual NLCD Land Cover Classification – land-cover classes and 30-meter classification guidance
- U.S. Census Bureau TIGER/Line Shapefiles – St. Francis County boundary reference
- St. Francis County, Arkansas Official Website – county government information in Forrest City
- Association of Arkansas Counties – St. Francis County – flat farmland, central rolling hills, Crowley’s Ridge, St. Francis River, and Forrest City context
- University of Arkansas System Cooperative Extension – St. Francis County – local agriculture and community Extension reference in Forrest City
Map File Information
The four original St. Francis County JPG maps are packaged in one ZIP: general land cover, forest and farmland, impervious surface/developed land, and the 1985–2025 change map. The files are larger than the page previews and are useful for printing, classroom reference, presentations, and county-to-county comparison.
- Included Files: Use only the versions confirmed in the article and supplied images
- File Type: Use the confirmed download contents
- Intended Use: Printing, education, presentations, and map-based projects
Related Maps
- A Craighead County Arkansas Land Cover Map
- Arkansas County Arkansas Land Cover Map
- Ashley County Arkansas Land Cover Map
Green Map creates custom-edited map images using open geographic data sources such as geoBoundaries, Natural Earth, OpenStreetMap, and government open data.
These maps are edited visual materials, not raw data files, and are provided for education, documents, presentations, and graphic reference.