Sebastian County is one of the more varied land-cover counties in this Arkansas map series. Forest is the largest 2025 class at 44.36%, but agriculture follows at 30.53% and developed land reaches 16.39%. The northwest contains a broad urban footprint around Fort Smith, while forest and agricultural cover become much more prominent toward the central, eastern, and southern parts of the county. Water and wetlands also appear along the northern edge and in smaller interior areas, so no single color describes the county well.
Four maps are included on this page: current land cover, forest and farmland, impervious surface/developed land, and the 1985–2025 class comparison. WebP previews make the patterns easy to inspect on screen, and the four original JPG maps are available together in one ZIP download below. These are land-cover products, not parcel or zoning maps; they describe classified surface cover rather than ownership, legal land use, or building rights.
Table of Contents
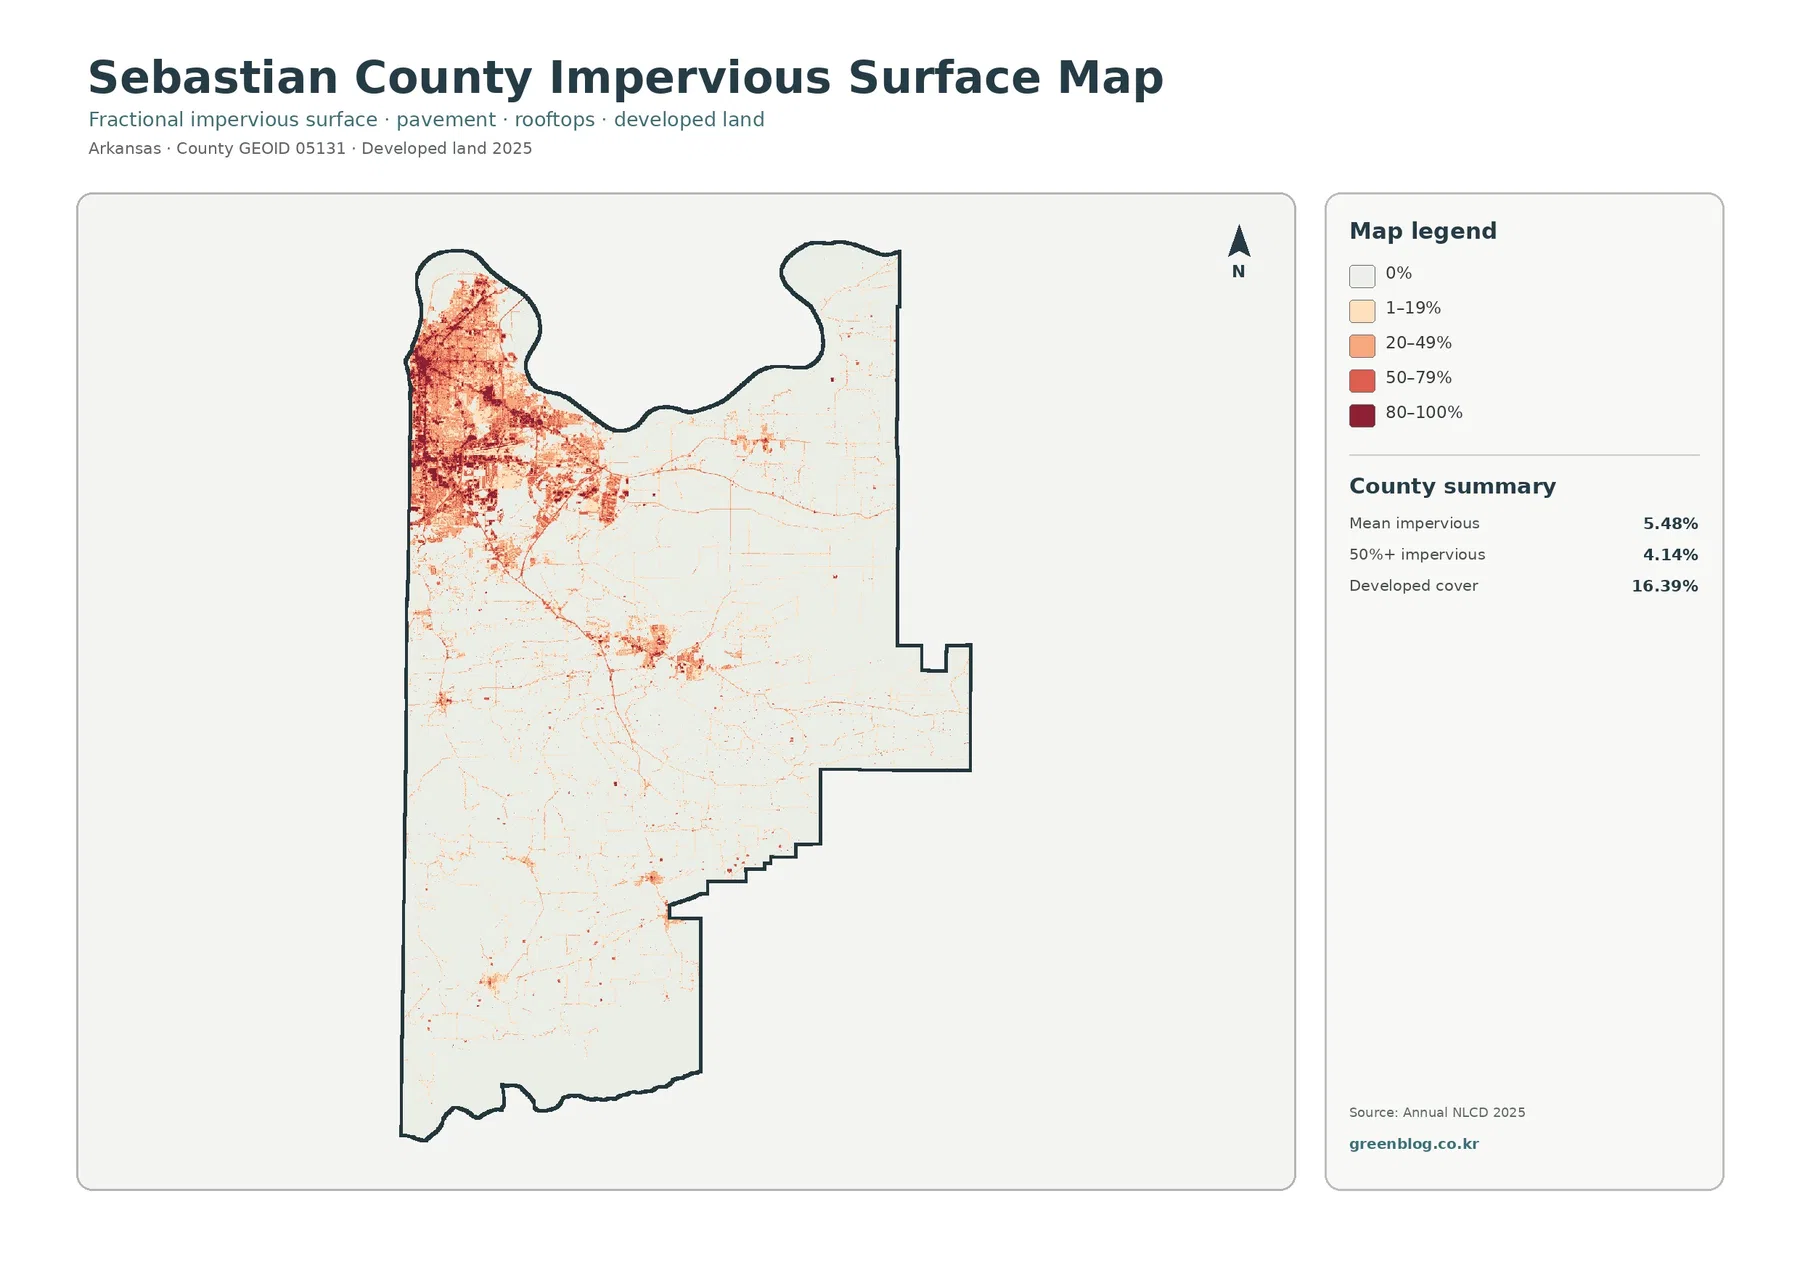
The hard-surface map makes Sebastian County’s two-center development pattern easier to see
The impervious-surface view is a useful starting point in Sebastian County because the contrast is strong. Mean imperviousness is 5.48%, and 4.14% of the county is mapped at 50% or greater imperviousness. The deepest reds form a large concentration in the northwest, where Fort Smith is located. The pattern spreads through a dense network of streets and built areas, then fades toward the county interior. A second, smaller concentration appears southeast of the main Fort Smith cluster, while thin developed traces continue along several corridors.
Developed land covers 16.39% in the general land-cover classification, considerably more than the 5.48% countywide mean impervious value. That difference is expected. A developed land-cover cell can include lawn, trees, bare ground, and other permeable surfaces mixed with roads and buildings, while the impervious layer measures the fraction of hard surface. In other words, the developed class answers where built environments are present, while the impervious layer shows how strongly pavement and rooftops dominate each cell.
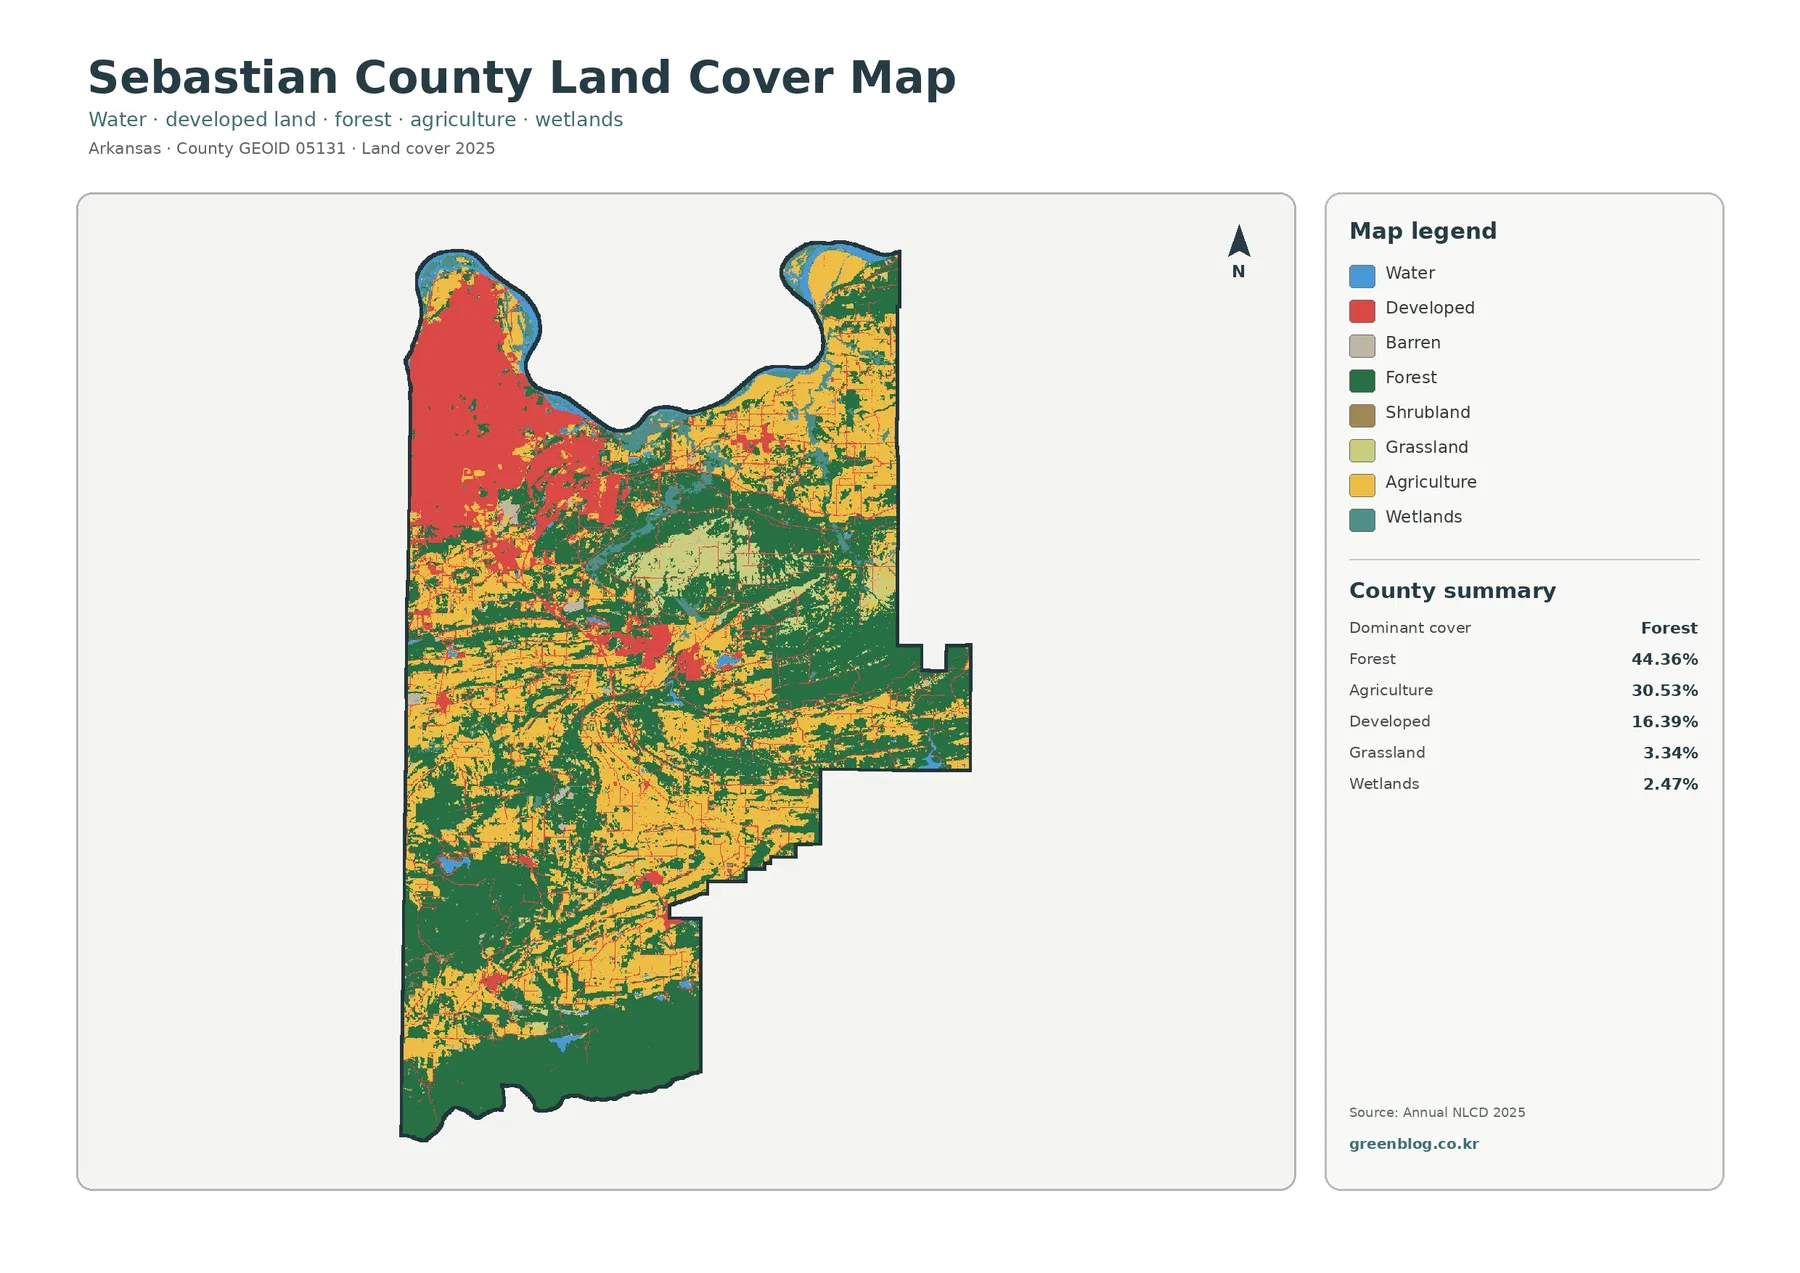
Current land cover shifts from the Fort Smith urban area to mixed farms and broad forest blocks
The general 2025 land-cover map puts the urban pattern back into the wider landscape. Developed cover dominates much of the northwest, but it quickly gives way to a mixture of agriculture and forest across the county interior. Forest accounts for 44.36%, the largest single class. Large green areas are especially noticeable across the south and east, with additional connected woodland through central areas. Agriculture covers 30.53% and forms broad yellow fields and irregular strips between those forest blocks.
The Encyclopedia of Arkansas places Sebastian County along Arkansas’s western border in the Arkansas Valley. It states that the Arkansas River forms the northern border and that the southern edge reaches the Ouachita Mountains. Those facts fit the broad map pattern without requiring the land-cover image to serve as a terrain map. Blue and wetland colors follow parts of the north, while the south contains extensive forest. Elevation and slope are not encoded here, so a separate topographic or elevation map is still needed to analyze land cover against terrain in detail.
Removing most urban detail reveals how farmland and forest share the rural part of the county
The forest-and-farmland map changes the emphasis. Developed and other surfaces are subdued, so the 44.36% forest share and 30.53% agricultural share become easier to compare directly. Forest appears in large connected blocks in the southeast and southern end of the county, as well as across portions of the center. Agricultural cover appears as wide yellow zones in the northeast and as long, broken bands through the central and southern rural landscape.
Southern Sebastian County is also locally distinct. The Encyclopedia of Arkansas notes that the county’s southern border reaches the Ouachita Mountains and identifies Mansfield in southern Sebastian County as a timber-related local center on the edge of the Ouachita National Forest. The map does not label timber operations or forest ownership, so those facts should not be assigned to individual green cells. They do, however, help explain why the substantial southern forest is a meaningful county-specific feature rather than generic background.
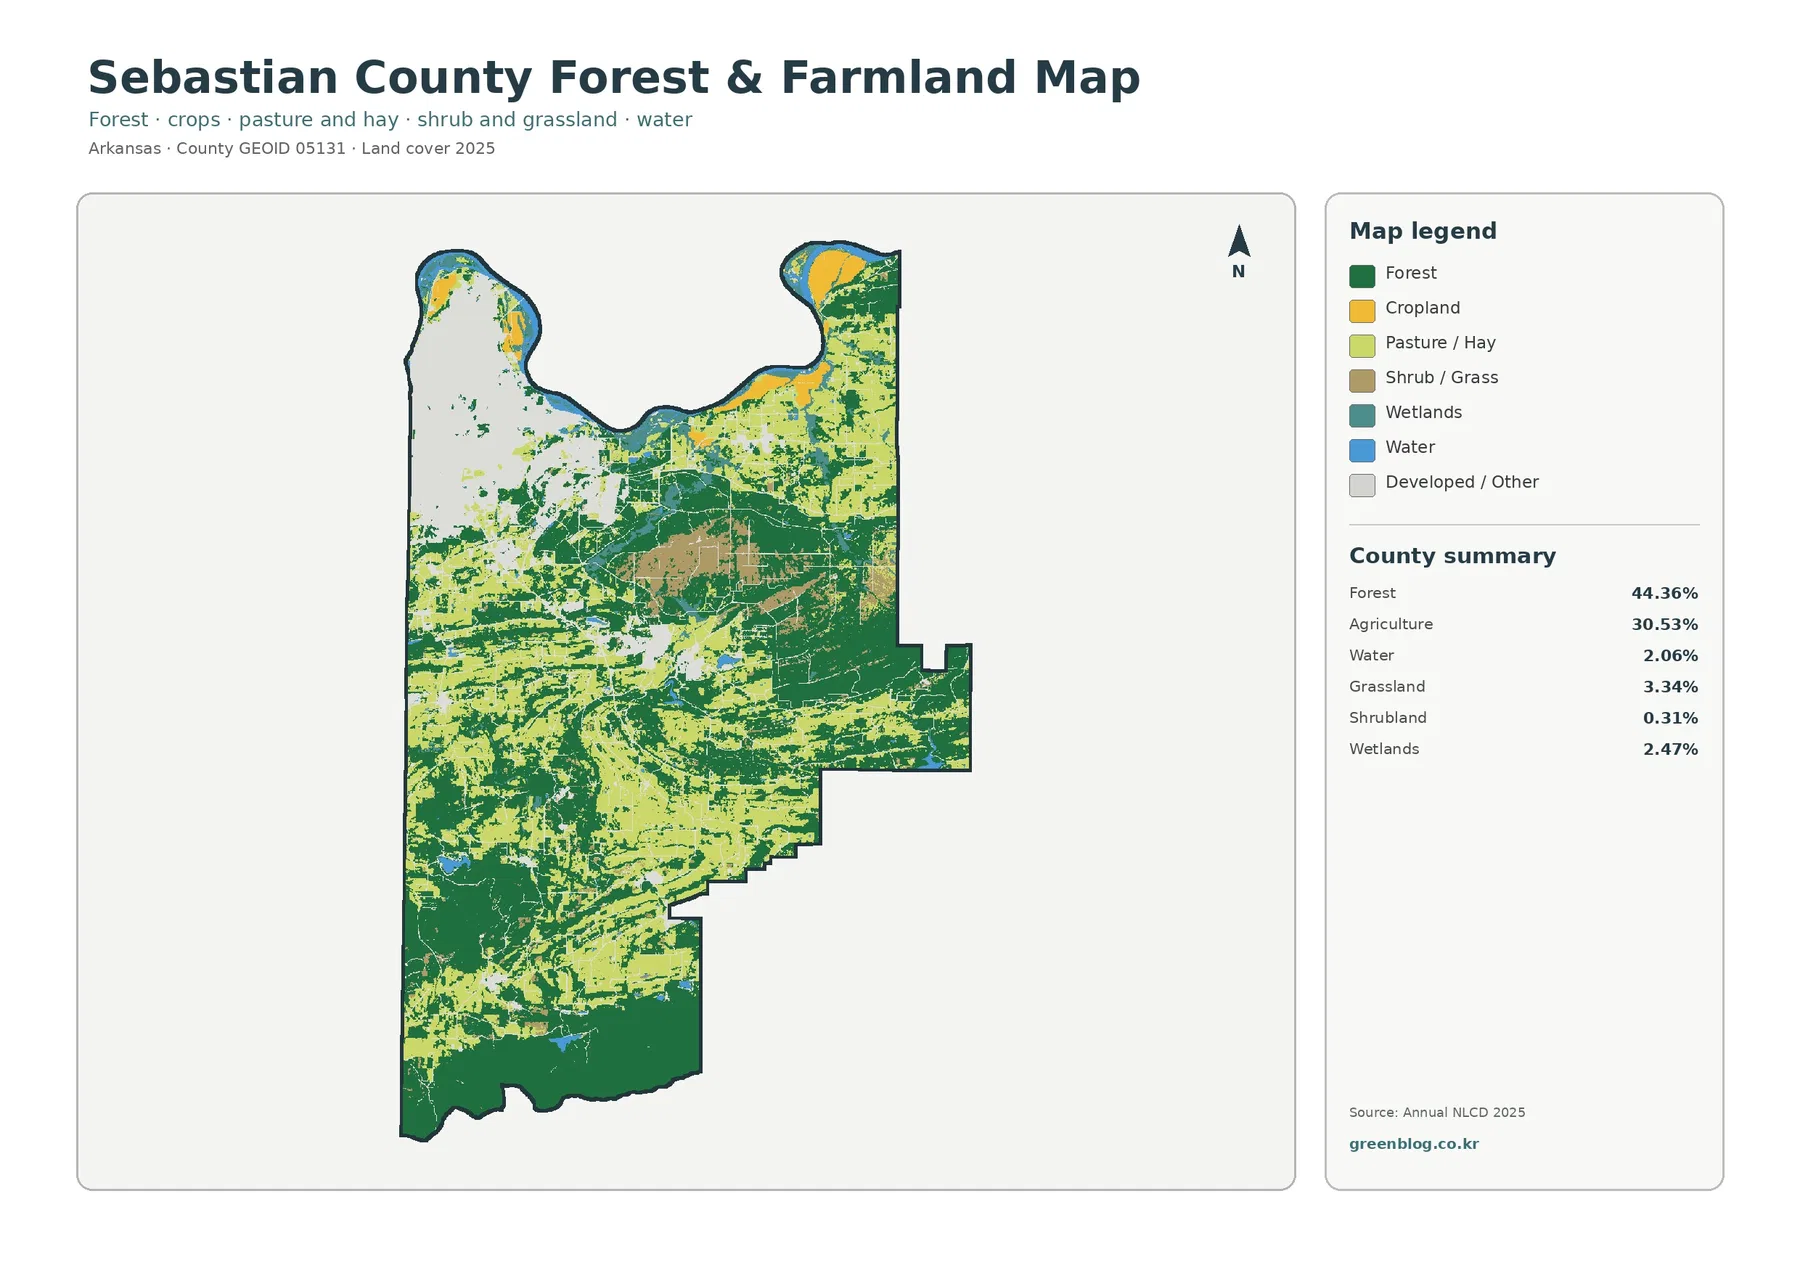
The northern river edge and the Fort Smith footprint create a sharp contrast within a short distance
Sebastian County’s northern edge deserves separate attention because several map classes meet there. The Arkansas River forms the county’s northern boundary according to the Encyclopedia of Arkansas, and the map shows blue water and teal wetland colors along parts of that edge. In the northwest, those river-side colors sit directly beside the county’s largest developed area. This creates a compact transition from water and wetland to dense urban land and then to agriculture and forest farther inland.
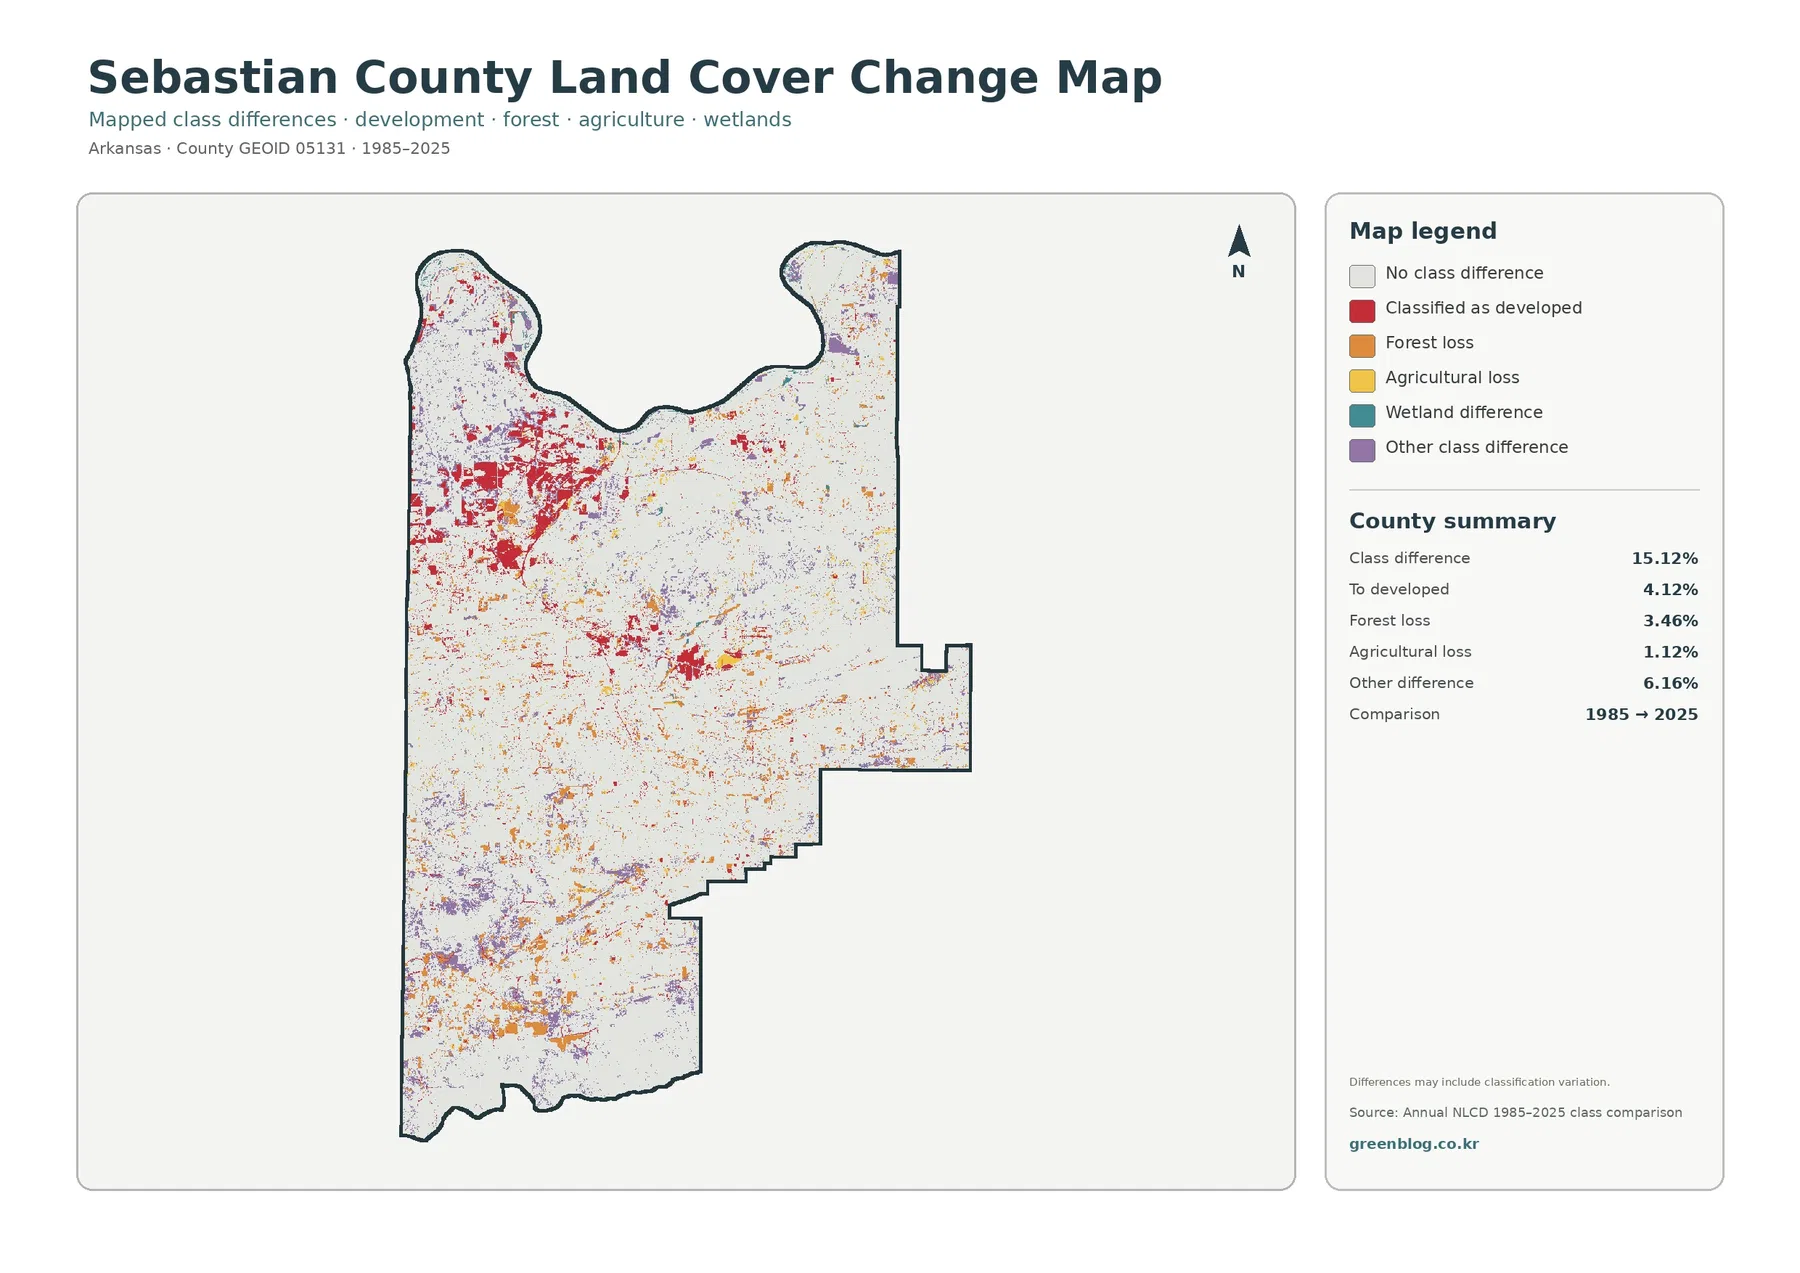
The 1985–2025 comparison records 15.12% class difference, with several change categories overlapping the county’s mixed landscape
The change map compares broad classes from 1985 and 2025 and reports class difference across 15.12% of Sebastian County. Cells classified to developed account for 4.12%. Forest-loss cells account for 3.46%, agricultural loss for 1.12%, and other class difference for 6.16%. Most of the county still remains in the no-class-difference background, but the colored cells are spread across enough locations to show that the two dates do not match everywhere.
The map does not say that every colored cell represents a permanent land-use conversion. Its legend notes that differences can include classification variation. Seasonal vegetation, moisture, image conditions, mixed pixels, and changes in classification behavior can all influence whether a 30-meter cell receives the same label in two years. Forest edges, farm boundaries, wet ground, and the transition around developed areas are particularly likely to contain mixed surfaces.
Raster scale and classification limits matter most along roads, river edges, and mixed rural boundaries
Annual NLCD is commonly organized as 30-meter raster cells. At that scale, a single cell can contain trees, pavement, lawn, a building, bare ground, or water in different proportions but still receive one land-cover class. The impervious product can describe the hard-surface fraction, yet it is still generalized at the raster scale. Large patterns such as the Fort Smith urban footprint are clear, while small driveways, narrow streams, individual houses, and property lines are not.
Frequently Asked Questions
Why is developed land 16.39% while mean impervious surface is only 5.48% in Sebastian County?
A developed land-cover cell can include lawns, trees, bare soil, and other permeable surfaces around roads and buildings. The impervious layer measures the hard-surface fraction, so its countywide mean is expected to be lower than the developed land-cover share.
Which map best separates the Fort Smith and Greenwood development centers?
The impervious-surface map provides the clearest contrast. The large northwest hard-surface cluster corresponds to the Fort Smith area, while a smaller separate center is visible farther southeast. Exact municipal boundaries should still be checked with official boundary data.
Does the 15.12% 1985–2025 class difference equal a land-use conversion rate?
No. It measures cells whose broad land-cover class differs between the two mapped dates. Real surface change can contribute, but seasonal conditions, mixed pixels, imagery, and classification variation can also create differences, so it is not a parcel-level or legal land-use conversion rate.
Sources and reference material
- MRLC Annual NLCD Data – 2025 and annual land-cover data reference
- USGS Annual NLCD Land Cover Classification – land-cover class definitions and interpretation
- U.S. Census Bureau TIGER/Line Shapefiles – Sebastian County boundary reference
- Sebastian County Government – Fort Smith and Greenwood courthouse/county-office context
- Encyclopedia of Arkansas – Sebastian County – Arkansas River, Arkansas Valley, Ouachita Mountains, Fort Smith and Greenwood context
Map File Information
The four original Sebastian County JPG maps are packaged in one ZIP file. The set includes general land cover, forest and farmland, impervious surface/developed land, and the 1985–2025 land-cover comparison so the same county boundary can be reviewed across all four views.
- Included Files: Use only the versions confirmed in the article and supplied images
- File Type: Use the confirmed download contents
- Intended Use: Printing, education, presentations, and map-based projects
Related Maps
- A Craighead County Arkansas Land Cover Map
- Arkansas County Arkansas Land Cover Map
- Ashley County Arkansas Land Cover Map
Green Map creates custom-edited map images using open geographic data sources such as geoBoundaries, Natural Earth, OpenStreetMap, and government open data.
These maps are edited visual materials, not raw data files, and are provided for education, documents, presentations, and graphic reference.