Poinsett County is overwhelmingly agricultural in the 2025 land-cover summary, but the map is not visually uniform. Agriculture accounts for 79.19% of the county, while wetlands make up 10.52%, developed cover 4.95%, forest 3.53%, and water 1.54%. The feature that breaks up the broad farm landscape is a narrow wooded band running through the middle of the county. That band follows Crowley’s Ridge, separating low, farm-dominated areas on either side.
Four views on this page make that pattern easier to separate: current land cover, forest and farmland, impervious surface/developed land, and the 1985–2025 land-cover comparison. The web images are previews, and the four original JPG maps are available together in one ZIP download below. They can be used separately when the goal is to emphasize agriculture, wetland areas, settlement footprints, or long-term classification differences without putting every theme on one crowded figure.
Table of Contents
Start with the farm-dominated 2025 landscape, then look for the exceptions
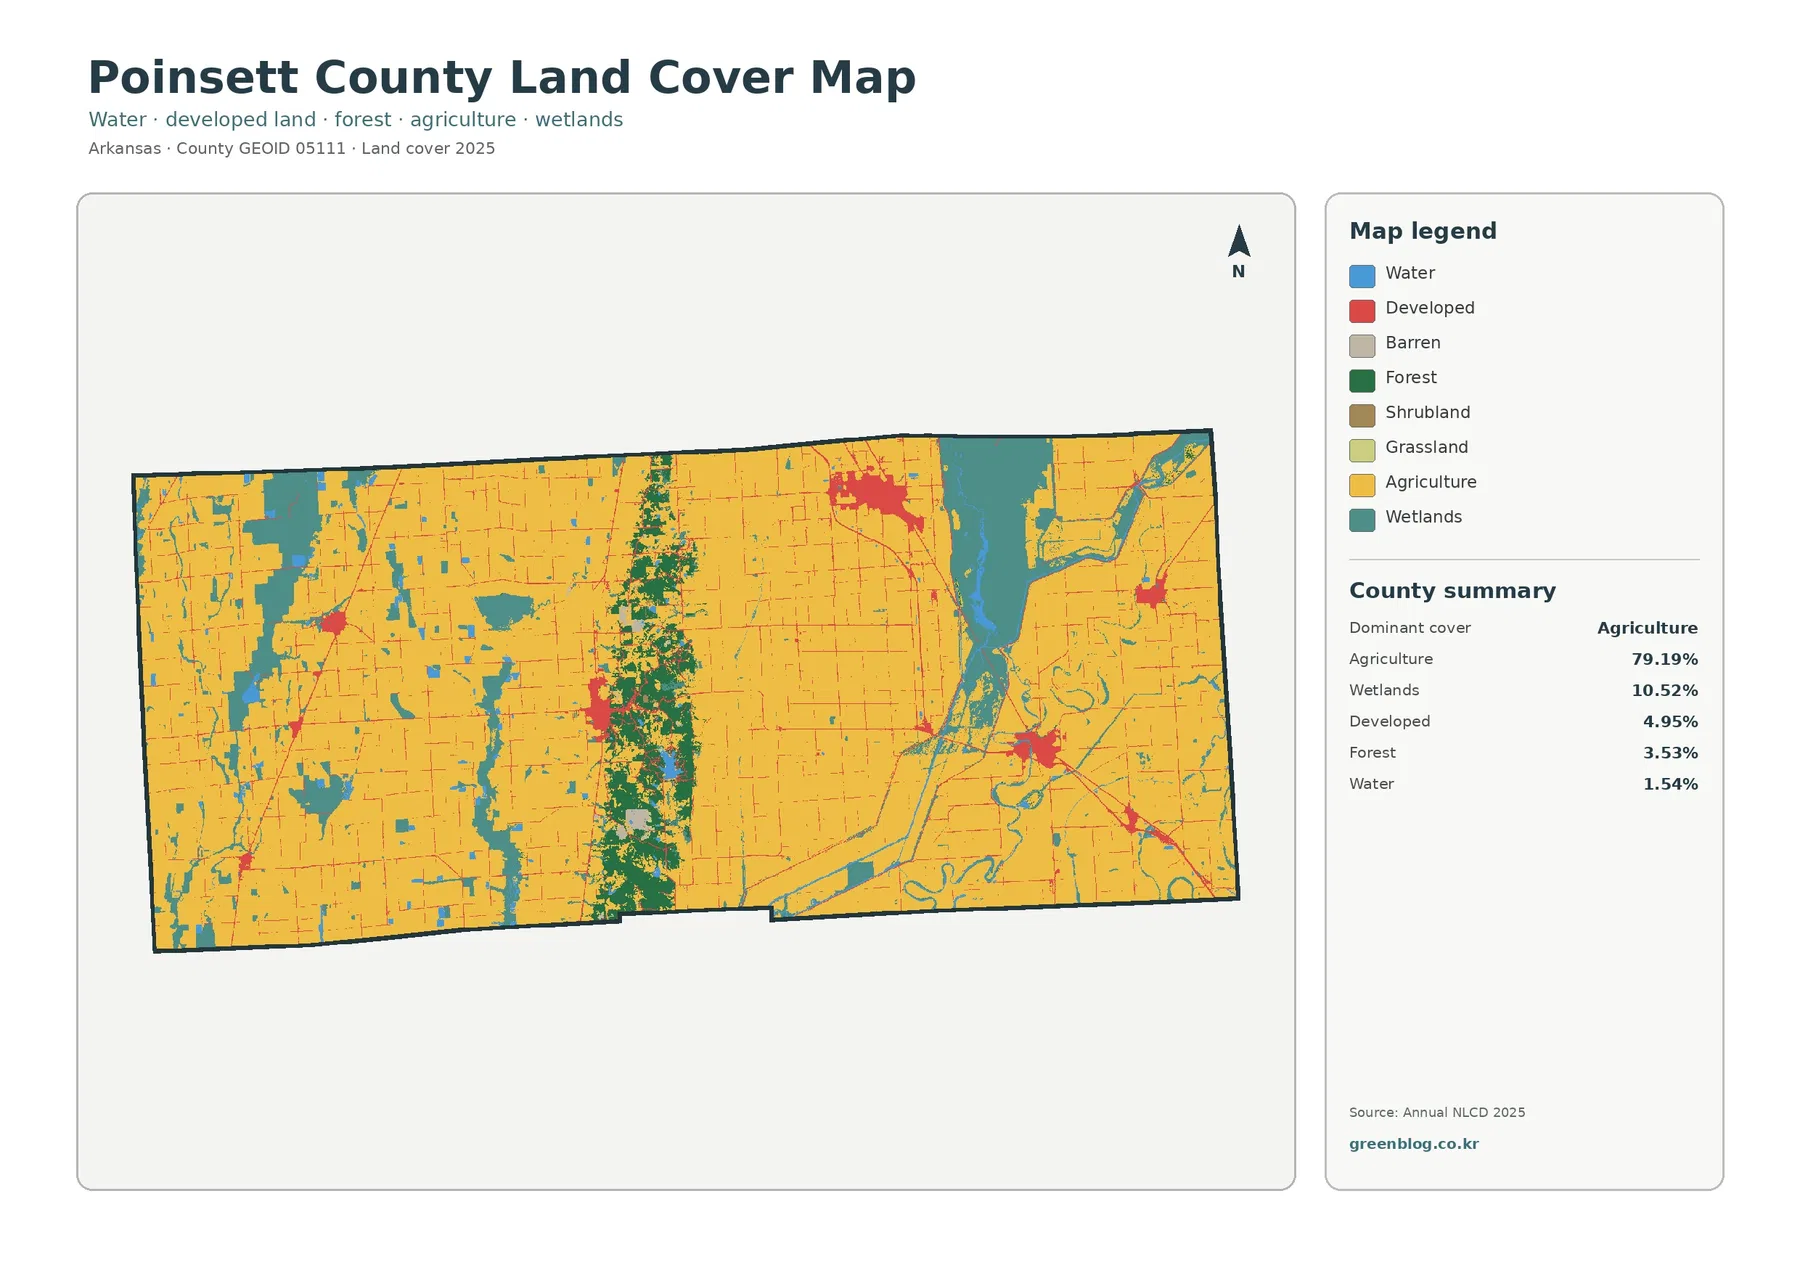
The general map is the best first view because its dominant color immediately explains the countywide pattern. Agricultural cover stretches across nearly the entire western and eastern portions of Poinsett County. The 79.19% share is far larger than any other category, so the smaller classes are easiest to understand as interruptions within a working farm landscape rather than as equally sized regions. Wetlands, forest, water, and developed land all have distinct locations even though each occupies much less area.
Wetlands are the second-largest mapped class at 10.52%. They appear in several substantial blocks as well as narrower shapes that follow low areas and drainage features. A U.S. Geological Survey study of Poinsett and neighboring counties describes the Cache and Black River systems west of Crowley’s Ridge and the St. Francis and Little Rivers, along with numerous ditches and laterals, to the east. The land-cover map does not label every wetland by waterway, but that hydrologic setting helps explain why wet ground is an important part of an otherwise agricultural county.
Developed cover totals 4.95%. Instead of forming one continuous metropolitan area, the red map class appears as several compact clusters connected by thinner linear features. Forest is slightly smaller at 3.53%, yet its arrangement makes it unusually prominent: much of it is concentrated through the county’s middle rather than scattered evenly. Water, at 1.54%, is smaller again and is most useful when read together with the wetland pattern rather than as a standalone countywide feature.
The impervious map isolates towns and road corridors from the surrounding fields
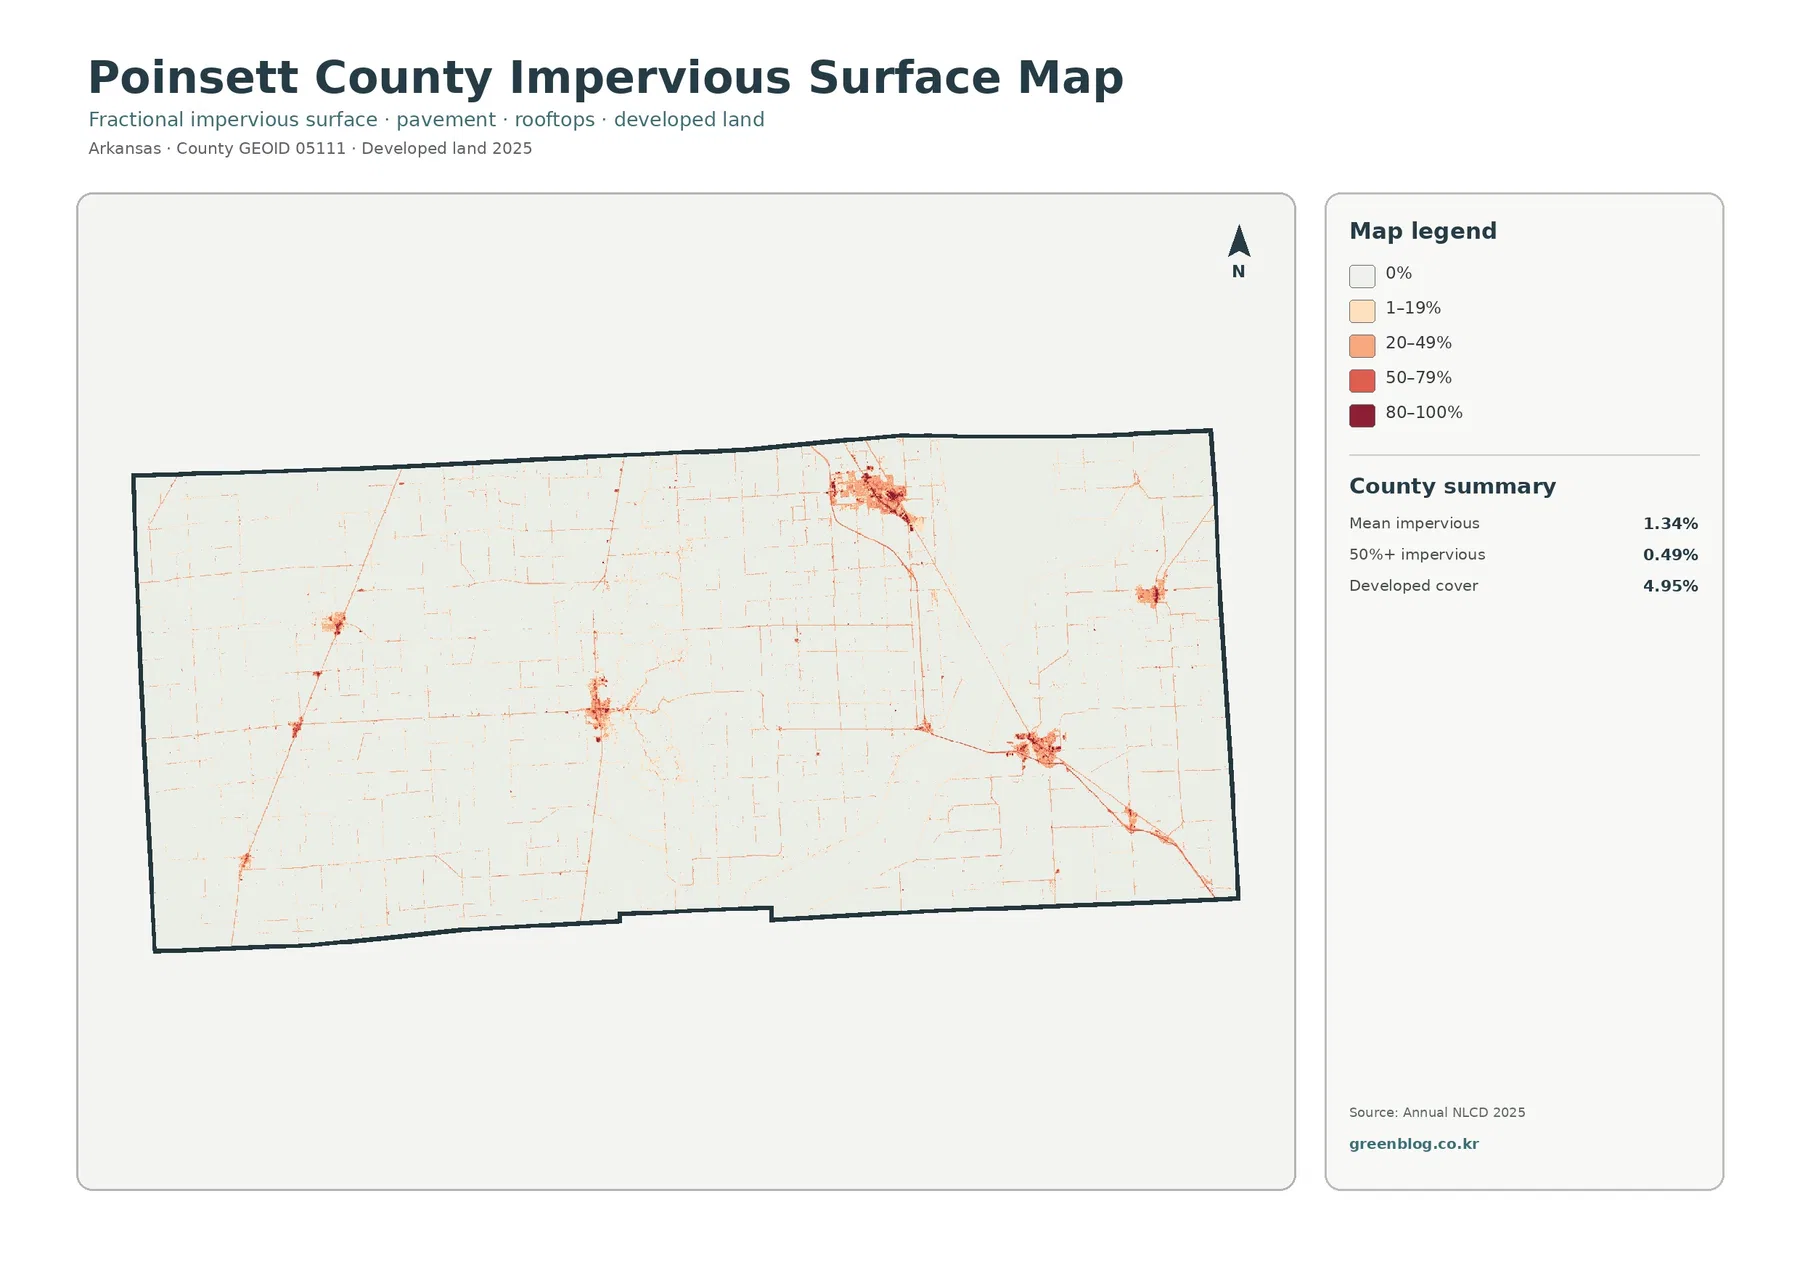
An impervious surface is a roof, paved road, parking lot, or other hard surface that does not readily absorb rainfall. Poinsett County has a mean impervious value of 1.34% in the supplied 2025 summary, and only 0.49% of the county is mapped at 50% impervious or higher. Those numbers are much lower than the 4.95% developed-cover share because a developed land-cover class can include lawns, trees, bare soil, and other surfaces that still allow water to infiltrate.
Most of the county therefore appears very light on this map. The useful information is in the small areas that become orange or red. Several settlement clusters stand out, and thin lines trace some transportation routes across the agricultural background. Poinsett County includes Harrisburg, the county seat, as well as Trumann, Marked Tree, Lepanto, and other communities. The map is not a municipal-boundary map, but it is well suited to showing how hard surfaces are concentrated around settlements while most farm areas remain lightly impervious.
Crowley’s Ridge becomes unmistakable when forest and farmland are simplified
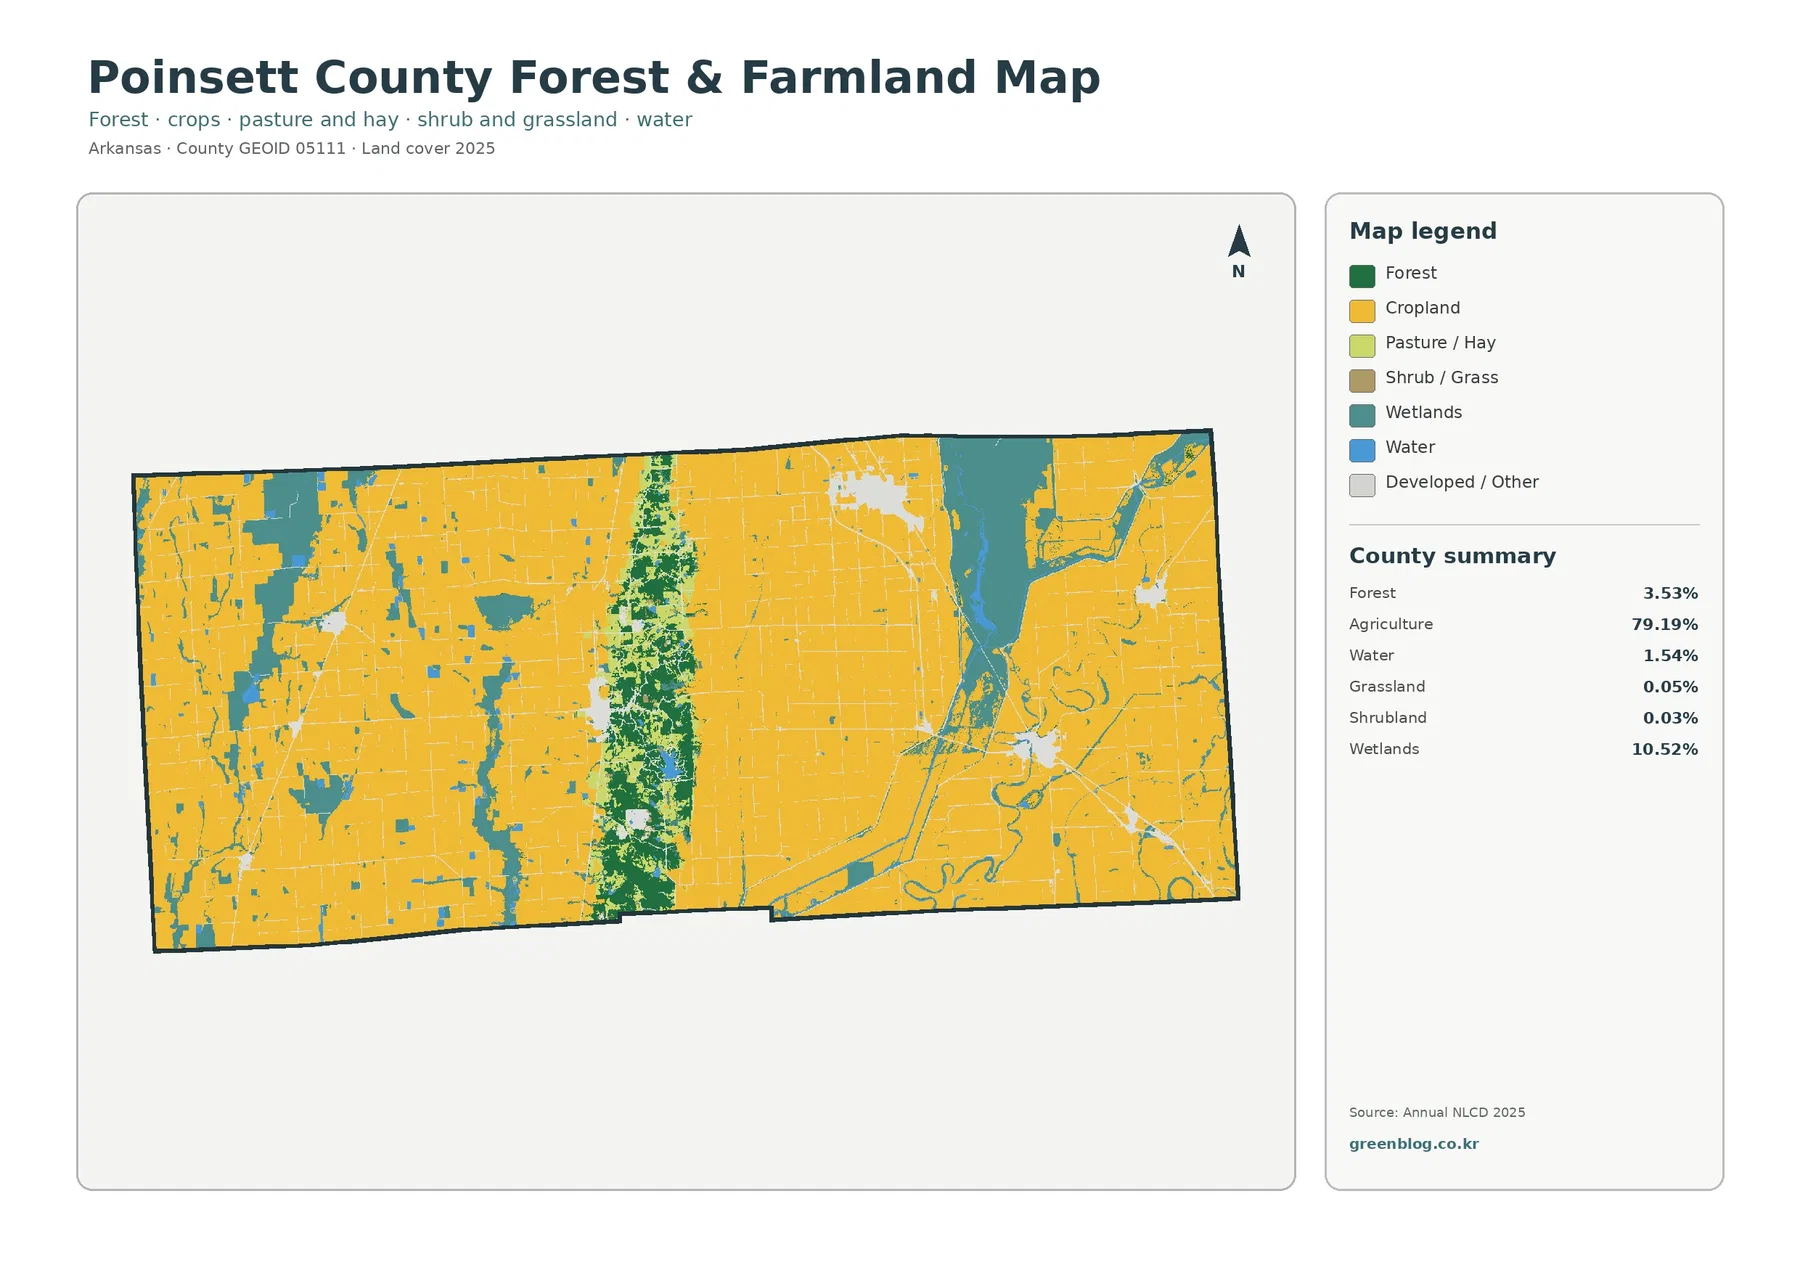
Removing most of the developed detail makes the county’s central wooded band much easier to see. Agriculture still occupies the broad eastern and western plains, but forest gathers in a narrow north–south strip. The Association of Arkansas Counties describes Poinsett County as rich, flat delta farmland to the east and west with rolling hills in the center, and specifically notes that Crowley’s Ridge splits the county. The supplied map closely matches that broad geographic description.
Only 4.58% is different between the 1985 and 2025 mapped classes
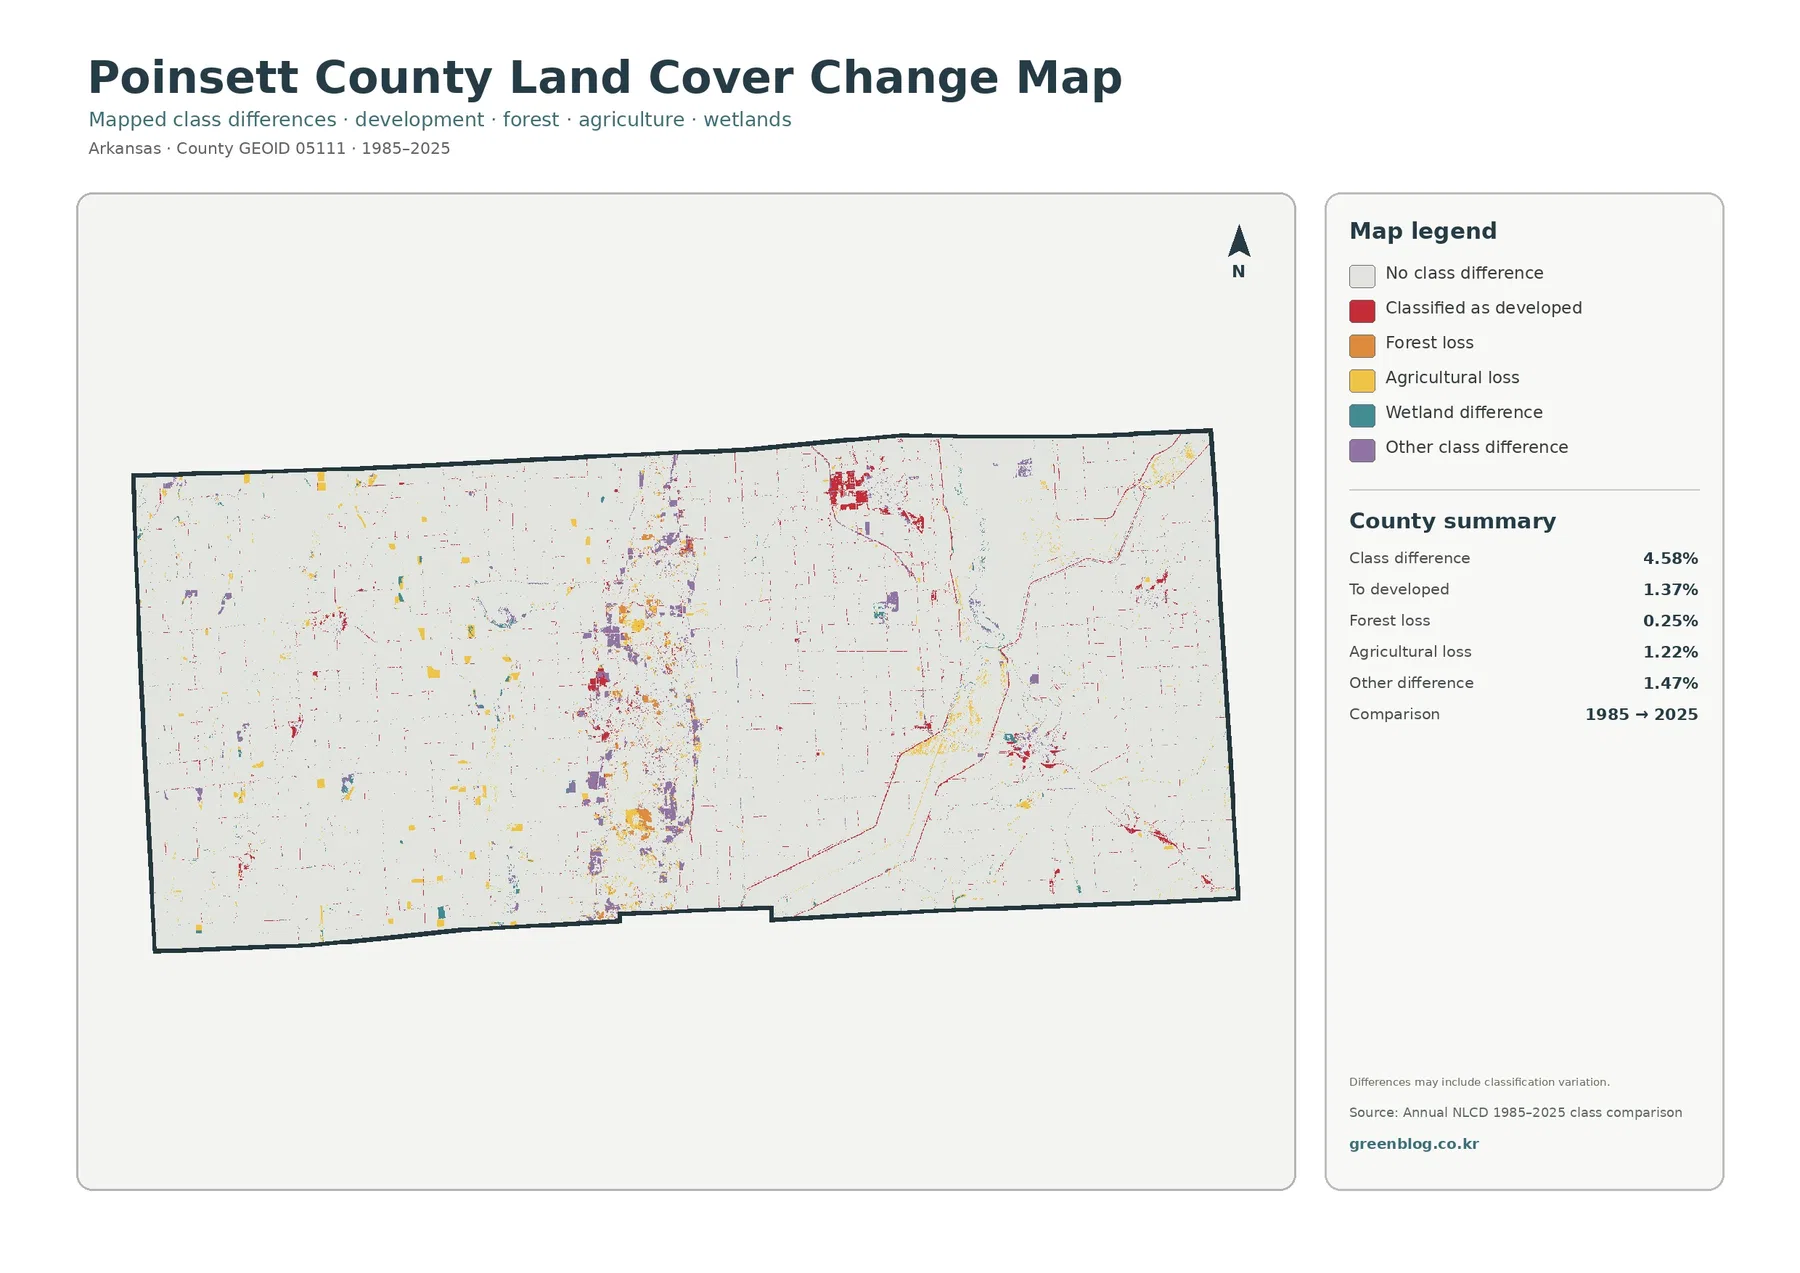
The change map is visually more speckled than the current-cover maps, but its county summary is relatively modest. Class difference totals 4.58% between 1985 and 2025, meaning most mapped cells remain in the same broad class in the two comparison years. Colored cells are distributed across the county rather than concentrated in one giant converted zone. That pattern matters because a busy-looking change map can easily be overstated when the total changed share is not read first.
The supplied summary separates several categories: 1.37% changed to developed, 1.22% is mapped as agricultural loss, 0.25% as forest loss, and 1.47% as other class difference. Wetland difference has its own legend color but no separate percentage in the summary. It would be incorrect to subtract the listed values from 4.58% and label the remainder as wetland change, because the package does not provide that calculation as a verified statistic.
Red development-change cells often appear near existing settlement or transportation patterns, while agricultural-loss and other-difference cells are scattered more widely. Forest-loss cells are comparatively limited, which fits the very small 0.25% summary value. The central ridge has some colored differences, but the map does not support a claim that Crowley’s Ridge underwent wholesale forest removal during the comparison period.
A class difference is not the same as a documented change in zoning, ownership, or legal land use. Some cells may reflect real clearing, development, wetland change, or agricultural transition, but classification boundaries can also shift because of mixed pixels, observation conditions, or differences in how a surface was assigned to a category. For that reason, the safest wording is that 4.58% of the summarized area has a different mapped land-cover class between 1985 and 2025.
How Poinsett County’s water and farm setting helps explain what the maps emphasize
Choose the map according to the question, not according to the most colorful legend
For a general county profile, start with the full land-cover map because it keeps agriculture, wetlands, forest, developed land, and water in one view. If the purpose is to explain Crowley’s Ridge, switch to the forest-and-farmland map, where the central wooded band is easier to follow. The impervious map is better for showing settlement footprints and road-related hard surfaces. The change map should be reserved for questions about the 1985–2025 comparison, because its colors mean differences between dates rather than current land-cover classes.
Scale and classification limits are especially important around field, ditch, and wetland edges
Annual NLCD is designed for consistent regional land-cover mapping, not parcel surveying. Its raster representation is commonly based on 30-meter cells, so a single cell can contain more than one real-world surface. In Poinsett County, that matters along narrow drainage ditches, field margins, small roads, wetland edges, and wooded strips. A mixed cell must still receive a classification, which makes some boundaries look cleaner or blockier than they would in high-resolution aerial photography.
Frequently Asked Questions
What is the dominant 2025 land cover in Poinsett County, Arkansas?
Agriculture is the dominant class at 79.19% of the supplied 2025 summary. Wetlands are 10.52%, developed cover 4.95%, forest 3.53%, and water 1.54%. The forest share is small by percentage but stands out because much of it is concentrated along Crowley’s Ridge.
Why does a narrow green band run through the middle of the county?
That wooded band follows Crowley’s Ridge, which crosses Poinsett County through its central portion. The forest-and-farmland map makes it especially easy to see because broad agricultural areas lie on both sides of the ridge.
Does the 4.58% class difference from 1985 to 2025 mean 4.58% of the county changed legal land use?
No. It means the mapped land-cover category differs between the two comparison years across 4.58% of the summarized area. Real landscape change may be part of that difference, but the map does not record zoning, ownership, parcel boundaries, or legal land-use changes.
Sources and reference material
- MRLC Annual NLCD Data – official access point for Annual NLCD land-cover products
- USGS Annual NLCD Land Cover Classification – official class definitions and interpretation guidance
- U.S. Census Bureau TIGER/Line Shapefiles – administrative boundary reference
- Association of Arkansas Counties – Poinsett County – local description of Crowley’s Ridge, the delta farmland, Harrisburg, and water-related features
- USDA 2022 Census of Agriculture – Poinsett County Profile – county farm, cropland, and irrigation statistics
- USGS – Water resources of Clay, Greene, Craighead, and Poinsett Counties – hydrologic context for the river systems and alluvial areas around Crowley’s Ridge
Map File Information
The four original Poinsett County maps used on this page are packaged in one ZIP file. The JPG files are larger than the web previews and are convenient for printing, classroom materials, presentations, and county-to-county comparisons.
- Included Files: Use only the versions confirmed in the article and supplied images
- File Type: Use the confirmed download contents
- Intended Use: Printing, education, presentations, and map-based projects
Related Maps
- A Craighead County Arkansas Land Cover Map
- Arkansas County Arkansas Land Cover Map
- Ashley County Arkansas Land Cover Map
Green Map creates custom-edited map images using open geographic data sources such as geoBoundaries, Natural Earth, OpenStreetMap, and government open data.
These maps are edited visual materials, not raw data files, and are provided for education, documents, presentations, and graphic reference.