The 2025 land-cover pattern in Lafayette County, Arkansas is a mix of forest, farmland, wetlands, open cover, and water rather than one dominant landscape from border to border. Forest is the largest mapped class at 41.64%, followed by agriculture at 27.18% and wetlands at 12.75%. The western edge along the Red River contains broad agricultural areas and wetland patches, while forest becomes much more extensive through the interior and eastern side. Lake Erling forms another strong water feature in the southern part of the county.
This page compares four views of the same county: general land cover, forest and farmland, impervious surface, and mapped class differences between 1985 and 2025. The WebP images are convenient for reading on the page, and the four original JPG maps supplied with the package are available together in one ZIP below. Using the views side by side makes it easier to separate present-day cover from built surfaces and long-term classification differences.
Table of Contents
Three anchors make the county easier to read: Red River, the wooded interior, and Lake Erling
Start at the western boundary. The county outline follows a long series of bends there, matching the Red River corridor. On the general land-cover map, yellow agricultural cover occupies large blocks next to this boundary, especially toward the southwest. Wetland colors repeatedly appear along bends, old channels, and low-looking strips near the river. This is one of the clearest differences between Lafayette County and a county where farm fields are spread evenly across the interior.
Move east from the river and the visual balance changes. Dark green forest forms large connected areas across much of the center and east, although it is broken by farm fields, grassland, shrubland, wetland patches, and small developed areas. The result is a mosaic, not an unbroken forest blanket. That distinction matters because the county summary gives forest a 41.64% share, but the map shows where that share is concentrated and where other covers interrupt it.
The third anchor is Lake Erling, a reservoir in Lafayette County that appears as the large blue water body in the southern part of the map. Its shape is easy to recognize across the general and forest/farmland views. Forest, wetlands, agricultural or open cover, and smaller developed surfaces sit around the lake, making it a useful place to compare class boundaries. The map does not provide water level, water quality, ownership, or habitat condition, so those questions require other data.
Lafayette County community information identifies Lewisville as the county seat and also highlights Stamps, Bradley, and Buckner. The map images do not label towns, so the colored developed clusters should not be assigned to a specific community solely from the pixels. Still, the known settlement pattern provides useful context for the small built-up concentrations visible in the northern half and the smaller concentration farther south.
The forest and farmland view reveals a strong west-to-east contrast
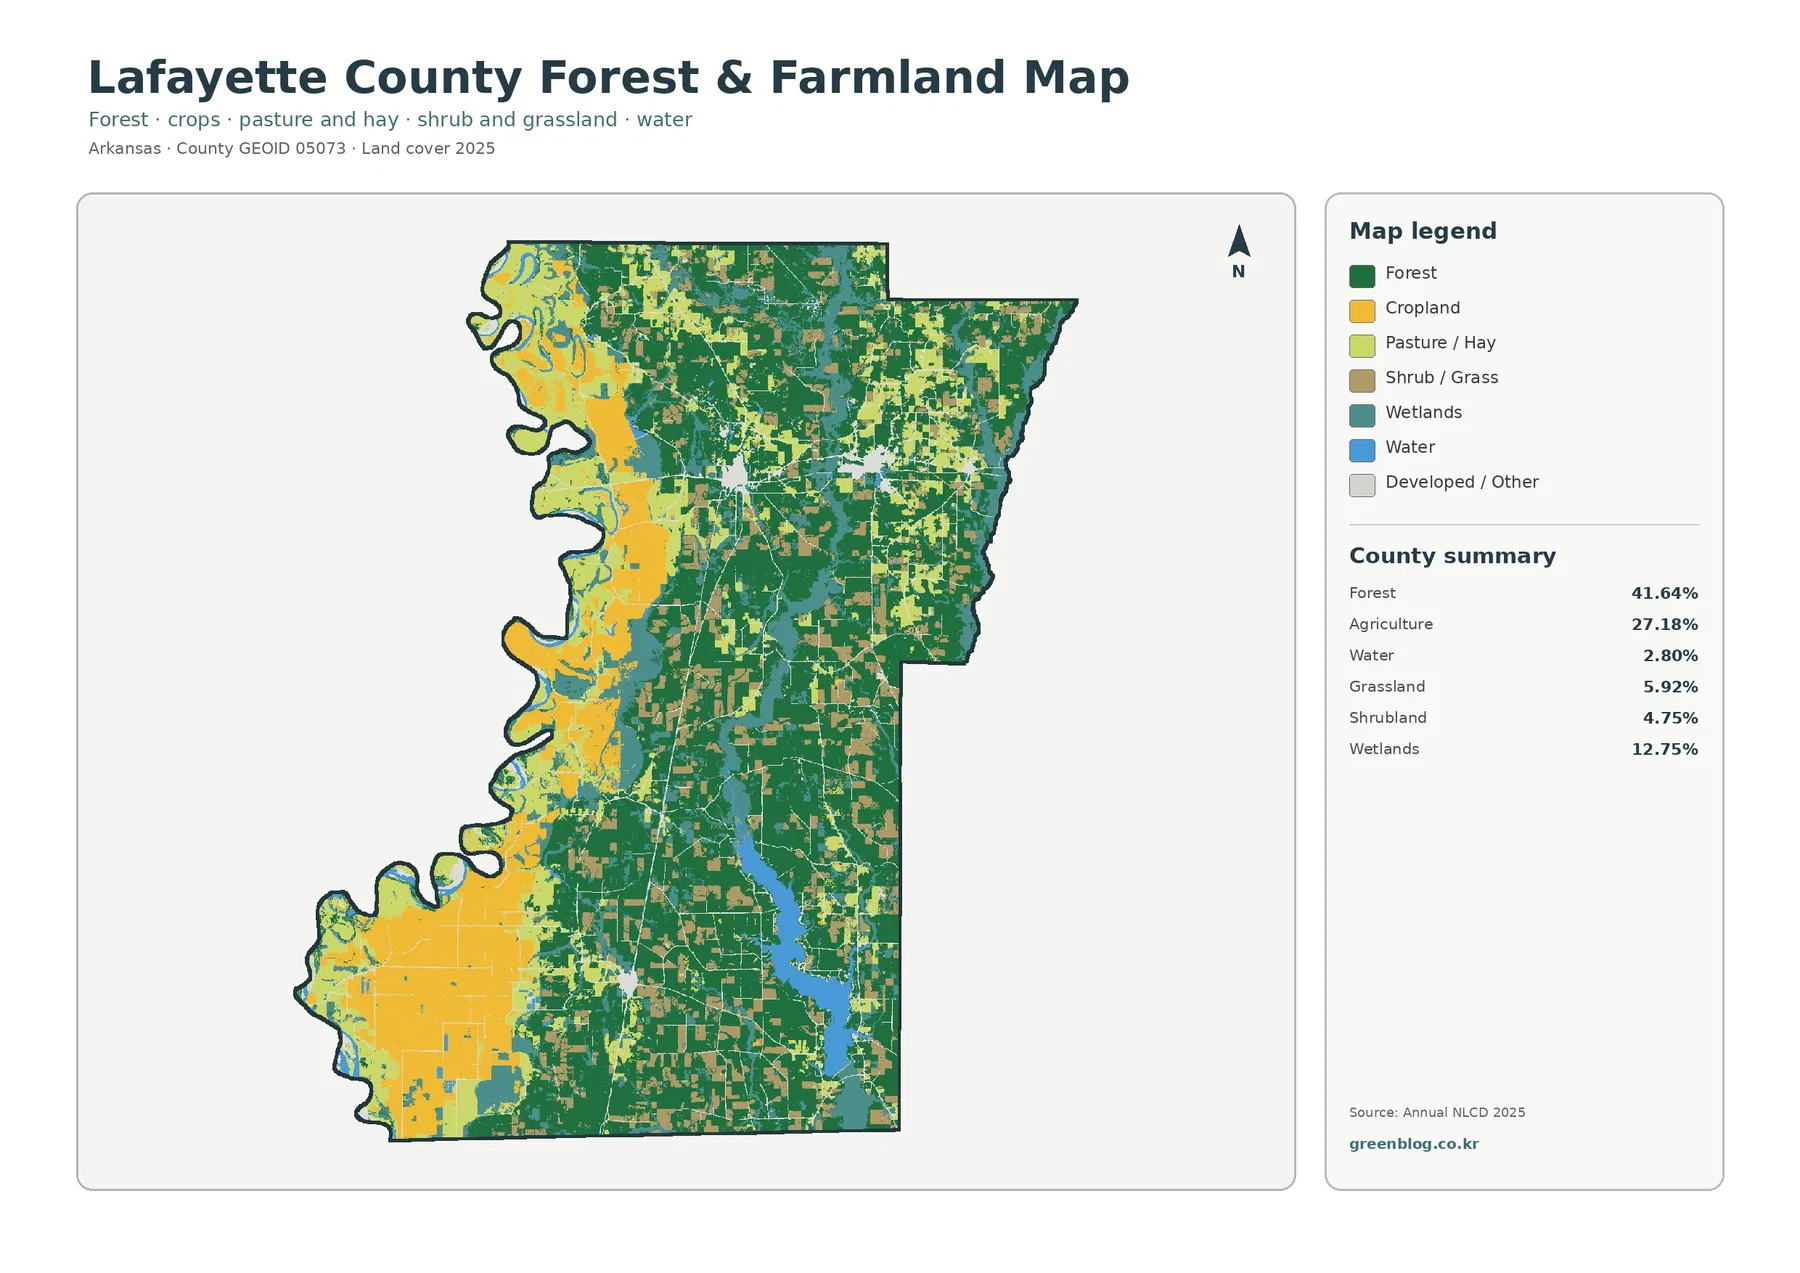
The forest and farmland map simplifies the county enough that the main contrast becomes immediate. Cropland forms broad blocks along the Red River side and in the southwest, while forest dominates many large areas farther east. In the north and center, smaller agricultural patches are scattered within the forest. The map therefore shows both a broad river-side farming zone and a finer patchwork of farms and open land embedded in the wooded interior.
Agriculture is summarized at 27.18%, but the legend separates cropland from pasture/hay. No verified countywide percentage for each of those two subclasses is supplied in the package, so it would be misleading to invent a split. The spatial pattern is still useful: cropland-colored areas are especially prominent near the western boundary and southwest, while lighter pasture/hay patches appear more frequently among forest blocks in other parts of the county.
Forest at 41.64% is the largest single category, yet the map should not be treated as a timber ownership or management map. Annual NLCD classifies surface cover observed in raster cells; it does not show tree species, logging permits, public versus private forest, or parcel boundaries. Local background sources describe timber as one component of Lafayette County’s economy, but that context should remain separate from the classification itself. A green cell tells the reader that the surface was classified as forest, not who owns or manages it.
Wetlands account for 12.75%, which is a substantial part of the county summary. In this simplified view, wetland patches occur along the Red River corridor, around water features, and in interior strips and pockets. Their presence beside forest and agriculture makes the map useful for discussing how different covers meet. It does not establish the legal boundary of a regulated wetland, however, and it should not be used to make permitting or development decisions.
The full 2025 map adds grassland, shrubland, development, and water to the picture
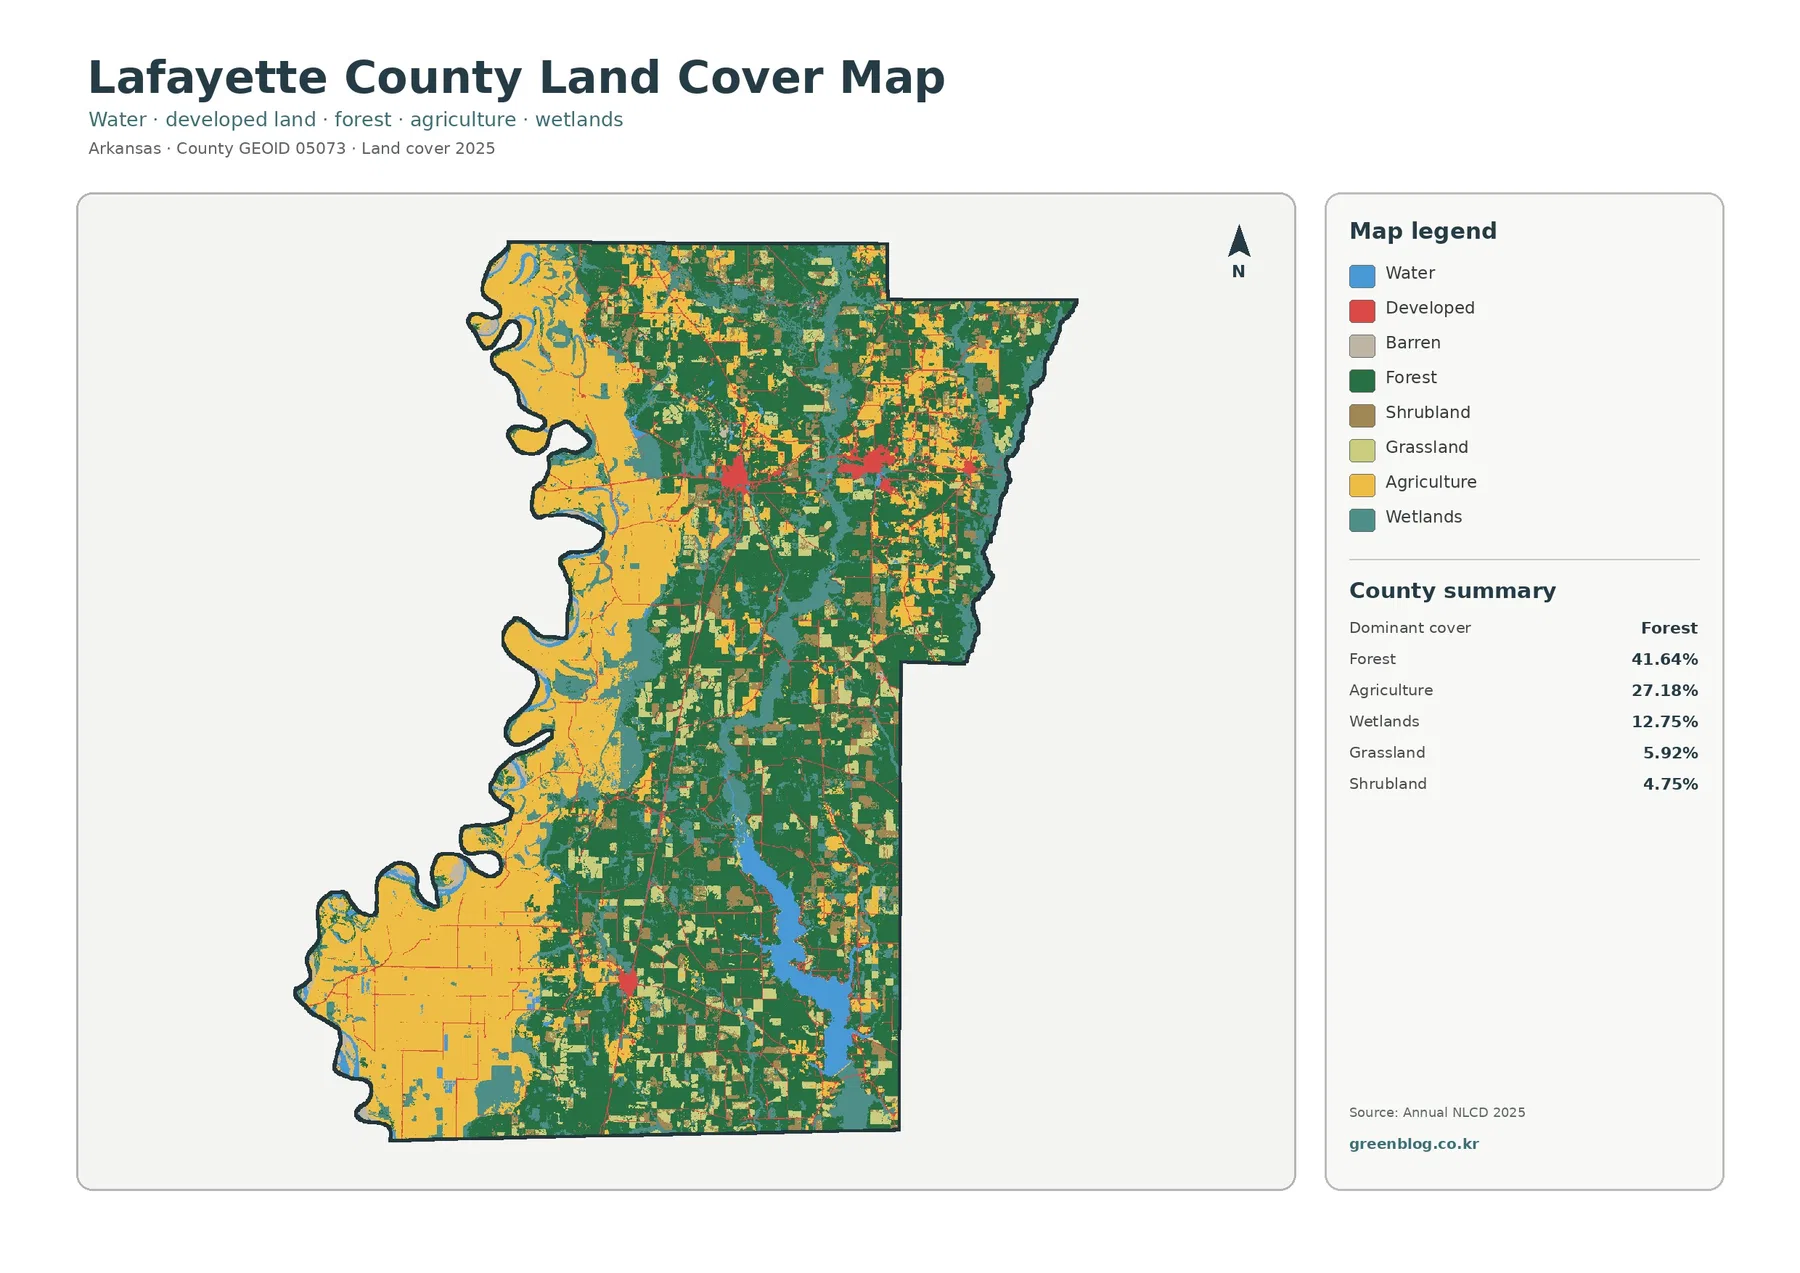
The general land-cover map restores the categories that are easier to overlook in the simplified forest/farmland view. Grassland is listed at 5.92% and shrubland at 4.75%. Both appear as smaller pieces between the much larger forest and agricultural blocks. These open classes help explain why boundaries between green forest and yellow agriculture are not always sharp; transitional or differently managed surfaces occupy part of the space between them.
Water is summarized at 2.80% on the forest/farmland map and is visually concentrated in recognizable features rather than spread uniformly. The Red River traces the western side, while Lake Erling creates a large southern water body. Smaller channels and water patches occur elsewhere. Because water is linear or concentrated, its visual importance can be greater than the countywide percentage suggests. A long river boundary can organize the map even though water occupies only a small fraction of the total area.
Developed cover is given as 4.25% in the impervious-surface summary. On the general map, developed land appears in several compact red clusters and thin connecting lines, especially in the northern half, with a smaller focus farther south. Forest and agricultural cover still surround these areas closely. This is a rural pattern of concentrated built surfaces rather than a continuous urban field, at least at the scale and classification shown here.
The full map is best for questions that involve several covers at once. If a reader wants to see where farmland sits relative to wetlands, or where a developed cluster meets forest, this view keeps all of those classes visible. If the question is specifically about farms versus woods, the simplified map is cleaner. Choosing between them based on the question prevents the legend from becoming more complicated than necessary.
Impervious surface isolates the small built footprint that the land-cover map can hide
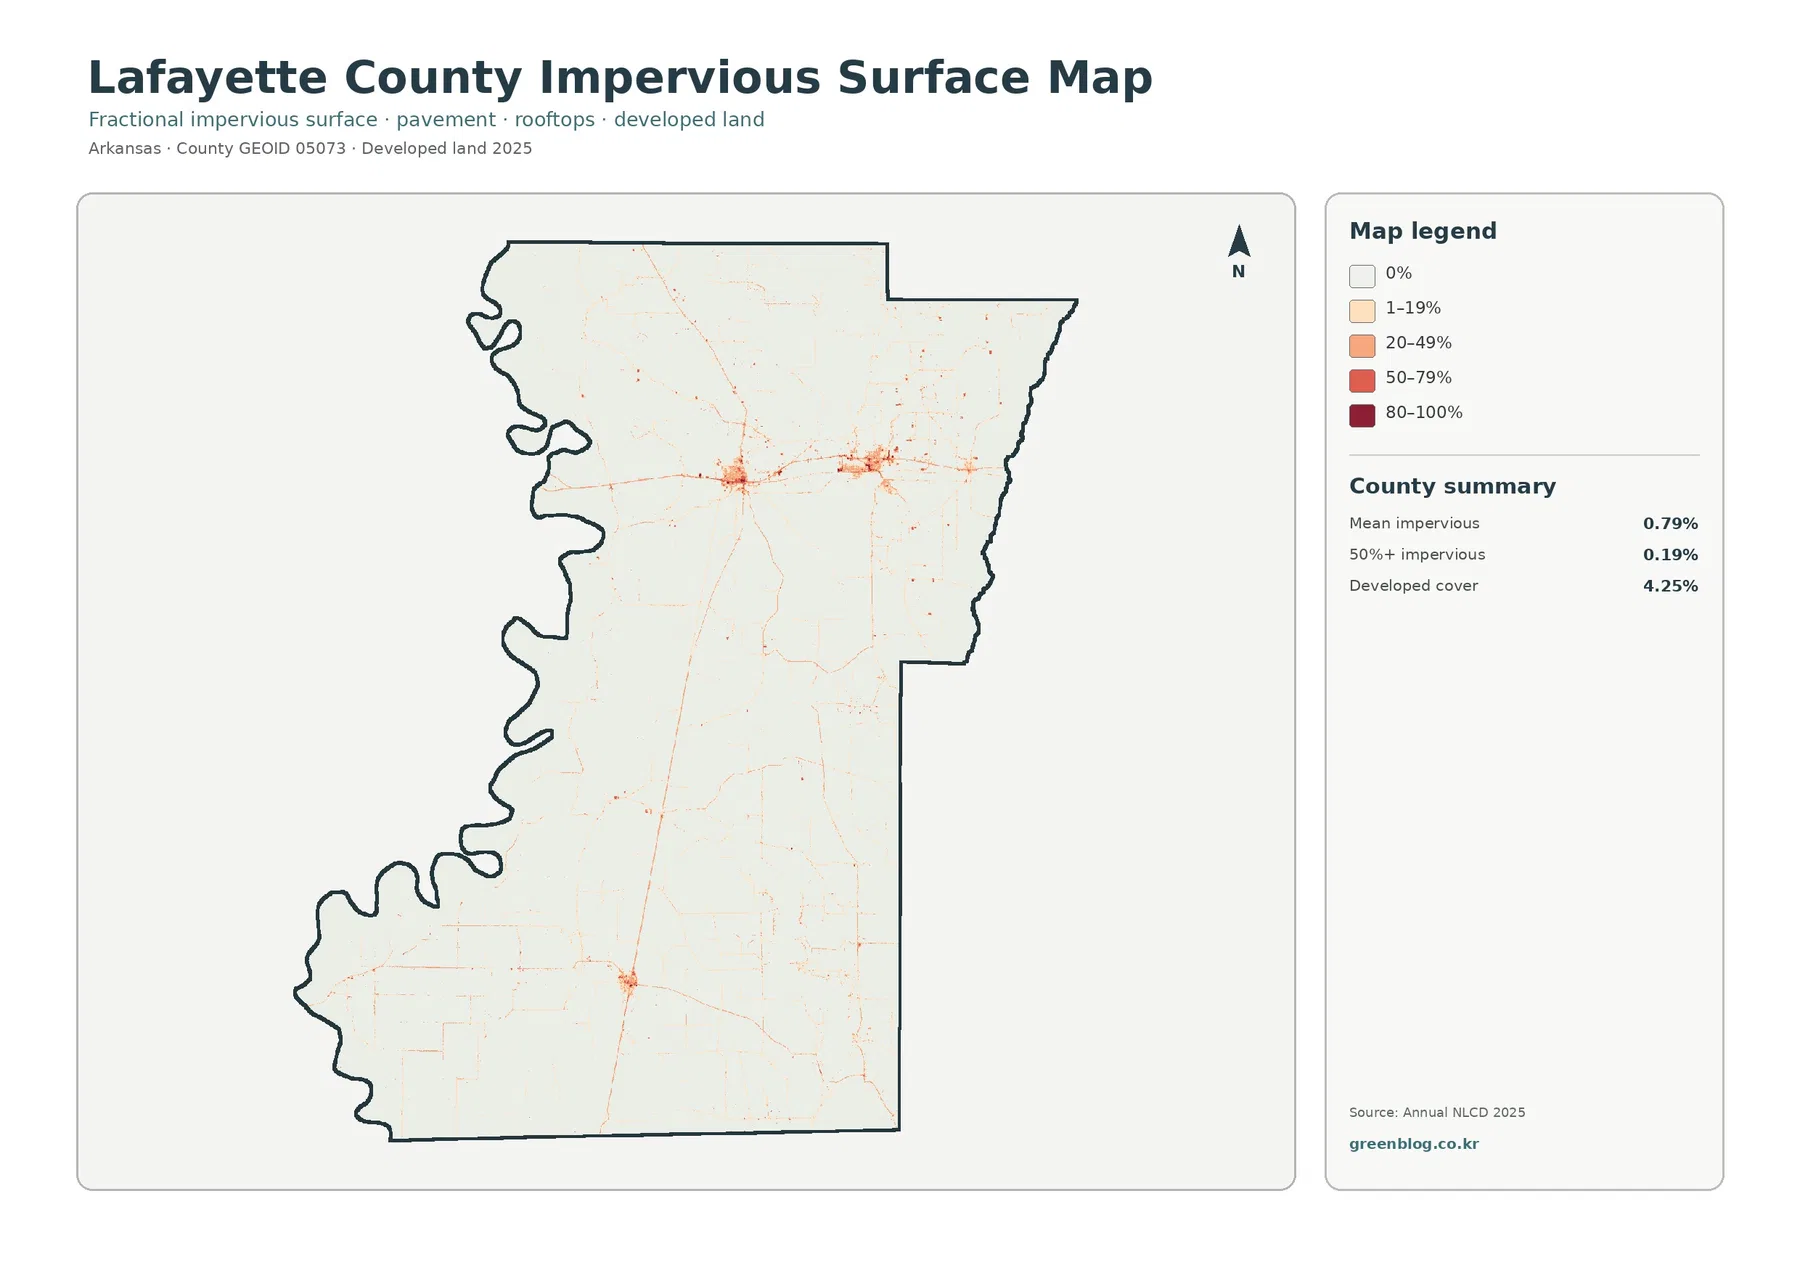
Impervious surface means pavement, rooftops, parking areas, and similar surfaces where rainfall does not readily infiltrate the ground. Lafayette County has a mean impervious value of 0.79%, and only 0.19% of the county is summarized as having imperviousness of 50% or more. Those values are much smaller than the 4.25% developed-cover figure because developed land can contain lawns, trees, bare soil, and other permeable surfaces in addition to pavement and buildings.
Most of the county is nearly white on this map, while a few small orange and red concentrations stand out. Two of the clearest clusters occur in the northern half with thin linear traces between and around them; another smaller concentration appears in the south. These patterns are consistent with a county where towns and roads occupy a limited share of the land. Since the map does not label roads or municipal boundaries, individual lines should be described as linear impervious features rather than named highways unless another map confirms them.
Comparing this image with the general land-cover map is especially helpful around developed centers. A red developed patch on the land-cover map may contain areas with very different impervious percentages. The impervious map shows where hard surfaces are concentrated inside and around that patch. This distinction can be useful in lessons about urban versus rural surfaces, stormwater concepts, or how the same “developed” class can contain both paved and vegetated ground.
An impervious-surface map is not a flood-risk map. It can show one factor related to runoff, but actual flooding also depends on rainfall, elevation, drainage, river levels, soils, and infrastructure. The Red River and Lake Erling should therefore be analyzed with hydrologic and flood datasets if the purpose is hazard assessment. This map is best used for surface-cover context, not as a substitute for those specialized sources.
Nearly three tenths of the county show a different mapped class between 1985 and 2025
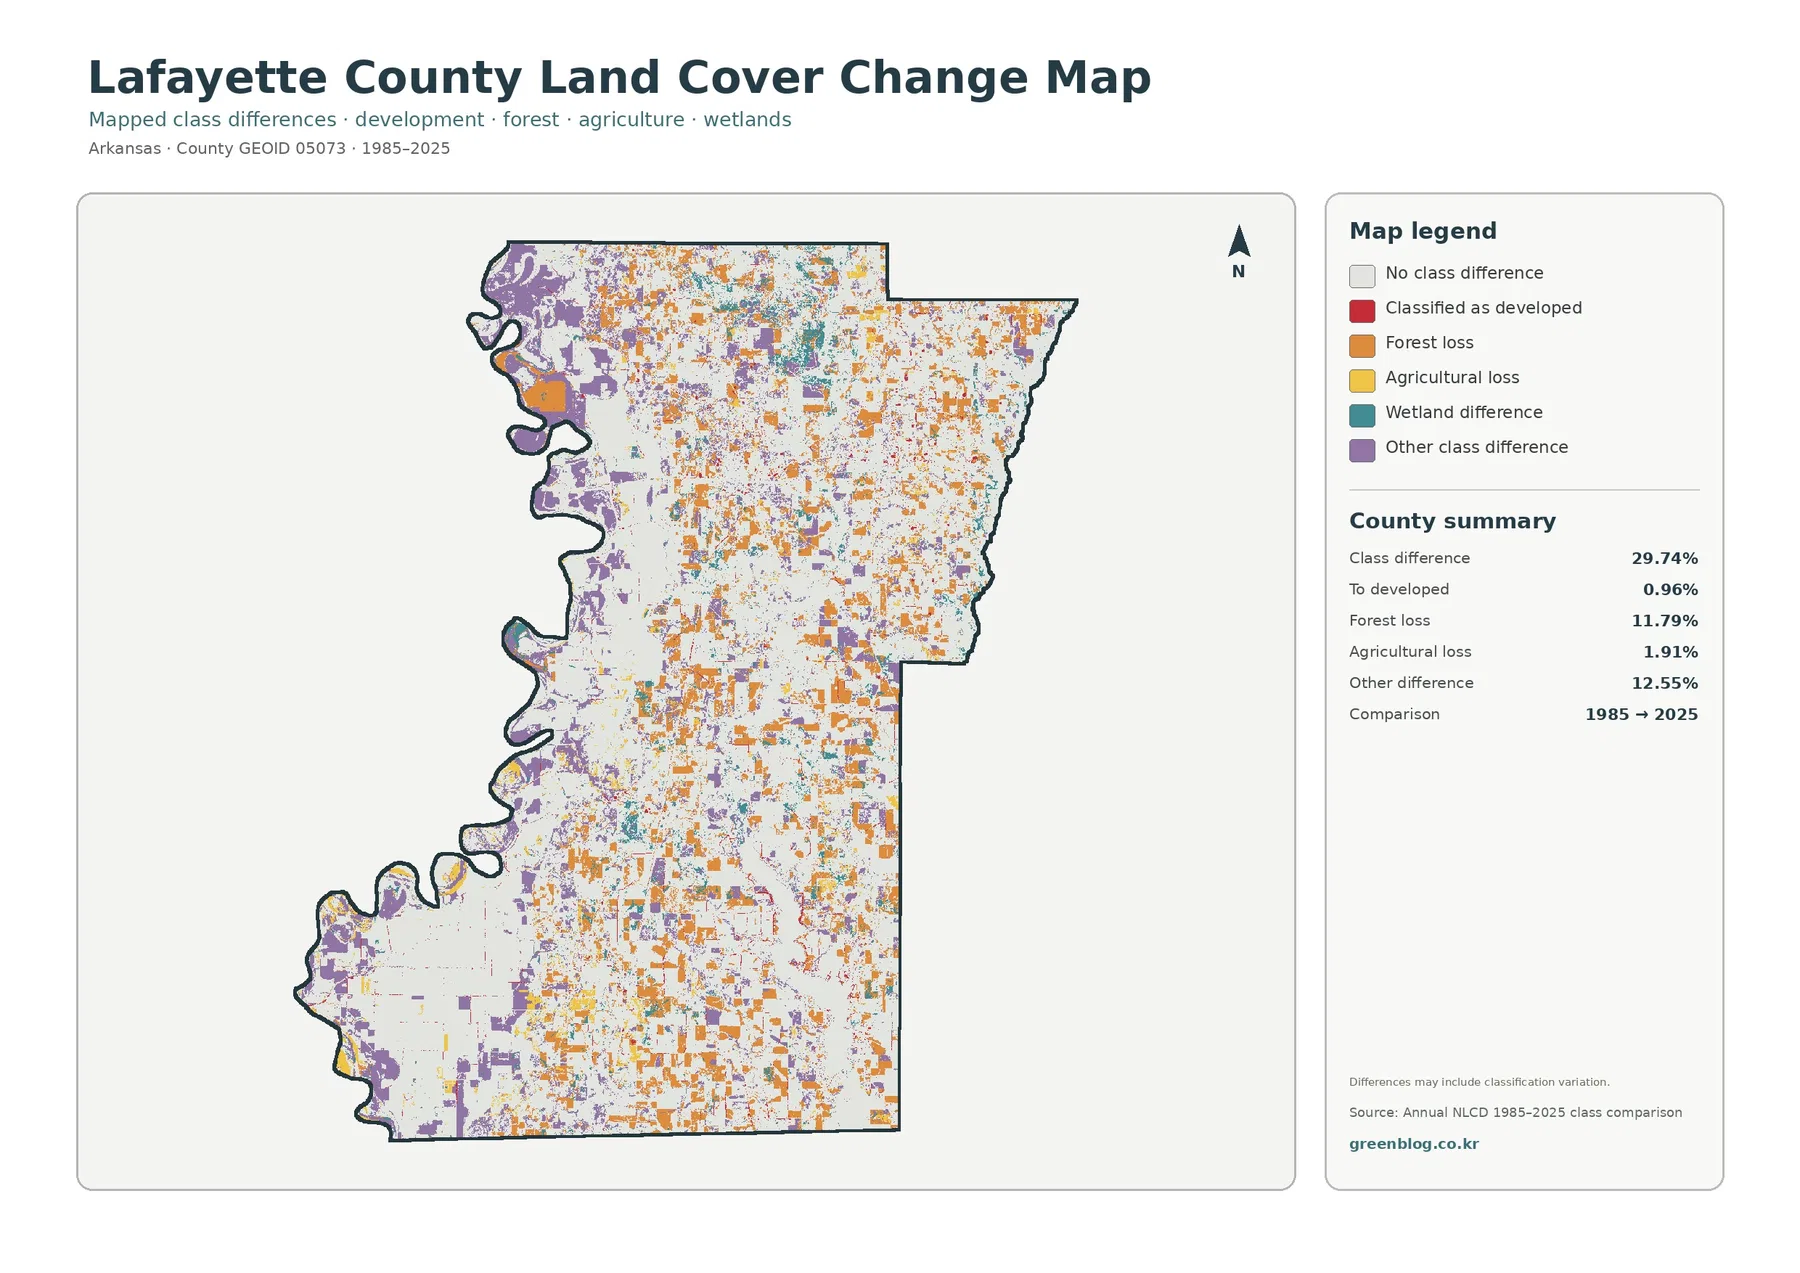
The change map reports class differences across 29.74% of Lafayette County between 1985 and 2025. The summary separates 0.96% as cells classified to developed, 11.79% as forest loss, 1.91% as agricultural loss, and 12.55% as other class difference. Wetland difference is shown as its own legend category, but the summary does not supply a separate percentage for it. These figures describe changes in mapped classes, not a complete accounting of why the landscape changed.
Orange forest-loss pixels are distributed widely through the interior, east, and south rather than forming only one compact zone. Purple “other class difference” is also widespread, including larger areas near parts of the western river boundary. Smaller wetland-difference and development-change marks are interspersed with them. The mixed colors are an important caution: a single countywide story such as “urban growth caused the change” would not fit what the map actually shows.
A forest-loss cell means that a location classified as forest in the earlier comparison is classified differently in 2025. It does not identify the cause. Timber harvest, conversion to agriculture, development, storm damage, vegetation succession, imagery differences, and classification variation are among the possibilities that may need to be checked with additional records. The map itself explicitly notes that differences may include classification variation.
Agricultural loss at 1.91% should be interpreted in the same careful way. It indicates cells that no longer carry the same agricultural classification in the two endpoints; it does not mean farm income, number of farms, or agricultural production fell by 1.91%. The change layer works best as a screening map for locating areas worth examining with annual imagery, aerial photography, or local records.
A practical way to compare the four maps without mixing their meanings
For the Red River side of the county, begin with the general map to see agriculture, wetlands, water, forest, and open cover together. Then switch to the forest/farmland map to simplify the same area and make farm–forest boundaries easier to follow. If the question is whether the mapped class changed over the long interval, use the 1985–2025 map last. This sequence keeps current cover separate from historical class differences.
For Lewisville, Stamps, or another developed community, the useful pair is different. The general map places developed cover inside the surrounding forest and agricultural setting, while the impervious map isolates pavement and rooftops. The 4.25% developed-cover value and 0.79% mean impervious value should be presented as two different measurements rather than competing estimates of the same thing.
Lake Erling provides another comparison point. On the general map the lake is a strong blue feature surrounded by several cover types. The forest/farmland view makes the adjoining wooded and agricultural/open areas easier to distinguish. On the change map, colored cells around the lake show classification differences, but they should not automatically be labeled as water-level change or wetland loss. Answering those questions requires a time series focused on the water body itself.
Download the four original JPG maps
The download archive contains the four original JPG files provided for this Lafayette County package: the 2025 general land-cover map, forest and farmland map, impervious/developed-land map, and the 1985–2025 class-difference map. Each supplied JPG is recorded at 2480×1754 pixels. The WebP versions in the article are page previews. Use the JPG files when you want to keep the supplied source map image, place it in a presentation, or compare the maps at a larger display size.
For a report or classroom slide, clarity usually improves when one main map is shown large and a second map is used only for comparison. A Red River discussion can pair the general and forest/farmland maps. A community-development discussion can pair the general and impervious views. Add the change map only when the topic specifically includes the 1985–2025 comparison, because its colors describe a different question from the current-cover maps.
What these maps do not tell you about a parcel or property
Land cover is a classification of what is on the surface, such as forest, agriculture, water, wetland, or developed land. It is not zoning, ownership, a parcel survey, or a statement about what can legally be built on a property. A forest-classified pixel does not identify the landowner or forest-management status. An agricultural pixel does not specify a crop, farming business, or legal land-use restriction.
Annual NLCD is raster data, meaning the landscape is represented by grid cells. A single cell can contain a forest edge, a narrow road, grass, a building, or water at the same time, and the classification generalizes that mixed surface. Small roads, field edges, narrow streams, and parcel boundaries can therefore look simpler than they do on the ground. The color boundary should never be treated as a surveyed property line.
The current-cover views use the supplied 2025 classification. New construction, timber activity, vegetation recovery, crop changes, or water changes after that date may not appear. The long-term map compares 1985 with 2025, so it does not show every intermediate step. When a specific location or recent change matters, check newer imagery and, when possible, annual datasets or local records.
Frequently Asked Questions
What is the largest 2025 land-cover class in Lafayette County?
Forest is the largest class in the supplied county summary at 41.64%. Agriculture follows at 27.18%, and wetlands account for 12.75%. The map shows the forest most extensively through the interior and east, while broad agricultural cover is especially visible along the Red River side.
Why does the developed-cover value differ from mean impervious surface?
Developed cover is a land-cover class that can include buildings, pavement, lawns, trees, and other surfaces. Impervious surface measures the hard surfaces that do not readily absorb water. Lafayette County is summarized at 4.25% developed cover but only 0.79% mean imperviousness.
Does the 29.74% class difference mean that 29.74% of Lafayette County was physically transformed?
Not necessarily. Real landscape change can contribute, but imagery, mixed pixels, and classification variation can also affect an endpoint comparison. Use the change map to locate areas for closer review, then verify causes with annual imagery, aerial photos, or local records.
Map File Information
Lafayette County Land Cover Map JPG Files
- Included Files: Use only the versions confirmed in the article and supplied images
- File Type: Use the confirmed download contents
- Intended Use: Printing, education, presentations, and map-based projects
Related Maps
- A Craighead County Arkansas Land Cover Map
- Arkansas County Arkansas Land Cover Map
- Ashley County Arkansas Land Cover Map
Sources and References
- MRLC Annual NLCD Data — official access point for Annual NLCD land-cover data and related products.
- USGS Annual NLCD Land Cover Classification — definitions and context for land-cover classes used in Annual NLCD.
- U.S. Census Bureau TIGER/Line Shapefiles — official U.S. geographic boundary data, including county boundaries.
- Association of Arkansas Counties – Lafayette — county administrative information identifying Lewisville as the county seat.
- Encyclopedia of Arkansas – Lafayette County — trusted background on the Red River, agriculture, timber, and county history.
- Arkansas Geological Survey – Lafayette County Map — a state map that identifies Lake Erling and other geographic features within Lafayette County.
Green Map creates custom-edited map images using open geographic data sources such as geoBoundaries, Natural Earth, OpenStreetMap, and government open data.
These maps are edited visual materials, not raw data files, and are provided for education, documents, presentations, and graphic reference.