Jefferson County, Arkansas has a land-cover pattern that changes noticeably from one side of the county to the other. Agriculture is the largest 2025 class at 49.27%, yet it shares the county with broad western forests, extensive wetlands and water along the Arkansas River system, and a developed concentration around Pine Bluff. The four map views on this page separate those themes so readers can compare the county’s rural landscape, river-related cover, built surfaces, and long-term class differences without treating the area as one uniform block.
The page includes general land cover, forest and farmland, impervious/developed land, and a 1985–2025 land-cover change comparison. The four original JPG maps are available together in one ZIP near the lower part of the page. The WebP images in the article are intended for quick browser viewing, while the supplied JPG files are better suited to presentations, classroom handouts, county reference sheets, and other layouts that need the original map images.
Table of Contents
Jefferson County changes from western woods to eastern Delta farmland
Jefferson County’s own public information describes roughly the western third as pine-covered rolling hills and the eastern two-thirds as productive Delta farmland. That description matches the broad pattern in the supplied land-cover maps. Forest cover occupies large areas along the west and southwest, while agricultural colors become much more common across the central and eastern portions. The transition is not a sharp straight boundary, but the contrast is clear enough that a reader can understand the county’s basic landscape arrangement before looking at individual classes.
The Arkansas River adds another major element. Water curves through the county near Pine Bluff and continues toward the east and southeast, while wetland classes appear repeatedly near river channels and across lower-lying eastern areas. Farming remains extensive in that part of the county, but it is broken by water and wetland features rather than forming one uninterrupted agricultural surface. Reading those three elements together—farmland, wetlands, and the river—gives a more accurate picture than looking at the agricultural percentage by itself.
The 2025 land-cover map puts the main classes in one view
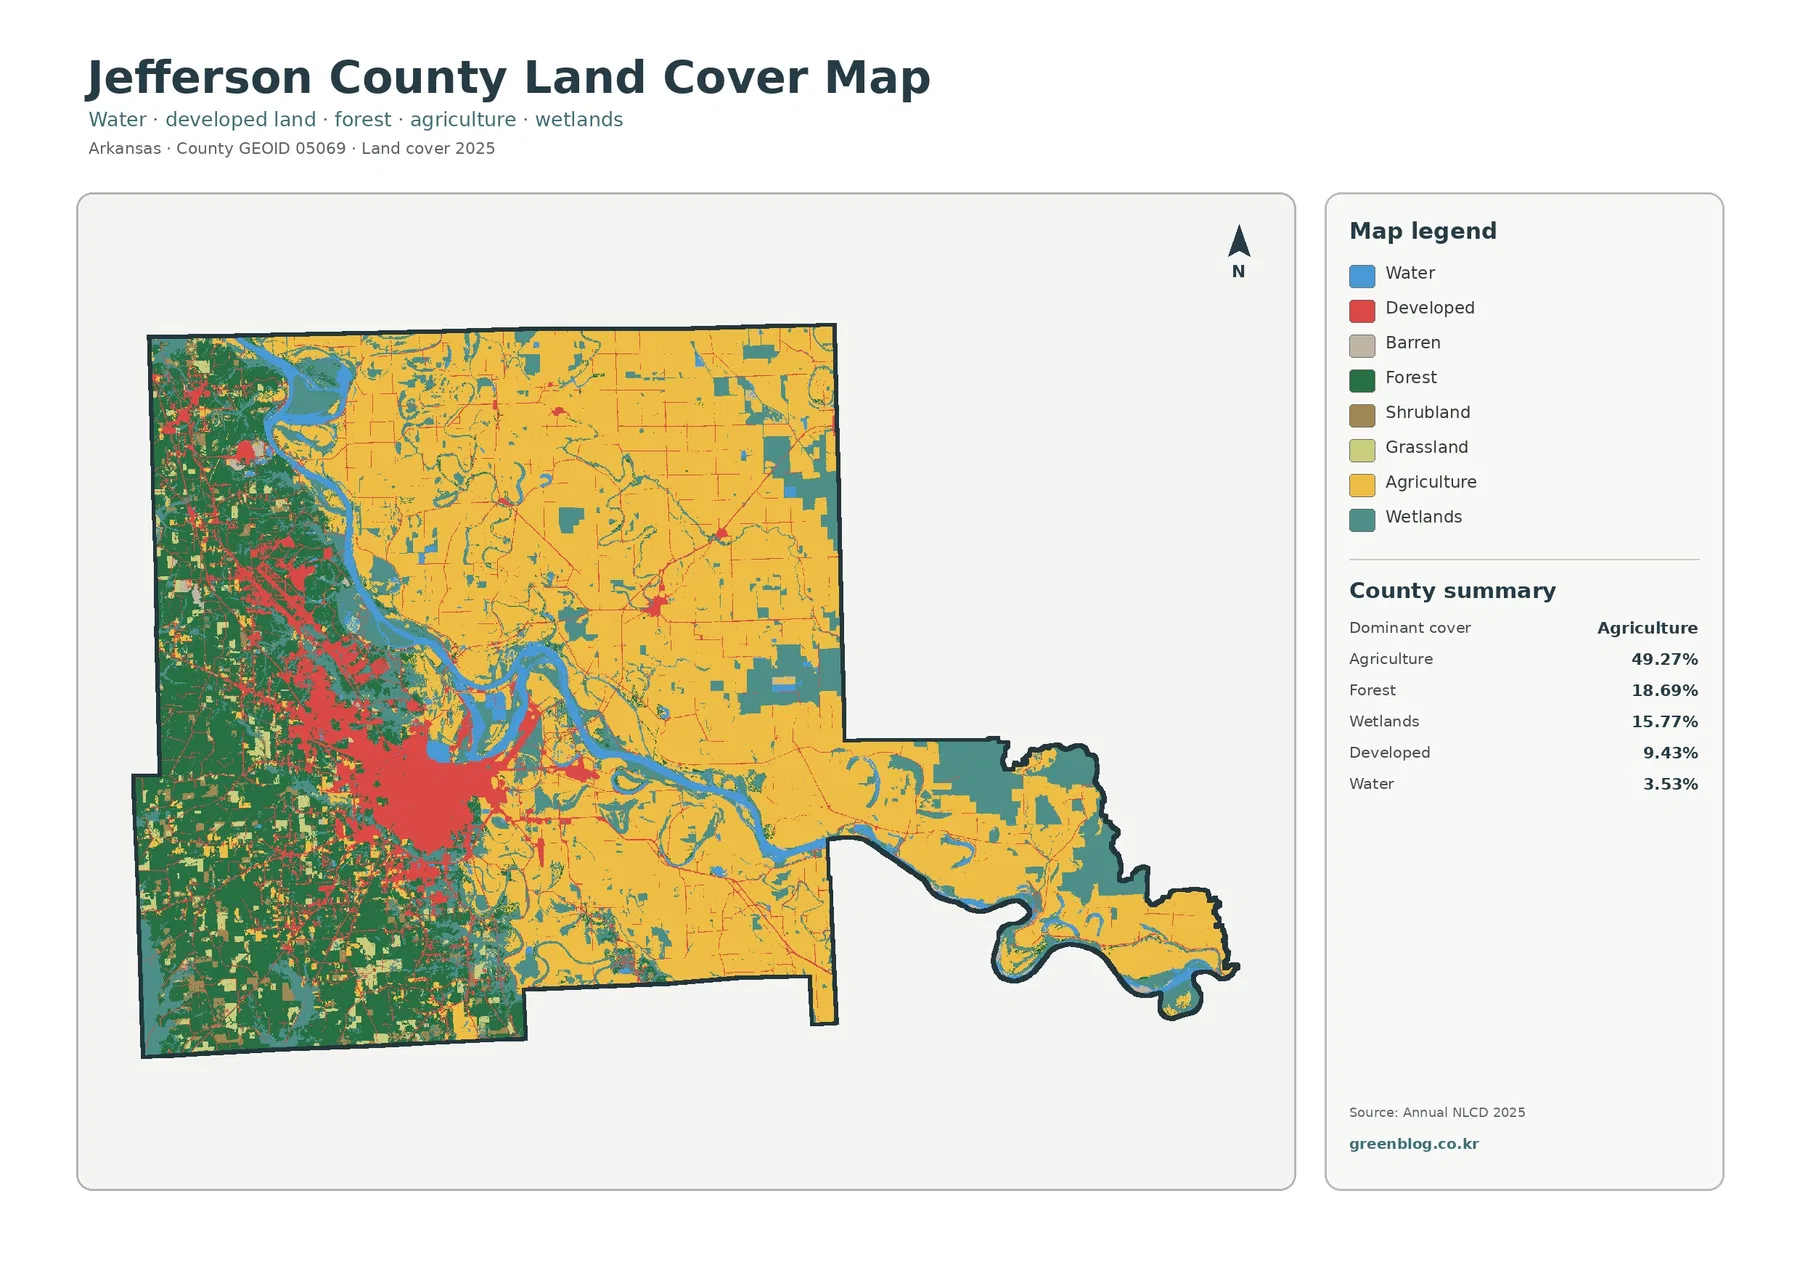
Agriculture accounts for 49.27% of the supplied 2025 county summary, making it the largest class. Forest follows at 18.69%, wetlands at 15.77%, developed cover at 9.43%, and water at 3.53%. Those percentages are useful, but the map adds the location information that a table cannot provide. Agricultural cover is most extensive in the center and east, forest is much stronger in the west and southwest, and developed cover is concentrated around Pine Bluff rather than spread evenly through the county.
Wetlands and water are especially important in Jefferson County because together they occupy a substantial share of the mapped surface. Wetland colors occur in irregular patches and narrow corridors around waterways, and they are common in the eastern lowlands. County information also identifies Bayou Meto Wildlife Management Area as a seasonally flooded landscape, which helps explain why wet environments are an important part of the local setting. The supplied map does not show the legal boundary of that management area, however, so an individual wetland patch should not be labeled as part of Bayou Meto WMA without separate boundary data.
Developed cover is 9.43% in the 2025 summary. The largest concentration surrounds Pine Bluff, while smaller developed patches and linear features appear near other settlements and transportation corridors. A developed land-cover class should not be confused with zoning or parcel use. It can contain houses, commercial areas, roads, lawns, trees, soil, and other surfaces within a developed setting, so the map is useful for comparing where development is concentrated but cannot identify the legal use or ownership of a specific property.
Forest and farmland are easier to compare in the simplified rural map
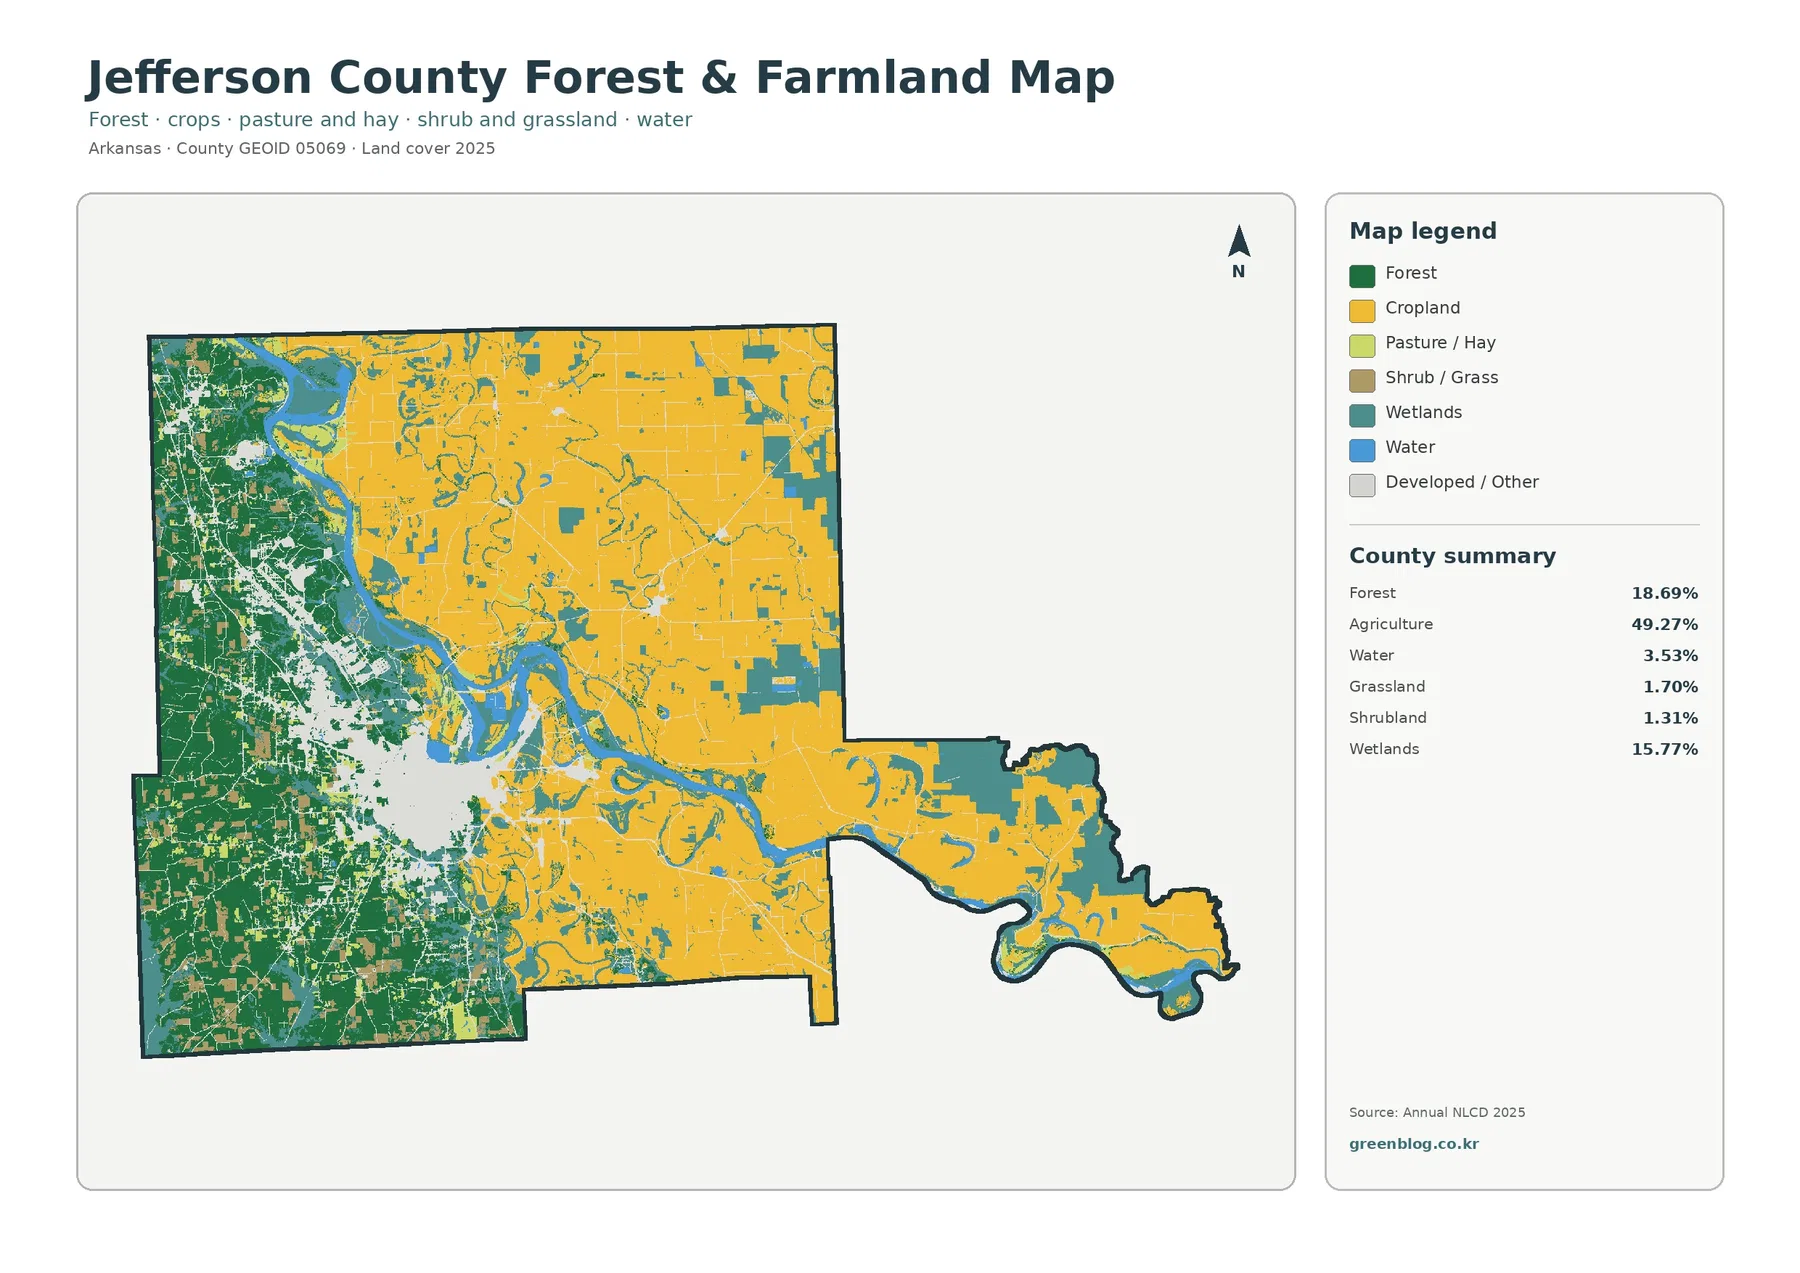
The forest-and-farmland version reduces the visual competition from the full land-cover legend. Forest remains 18.69% and agriculture 49.27%, so the west-to-east contrast becomes immediate: large green areas dominate much of the western side, while agricultural colors spread across the center and east. Pine Bluff and other nonforest, nonagricultural surfaces are simplified, making it easier to focus on the boundary between wooded and cultivated parts of the county rather than on every urban class.
The supplied summary also lists grassland at 1.70% and shrubland at 1.31%. These classes are present but do not define the county as strongly as forest and agriculture. For a classroom or county-profile graphic, this map is useful when the goal is to explain the broad rural landscape first. A general land-cover map can then be added when the reader needs to see how wetlands, water, and developed areas interrupt or border those larger forest and farming zones.
Pine Bluff becomes clearer on the impervious-surface map
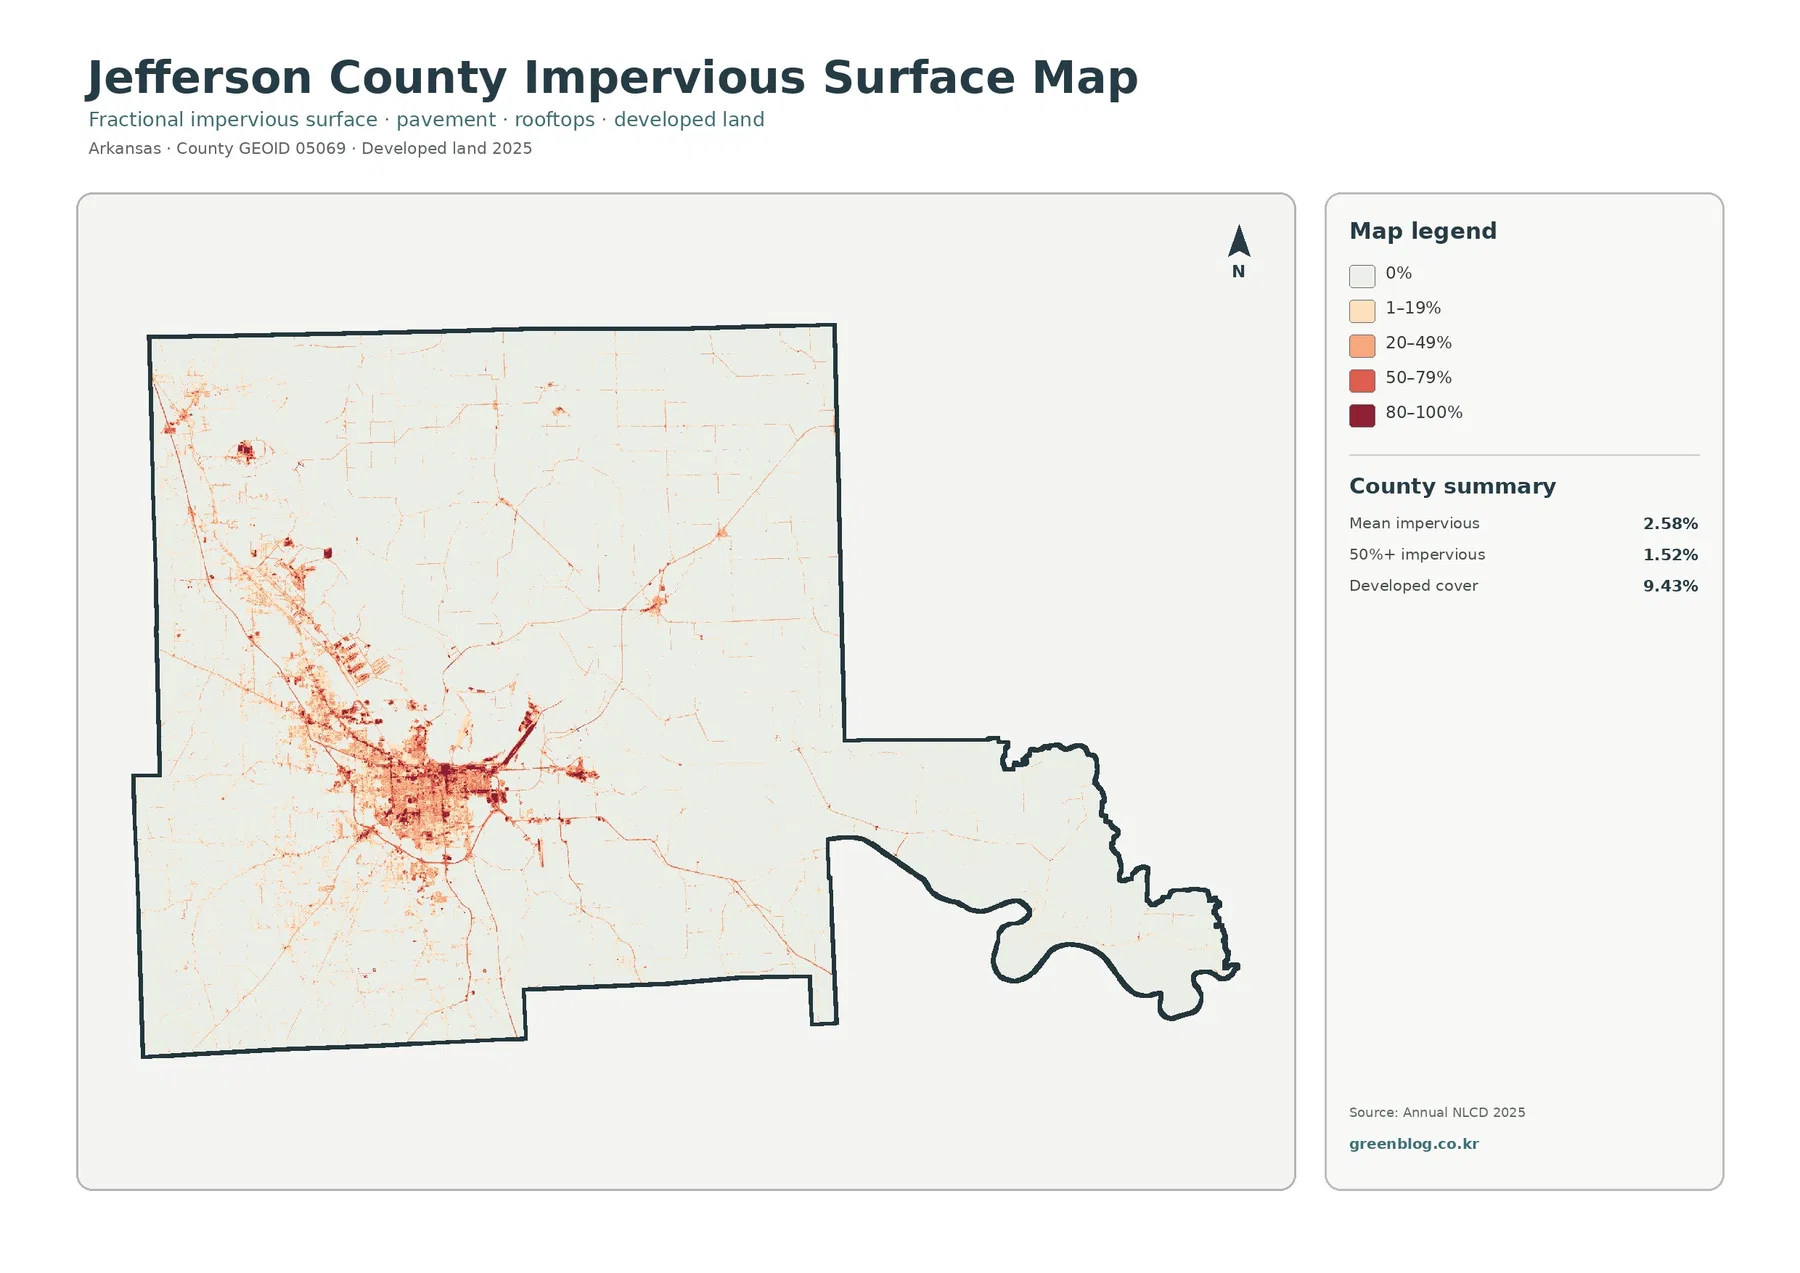
Impervious surface refers to roofs, pavement, parking areas, and similar surfaces that do not readily absorb rainfall. Jefferson County’s mean impervious value is 2.58%, and 1.52% of the county is mapped at 50% impervious or higher. These values are lower than the 9.43% developed-cover share because the two measurements describe different things. A developed land-cover cell may contain grass, trees, or exposed soil along with buildings and pavement, while the impervious layer focuses on the portion of the surface that resists infiltration.
Pine Bluff forms the strongest impervious cluster on the map. Medium and higher values occupy a comparatively broad urban patch, with lighter linear features extending outward. Smaller concentrations also appear toward White Hall and around other settlements, but they do not approach the size of the Pine Bluff cluster. This focused map is useful for a discussion of built surfaces, urban stormwater context, or the difference between a developed land-cover class and actual impervious cover. It does not establish why development occurred in a particular location, so proximity to a road should be described as an association rather than a cause.
The 1985–2025 map marks where land-cover classes differ
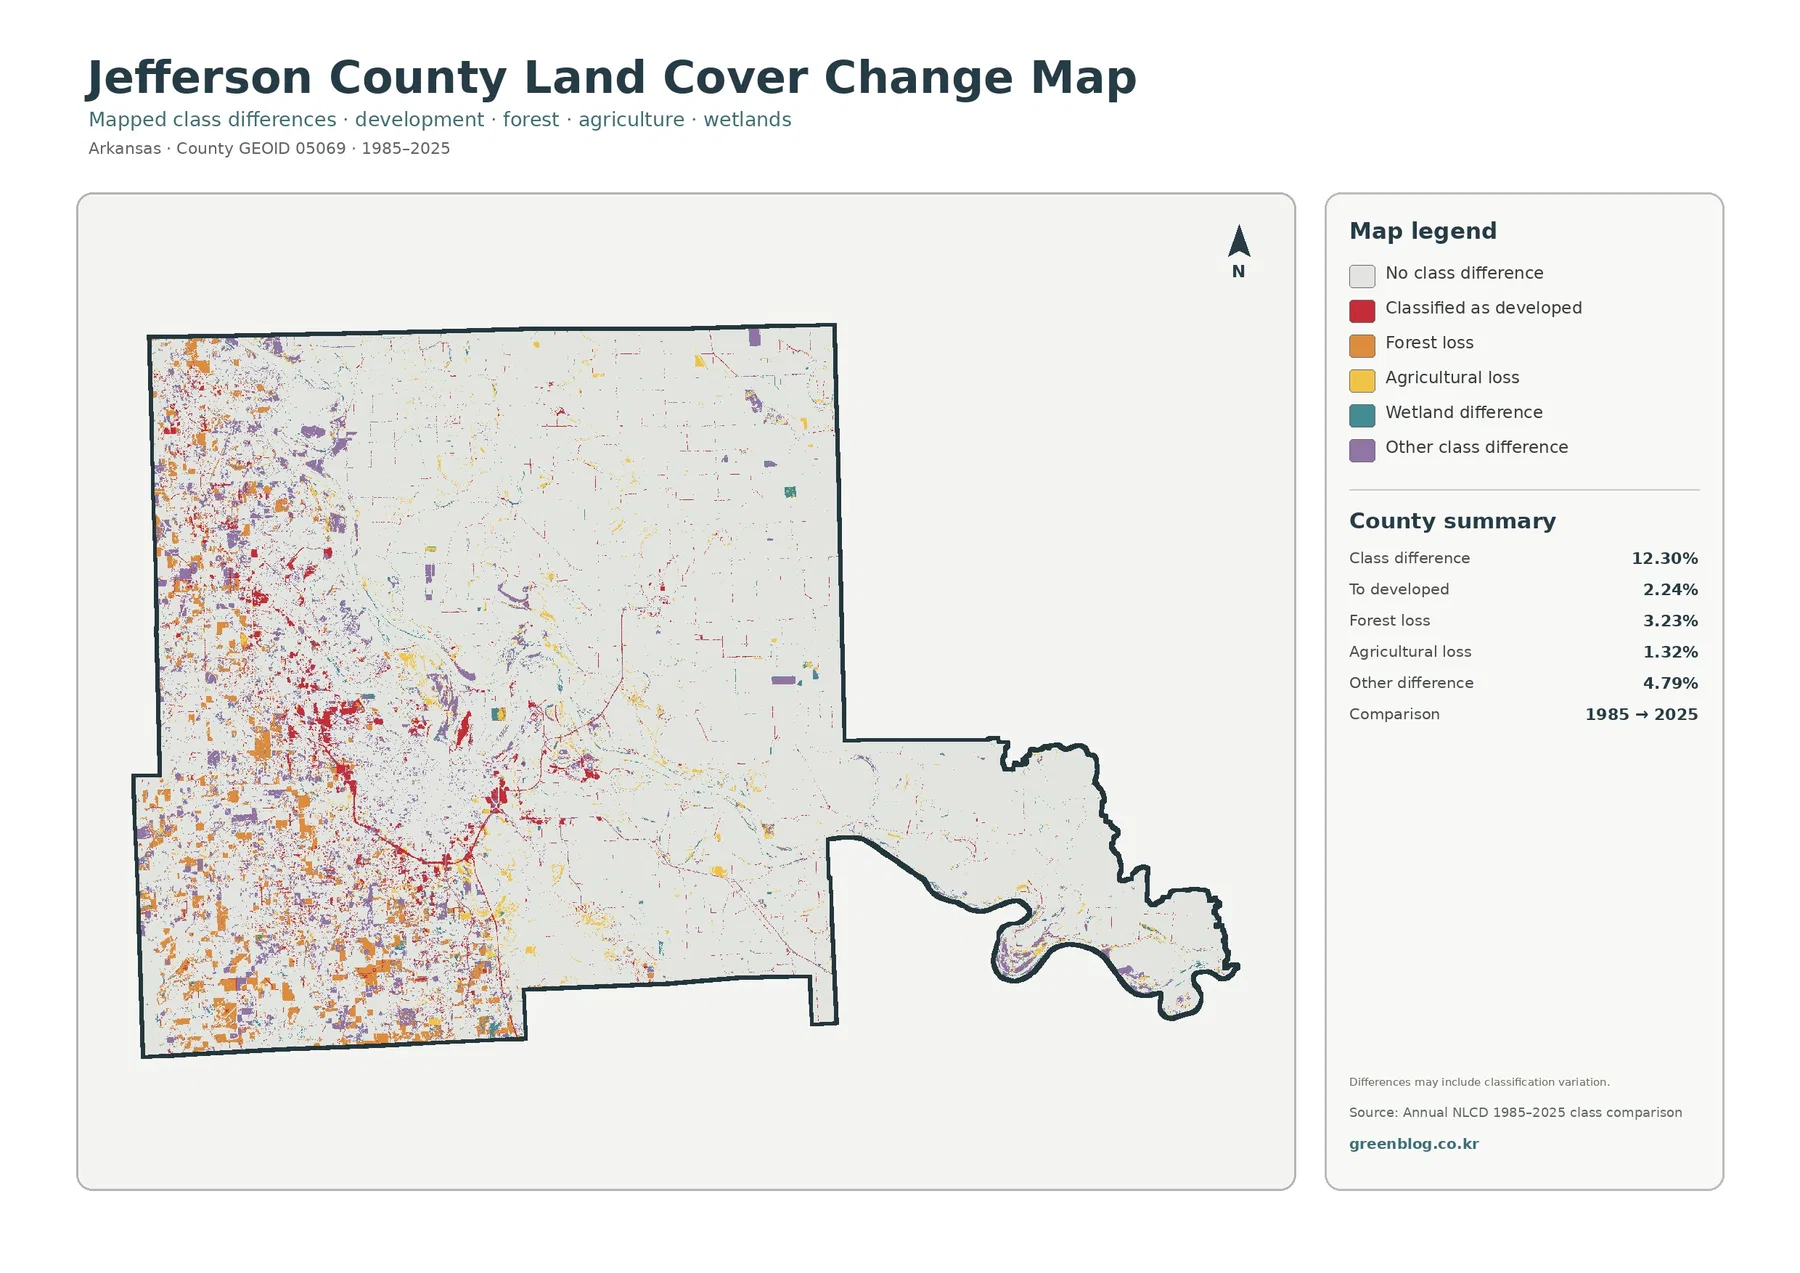
The change comparison marks class differences across 12.30% of the county between 1985 and 2025. The supplied summary identifies 2.24% as a shift to developed cover, 3.23% as forest loss, 1.32% as agricultural loss, and 4.79% as other difference. A wetland-difference category appears in the legend, but the package does not provide a separate verified percentage for that category. An exact wetland-change number therefore should not be inferred from the colors alone.
Development-related difference colors appear most often around Pine Bluff and along some outward corridors. Forest-loss colors are more noticeable in parts of the west and southwest, where current forest cover is also concentrated. Agricultural-loss and other-difference cells are scattered through the larger farming landscape as smaller patches. Most of the county remains in the no-class-difference category for this two-date comparison, so the overall pattern is one of localized changes rather than a complete countywide transformation.
A class difference is not the same as a verified explanation of what happened on the ground. A cell labeled as forest loss means the two mapped dates assign different classes; it does not by itself show whether the cause was timber harvest, construction, agriculture, natural disturbance, or a classification difference. The same caution applies to a shift toward developed cover. Historical aerial imagery, local planning records, or other site-specific evidence is needed before assigning a cause to a particular highlighted location.
How to compare the river, farming areas, and built surfaces
For most readers, the general land-cover map is the best starting point because it places the county’s major classes in the same frame. Once the broad pattern is clear, the forest-and-farmland map can simplify the rural contrast, while the impervious map isolates the built surface around Pine Bluff. The change map serves a different purpose: it identifies locations where the two reference years do not share the same class. Switching between maps at the same location helps prevent an overly simple interpretation based on one color layer.
A presentation about Jefferson County agriculture, for example, can pair the 49.27% agricultural share with the visible eastern concentration of farmland and the wetland corridors that divide it. A lesson about urban surfaces can compare the 9.43% developed class with the much lower 2.58% mean impervious value and use Pine Bluff as the clearest visual example. For a watershed or environmental-education topic, the Arkansas River and wetland distribution provide the geographic context, while the impervious map adds information about where built surfaces are most concentrated.
Downloading and using the four supplied JPG maps
The ZIP contains the four supplied original JPG maps: 2025 general land cover, forest and farmland, impervious/developed land, and the 1985–2025 land-cover change comparison. The asset manifest records each original at 2480×1754 pixels. The WebP versions displayed in the article are separate browser previews, so the JPG archive is the appropriate choice when the map needs to be placed into a slide deck, handout, reference document, or other project outside the webpage.
Choose the image that matches the question you are trying to answer. Use the general map for the overall county pattern, the forest-and-farmland map for a simpler rural comparison, and the impervious map when the focus is the built surface around Pine Bluff. The change map is useful for showing where classes differ across the long comparison period, provided the accompanying text makes clear that the colors do not prove a cause. A single project does not need to use all four maps if one or two views communicate the topic more clearly.
What the maps cannot tell you
Land cover describes the physical surface assigned by a remote-sensing classification, such as forest, agriculture, water, wetland, or developed cover. It is not a zoning map, ownership map, parcel map, or statement about what a property is legally allowed to contain. An agricultural cell does not prove that a parcel is zoned for agriculture, and a developed cell does not identify whether the land is residential, commercial, industrial, or public. Parcel-level decisions require the appropriate local records.
Annual NLCD is raster data, meaning the landscape is represented as a grid of cells rather than surveyed property polygons. At a commonly used 30-meter land-cover scale, a field edge, tree line, road, ditch, and building can fall within the same cell. That mixed pixel is assigned a representative class, so narrow features and precise boundaries may be simplified, shifted, or absorbed into a neighboring category. The maps are therefore suitable for county-scale comparison and communication, not for precise property measurement.
The dates also set an important limit. The current distribution on this page is based on the 2025 classification, while the change view compares 1985 with 2025. Development, farming changes, vegetation shifts, or restoration after 2025 may not appear. A location that changed more than once during the forty-year interval could also end with a class similar to its starting condition. If the present condition of a specific site matters, compare the map with recent aerial imagery and current local information.
Frequently Asked Questions
What is the largest 2025 land-cover class in Jefferson County, Arkansas?
Agriculture is the largest class at 49.27%. Forest accounts for 18.69%, wetlands 15.77%, developed cover 9.43%, and water 3.53% in the supplied county summary.
Why is developed cover 9.43% but mean impervious surface only 2.58%?
A developed land-cover class may include lawns, trees, soil, and other permeable surfaces in addition to roofs and pavement. The impervious layer measures the share of surfaces that resist water infiltration, so the two percentages describe different things.
Does the 12.30% class difference from 1985 to 2025 equal confirmed real-world change on every highlighted cell?
No. It is the share of cells assigned different classes in the two-date comparison. Real landscape change can contribute, but mixed pixels, imagery, and classification variation may also affect the result, so site-specific conclusions need additional evidence.
Map File Information
Jefferson County Land Cover Map JPG Files
- Included Files: Land cover, forest/farmland, impervious/developed land, and 1985–2025 land-cover change maps
- File Type: JPG maps in one ZIP archive
- Intended Use: Printing, education, presentations, and map-based projects
Related Maps
- A Craighead County Arkansas Land Cover Map
- Arkansas County Arkansas Land Cover Map
- Ashley County Arkansas Land Cover Map
Sources and reference material
- MRLC Annual NLCD Data — official access to Annual NLCD datasets and related land-cover products.
- USGS Annual NLCD Land Cover Classification — USGS documentation explaining the land-cover classification system and class meanings.
- U.S. Census Bureau TIGER/Line Shapefiles — official geographic boundary data used for county-scale mapping.
- Jefferson County, Arkansas — Residents — county background on Pine Bluff, the western pine-covered hills, eastern Delta farmland, and local wet environments.
- Jefferson County Cooperative Extension Office — University of Arkansas System information on agriculture, natural resources, soils, row crops, forage, and stormwater in Jefferson County.
- Jefferson County — Cities and Towns — local context for Pine Bluff, the Arkansas River, Lake Langhofer, and communities in the county.
Green Map creates custom-edited map images using open geographic data sources such as geoBoundaries, Natural Earth, OpenStreetMap, and government open data.
These maps are edited visual materials, not raw data files, and are provided for education, documents, presentations, and graphic reference.