The Hot Spring County Arkansas Land Cover Map set shows a county where forest is the dominant 2025 surface class, covering 61.45% of the mapped area. Forest is not the only story, however. Agricultural openings, grassland and shrubland, small wet areas, and a concentrated developed area near the county’s main population center break up the green background. Comparing those patterns across four views makes it easier to see how a heavily wooded county can still contain distinct farming and settlement zones.
This page includes overall land cover, a forest-and-farmland view, impervious surface and developed land, and a 1985–2025 class-difference view. The four original JPG files are also available together in one download. They can be used for classroom work, county comparisons, reports, presentations, and general reference. Land cover describes what is visible on the ground surface in a classified satellite product; it does not establish zoning, ownership, parcel boundaries, or development rights.
Table of Contents
A Forest-Dominant County with Several Contrasting Pockets
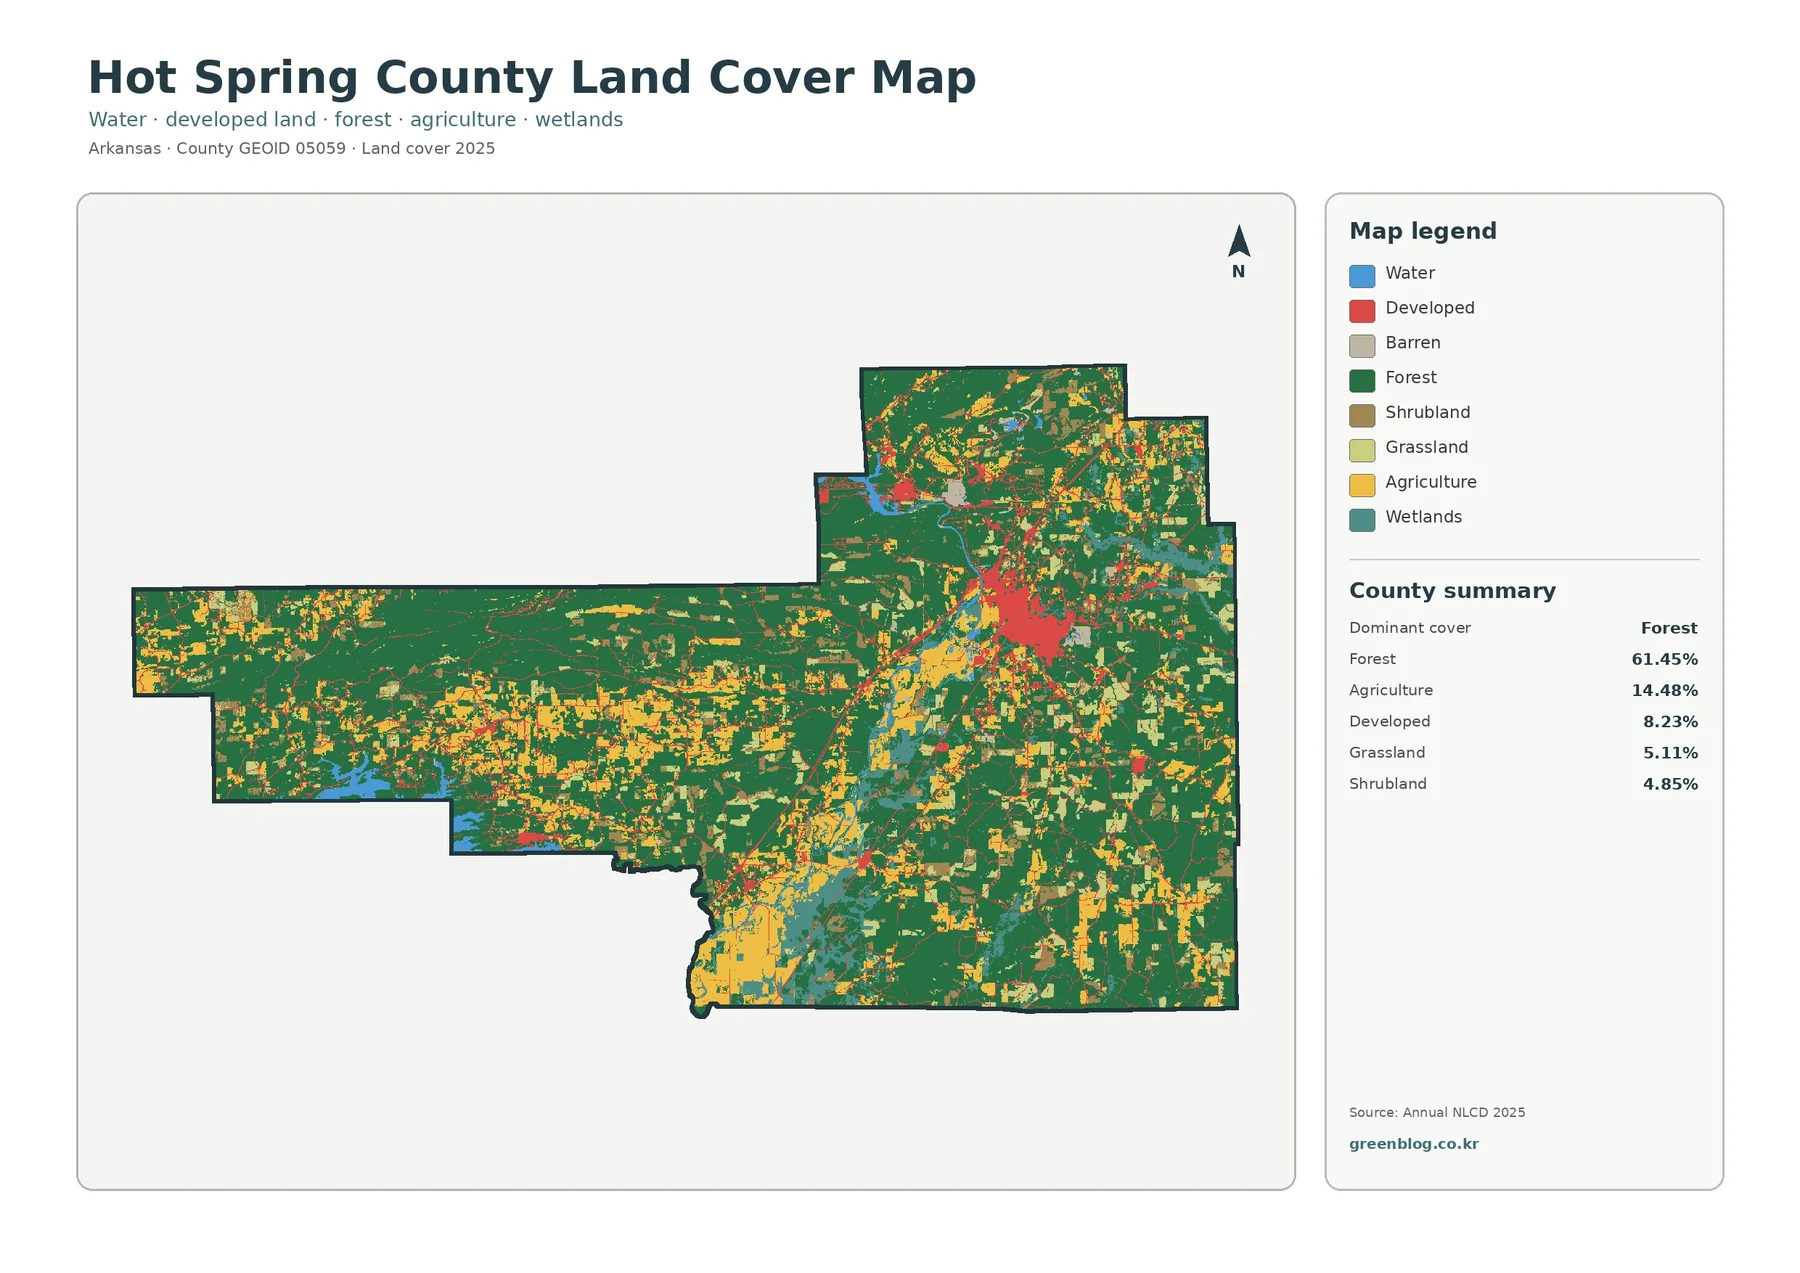
The county summary lists forest at 61.45%, agriculture at 14.48%, developed land at 8.23%, grassland at 5.11%, and shrubland at 4.85%. The simplified forest-and-farmland view also reports 4.21% wetlands and 1.25% water. Those figures make forest the clear leading class, yet the image is far from uniform. Large wooded blocks are crossed by agricultural openings, developed patches, and smaller wet or open areas, especially toward the central and eastern parts of the county.
The western half contains some of the broadest continuous green areas. Agriculture there tends to appear as smaller yellow patches and narrow openings within or along forest edges. Moving toward the center and east, the mix becomes more fragmented: developed red, agricultural yellow, and lighter open-cover colors appear more frequently. The northeastern extension is also largely wooded, but it contains a finer mixture of open and developed classes than the broad forest blocks farther west.
One red concentration stands out in the central-eastern part of the county. Hot Spring County’s official website identifies Malvern as the county seat and describes the community as being at the eastern edge of the Ouachita Mountains. The supplied image does not label city boundaries, so the red cluster should not be treated as an exact municipal outline. Still, the official location of Malvern provides a useful reference for understanding why a relatively compact developed core appears within a county that is otherwise mostly forested.
Water and wetlands occupy much smaller shares than forest or agriculture, but their placement still matters. Blue water patches and teal wetland areas occur in several parts of the county rather than forming one dominant countywide band. Narrow water bodies and complicated shorelines can be generalized by 30-meter raster cells, so the image is best for broad landscape context. Anyone who needs the precise edge of a lake, stream, floodplain, or regulated wetland should consult dedicated hydrography and site-specific records.
Forest, Farmland, and Open Cover in the Same Landscape
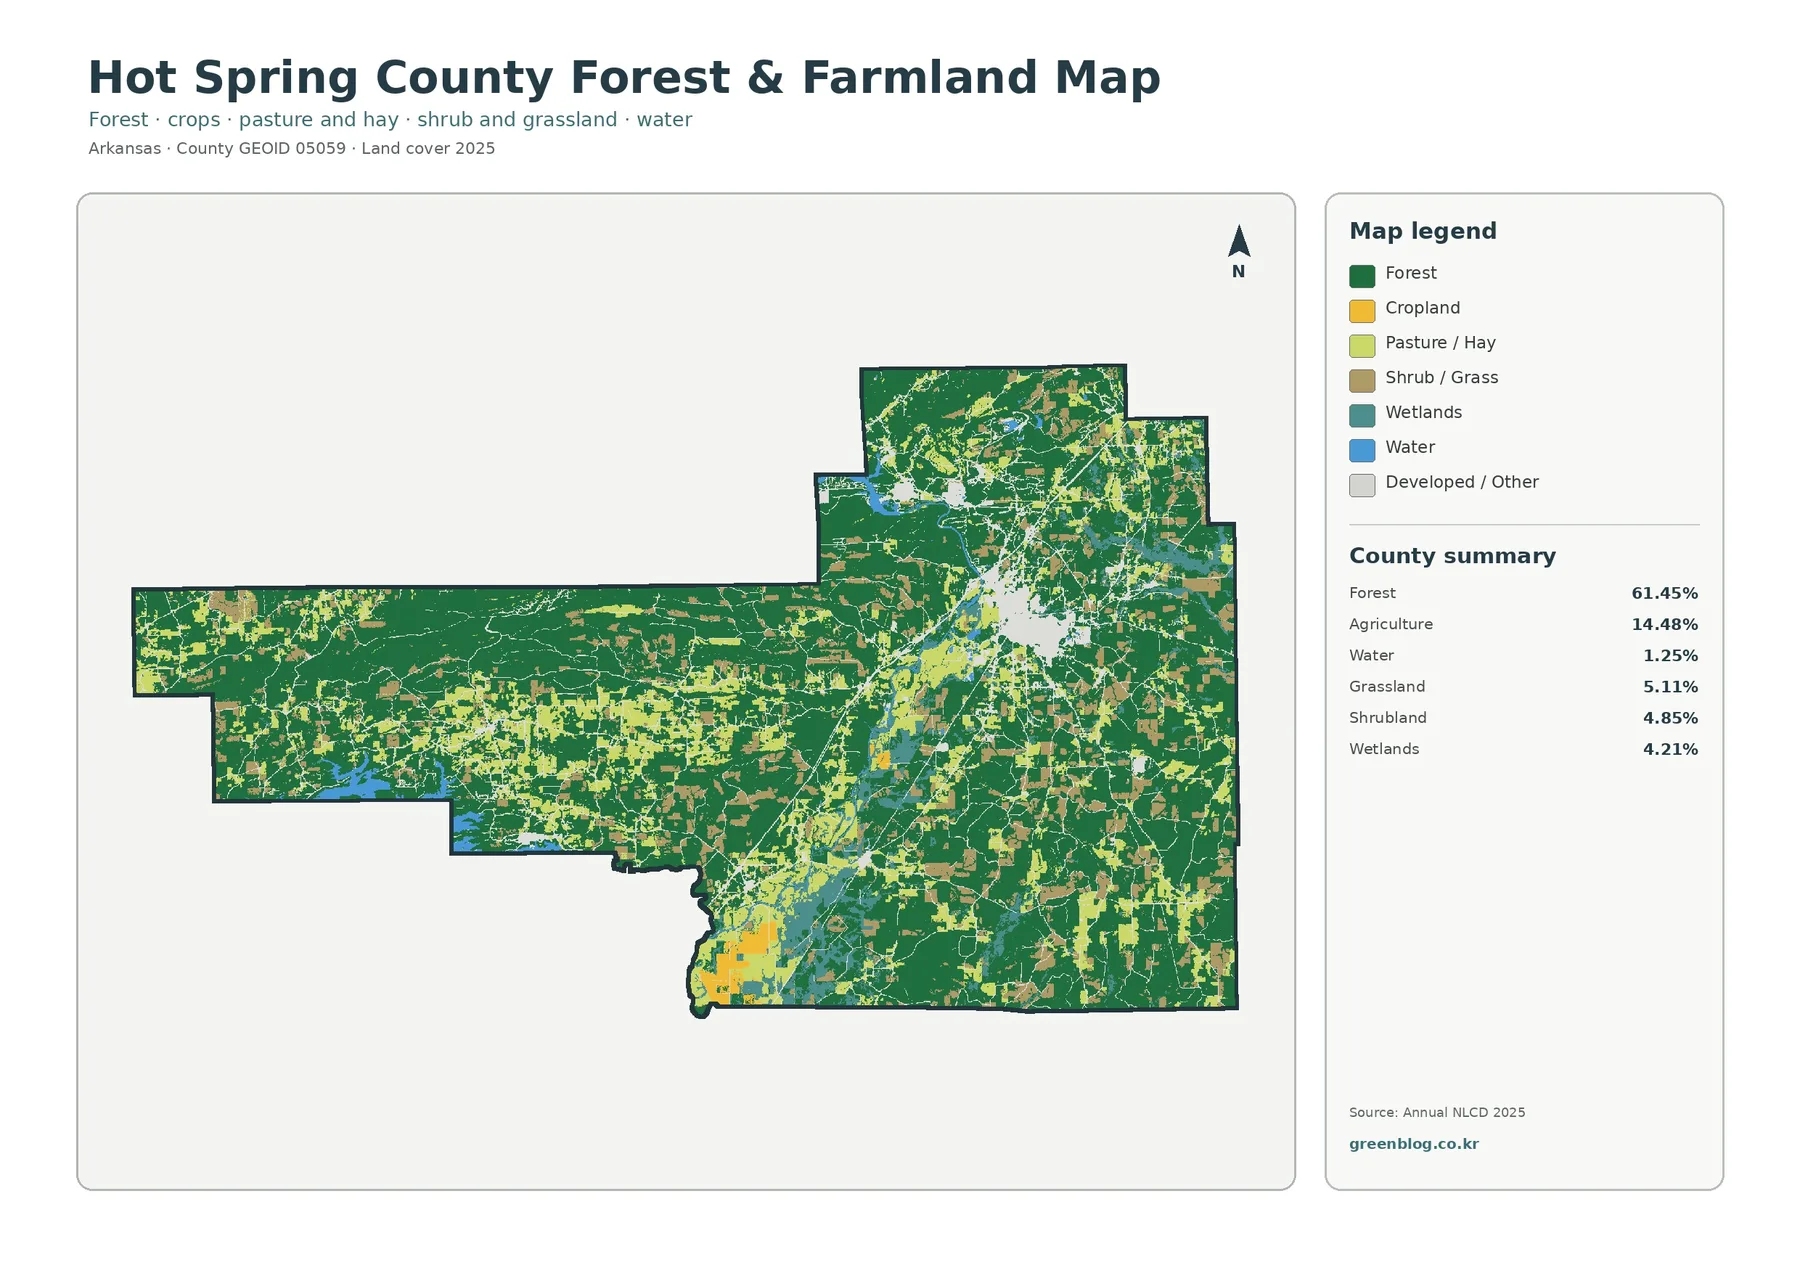
Removing most of the developed detail makes the county’s rural pattern easier to compare. Forest remains 61.45% and agriculture 14.48%, while grassland contributes 5.11%, shrubland 4.85%, wetlands 4.21%, and water 1.25%. The green forest background is therefore interrupted not only by cropland but also by pasture-like and shrubby open cover. These smaller classes are important because they create transition zones between large wooded blocks, agricultural fields, and settlement areas.
Agricultural cover is distributed as a patchwork rather than one uninterrupted plain. Yellow areas recur across the western, central, southern, and eastern parts of the county, but many are separated by forest. Open grass and shrub classes often occur beside those agricultural patches or between wooded areas. This arrangement is useful when comparing Hot Spring County with more intensively farmed Arkansas counties, where agriculture can dominate the entire image instead of appearing as a secondary class inside a forested landscape.
The class labels should be read carefully. “Agriculture” describes a mapped surface category and does not identify a crop, farm operator, parcel ownership, or legal agricultural zoning. Likewise, the forest class does not tell the reader whether a stand is pine or hardwood, public or private, recently managed or mature. The imagery is well suited to county-scale comparison, but questions about a specific property require cadastral, forestry, agricultural, or field information that is not contained in these four graphics.
For teaching or a report, it helps to discuss percentage and pattern separately. The 61.45% forest figure tells how much of the county falls into the forest class, while the image shows whether that forest is continuous or broken into smaller pieces. Agriculture works the same way: 14.48% gives a countywide share but says nothing by itself about whether fields are clustered or scattered. Combining the number with the visible patchwork makes the explanation more faithful to the actual data.
Hard Surfaces Concentrate Near the Malvern Area
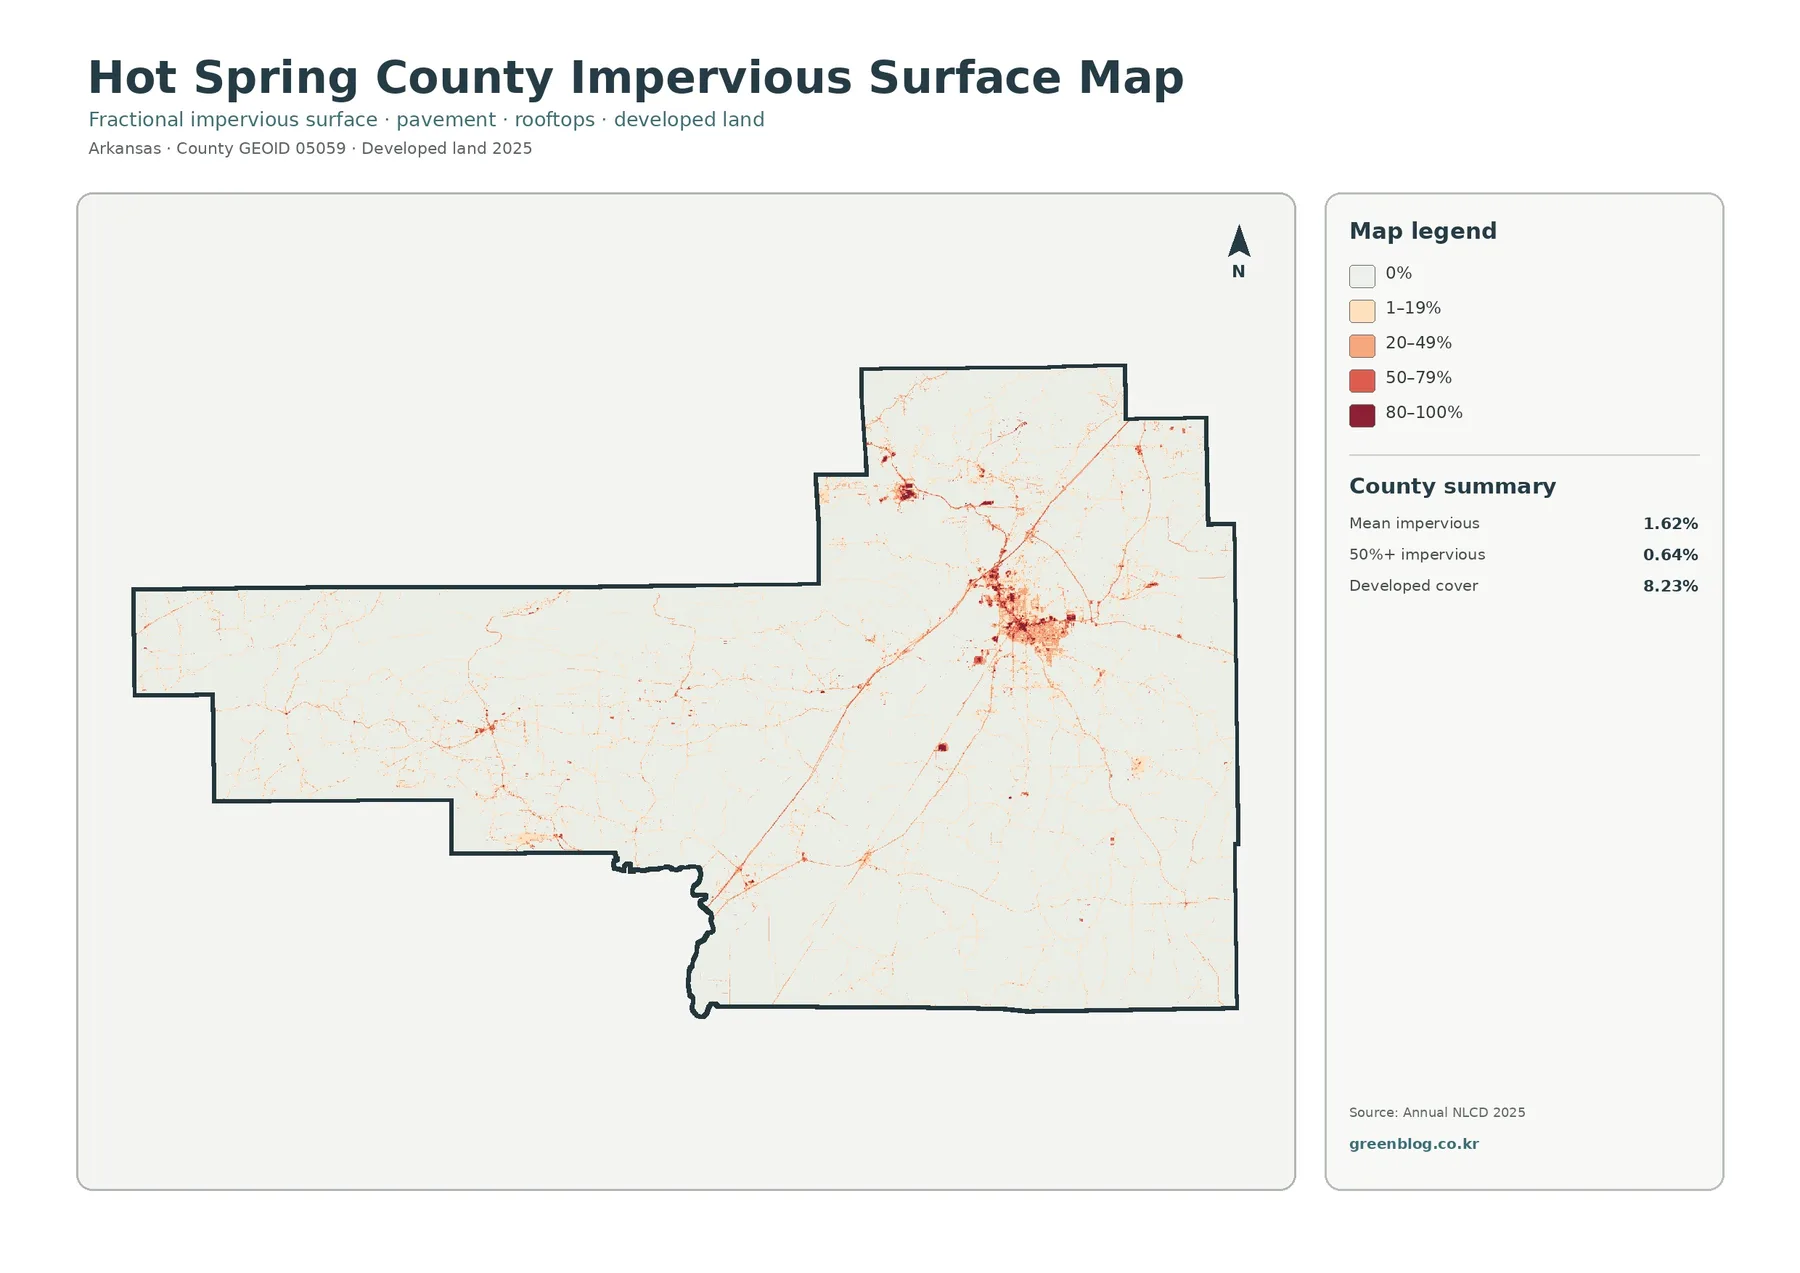
Impervious surface means pavement, rooftops, and other hard surfaces that do not readily absorb water. Hot Spring County has a mean impervious value of 1.62%, and 0.64% of the county is mapped with at least 50% impervious cover inside a cell. Those values are much lower than the 8.23% developed-land share. The difference is expected because a developed class can include lawns, trees, open ground, and other permeable surfaces along with buildings and pavement.
The strongest dark-red cluster lies in the central-eastern part of the county, where the broader land-cover view also shows the largest developed concentration. Hot Spring County and the City of Malvern both identify Malvern as the county seat, making it a useful geographic reference for this pattern. Thin orange and red lines extend outward from the main cluster, suggesting transportation and settlement corridors in a general sense, but the image does not provide road names or traffic information.
Smaller hard-surface traces appear elsewhere, including scattered lines and tiny clusters through the western and southern parts of the county. Most of the county, however, remains nearly white on this view, consistent with the dominance of forest and lower-density rural cover. This contrast is useful when a reader wants to separate “developed land” from the places where roofs and pavement are actually concentrated. It also explains why a county can have an 8.23% developed class while retaining a very low average impervious percentage.
Impervious cover can influence how rainfall moves across a landscape, but this graphic is not a runoff or flood-risk model. It does not include rainfall intensity, elevation, soils, storm drains, channel capacity, or current water levels. For environmental planning, the layer can flag places where hard surfaces are concentrated and where more detailed study might be useful. Engineering, drainage, or hazard decisions need additional datasets and site-specific analysis.
What Changed in the Classification between 1985 and 2025
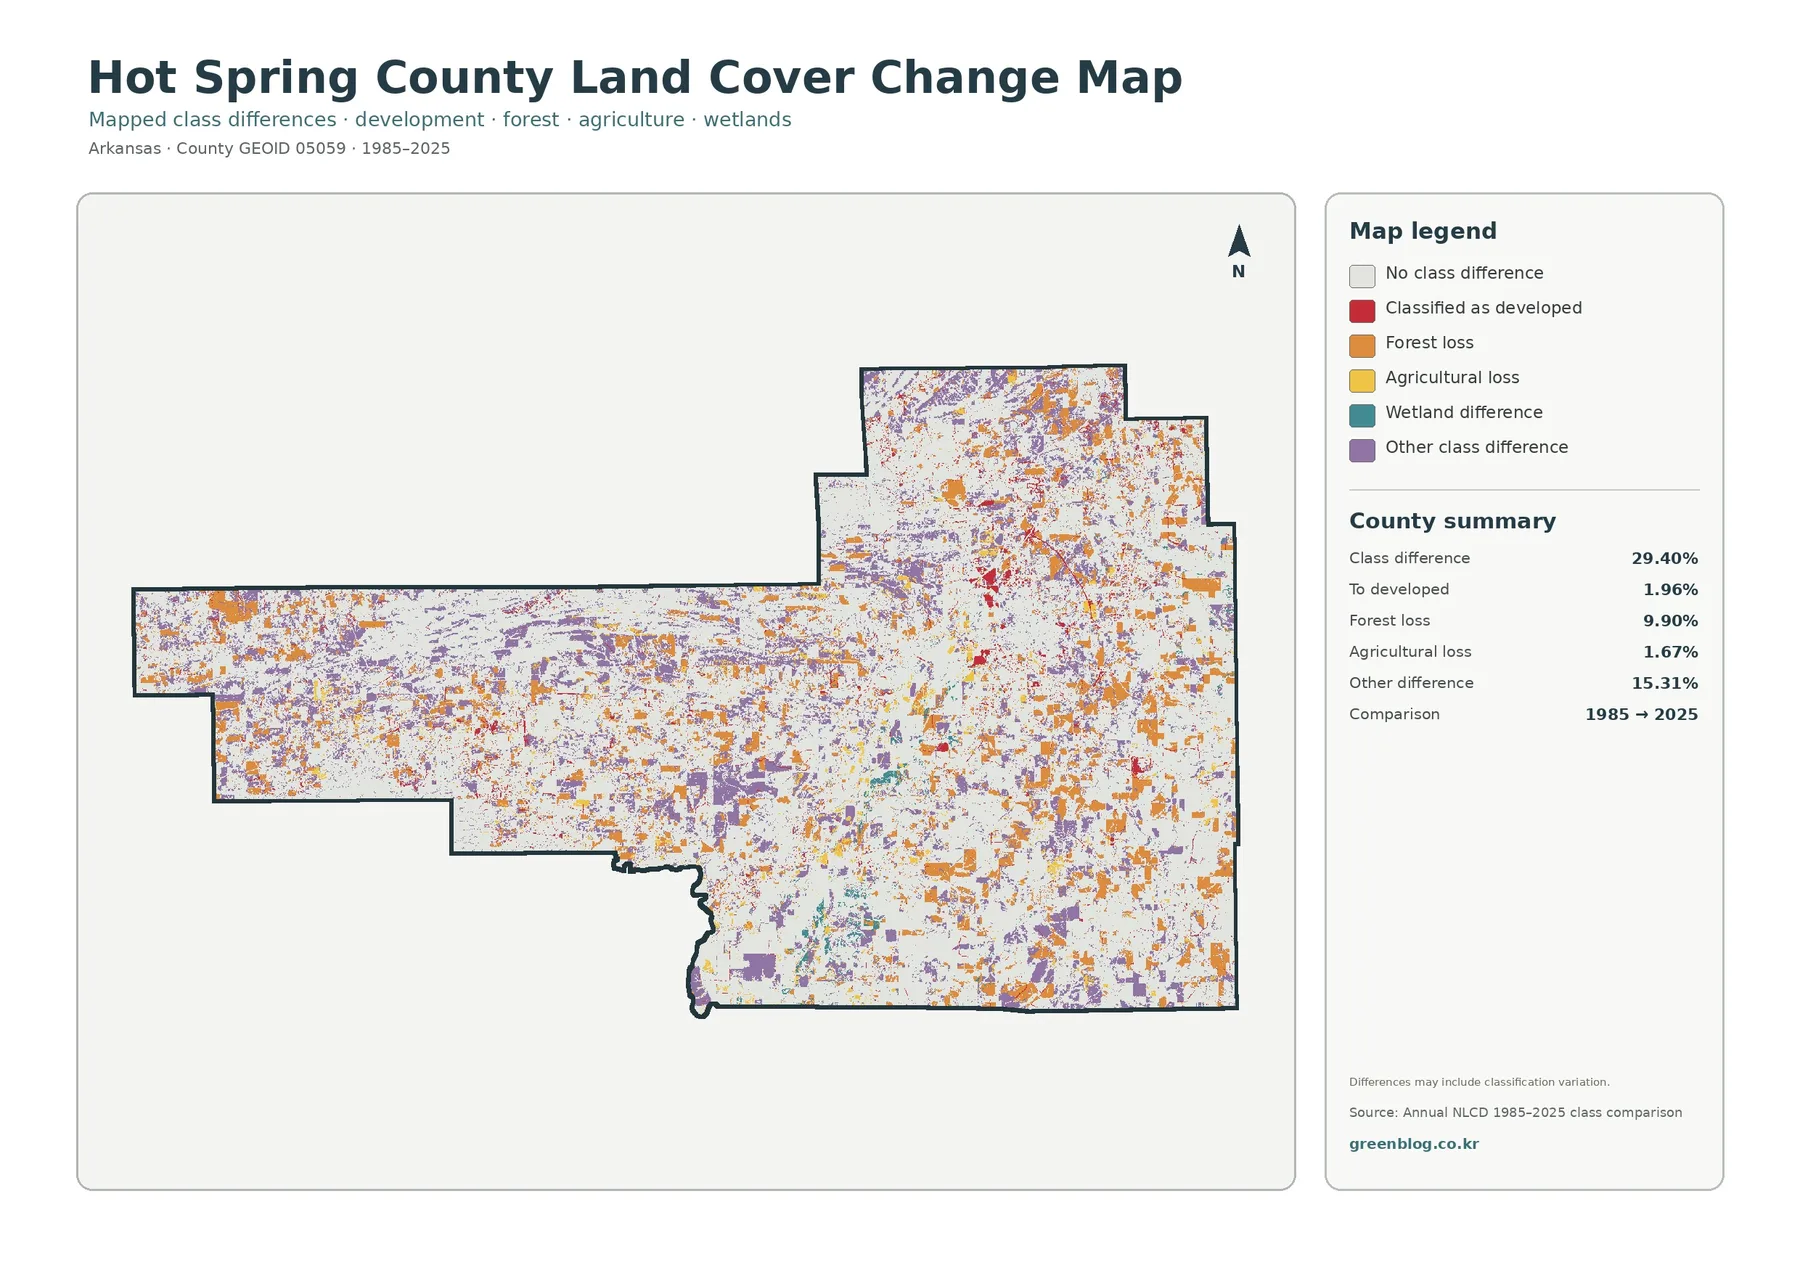
The comparison layer reports a 29.40% class difference between 1985 and 2025. Its summary separates 1.96% classified as change to developed land, 9.90% forest loss, 1.67% agricultural loss, and 15.31% other class difference. A smaller wetland-difference component makes up the remaining portion. The most important reading rule is simple: 29.40% does not mean that 29.40% of Hot Spring County became developed. Development is only one part of the total difference.
Orange forest-loss cells are scattered through much of the county, including western, northeastern, and southeastern areas. Purple “other class difference” is even more widespread and appears as many small patches and bands. Red development-change cells are more localized, with stronger concentrations around the present-day developed core and along some linear features. Yellow agricultural-loss cells occur in smaller patches. The combination suggests multiple kinds of mapped change rather than one simple countywide transition.
The 9.90% forest-loss category should not automatically be interpreted as permanent clearing. A cell can change class because of actual land-cover change, forest management and regrowth, agricultural conversion, construction, seasonal moisture, image characteristics, or classification differences between years. The graphic itself warns that mapped differences may include classification variation. A location that matters for a project should therefore be checked against aerial imagery, field records, and more detailed time-series information before a cause is assigned.
The change layer is most useful after the 2025 views have established the current landscape. Readers can compare forest-loss cells with today’s large forest blocks, development-change cells with current impervious concentrations, and agricultural-loss cells with remaining agricultural patches. That sequence turns the change layer into a guide for where to investigate further. It should not be used by adding percentages from different products together or treating spatial overlap as proof that one change caused another.
County Context at the Eastern Edge of the Ouachita Mountains
Hot Spring County’s official history page places Malvern at the eastern edge of the Ouachita Mountains and notes the area’s long connection to agricultural and mineral resources. That description offers useful background for the land-cover contrast visible here: large forested areas remain prominent, while the central-eastern county seat area forms a compact developed concentration. The official history is context rather than a direct explanation of every colored cell, so the mapped pattern should still be described from the supplied images themselves.
The county name is singular—Hot Spring County—which can easily be confused with the nearby city of Hot Springs. These files specifically cover Hot Spring County, Arkansas, with county GEOID 05059. Keeping that distinction in filenames, captions, and comparison tables is useful when assembling statewide datasets. It also prevents a common mistake in which information about Hot Springs city or Garland County is attached to Hot Spring County by name alone.
Malvern is identified by both the county and city websites as the county seat. That makes it a reasonable reference point for the largest developed and impervious concentration, but the raster image does not draw the municipal boundary. Some developed cells around the cluster may fall outside city limits or belong to nearby communities. “Malvern-area development” is therefore more precise for this countywide graphic than claiming that every red cell belongs to the city itself.
Choose Each View for a Different Question
Start with overall 2025 cover when the goal is a general description. It places forest, agriculture, development, grassland, shrubland, wetlands, and water in one frame and quickly establishes the 61.45% forest majority. Switch to the forest-and-farmland view when the question concerns the continuity of wooded areas or the placement of agricultural and open-cover patches. The simplified legend makes transitions among rural classes easier to follow.
The impervious layer is better for settlement questions because it isolates the harder surfaces associated with roads and buildings. Comparing 8.23% developed cover with a 1.62% mean impervious value demonstrates why those measures are not interchangeable. The image also highlights the county’s main developed concentration without the visual weight of the forest colors. That can be useful in a presentation about settlement footprint or surface sealing.
Use the 1985–2025 comparison after the present-day pattern is clear. A classroom exercise might pair current overall cover with the change view, while a forest-focused report could pair the forest-and-farmland image with the change layer. Selecting two views around one question usually communicates more clearly than placing all four images side by side without explanation. The complete set remains useful when a project needs current composition, rural cover, hard surfaces, and long-term comparison together.
Use County-Scale Classification at the Right Level of Detail
Annual NLCD is raster data based on 30-meter cells. A raster divides the landscape into a regular grid and assigns a representative value or class to each cell. A single cell can contain trees, grass, a driveway, a small building, and a narrow stream, even though the land-cover product must summarize that mixture. As a result, a colored boundary should not be expected to line up exactly with a parcel line, fence, road edge, or stream bank.
Mixed cells matter most where cover changes rapidly, such as the fringe of the Malvern-area development, the edge between forest and agricultural openings, and small wetland or water features. Narrow roads and channels may be weakly represented or absorbed into a neighboring class. The data work well for county and regional context, but they are not a substitute for a survey, engineering plan, or parcel-level land inventory.
Land cover is also different from legal land use. An agricultural color does not establish agricultural zoning or identify a specific crop. A developed color does not prove a permit, ownership interest, or building footprint. A wetland color does not by itself establish jurisdiction under state or federal wetland rules. Property and regulatory questions should be answered with the appropriate county, state, and federal records rather than this generalized classification.
The 2025 graphics are a snapshot of a mapped year, not a guarantee that every location still looks the same today. Construction, forest harvest and regrowth, farming, water levels, and other changes can alter the surface after the source period. When a present-day decision depends on exact conditions, use these images for background and then check current aerial photography, field observations, and official records.
Download the Four Original JPG Files
The download archive contains one original JPG for each view: 2025 overall land cover, forest and farmland, impervious surface and developed land, and 1985–2025 mapped class differences. Each supplied original is 2480 × 1754 pixels. The files are kept at their source dimensions rather than enlarged to imply a higher print resolution. They are practical for documents, slides, classroom handouts, county comparisons, and reference graphics.
Frequently Asked Questions
Does 61.45% forest mean Hot Spring County is one continuous woodland?
No. Forest is the largest class, but agriculture, developed land, grassland, shrubland, wetlands, and water repeatedly interrupt or border wooded areas. Large forest blocks are especially visible in the western and central parts, while the central-eastern area has a more fragmented mix around the main developed concentration.
Why is developed cover 8.23% while mean impervious surface is only 1.62%?
Developed classes can include lawns, trees, open ground, and other permeable surfaces in addition to roofs and pavement. Impervious data focus more directly on hard surfaces within each cell, so the countywide mean is expected to be much lower than the full developed-land share.
Does the 29.40% class difference mean 29.40% of the county was developed?
No. Change to developed land is listed at 1.96%. The total also includes 9.90% forest loss, 1.67% agricultural loss, wetland differences, and 15.31% other class difference. The 29.40% value describes cells whose classifications differ between 1985 and 2025; it is not a single development-growth rate.
Map File Information
The ZIP contains the four original Hot Spring County JPG views used on this page for overall cover, forest/farmland, impervious surface, and mapped change.
- Included Files: Four original JPG maps
Related Maps
- A Craighead County Arkansas Land Cover Map
- Arkansas County Arkansas Land Cover Map
- Ashley County Arkansas Land Cover Map
Sources and Reference Links
- MRLC Annual NLCD Data — annual land-cover data access
- USGS Annual NLCD Land Cover Classification — class definitions and documentation
- Hot Spring County official website — Malvern and county background
- City of Malvern official website — county-seat and community information
- U.S. Census Bureau TIGER/Line — county boundary reference
Green Map creates custom-edited map images using open geographic data sources such as geoBoundaries, Natural Earth, OpenStreetMap, and government open data.
These maps are edited visual materials, not raw data files, and are provided for education, documents, presentations, and graphic reference.