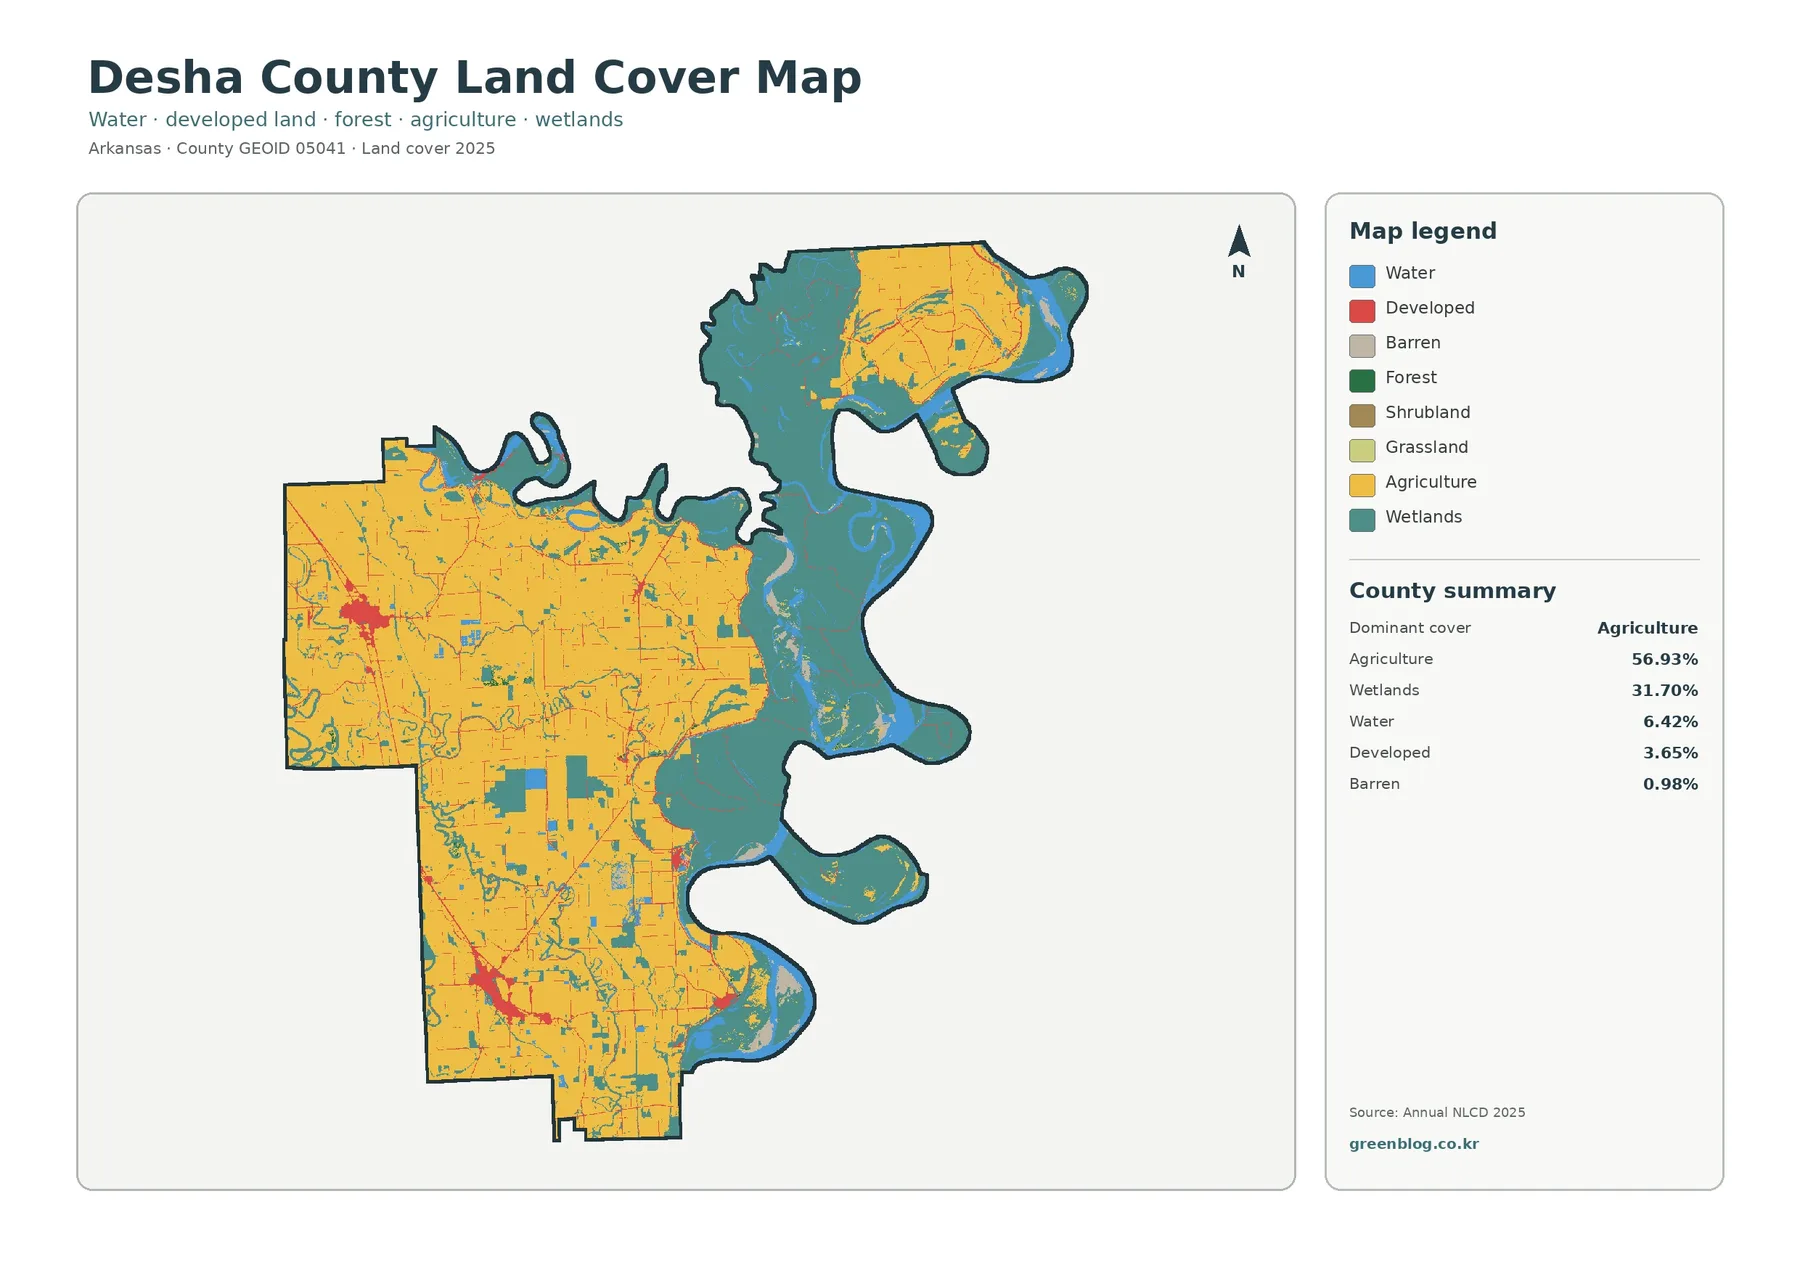
The Desha County Arkansas Land Cover Map set opens with a clear Delta pattern: agriculture covers 56.93% of the county, while wetlands account for another 31.70%. Water adds 6.42%, developed land 3.65%, and barren land 0.98%. The broad western and southern fields contrast sharply with the irregular wetland-and-water complex along the eastern side.
Four original 2480 × 1754 JPG maps are available together in one download: current land cover, forest and farmland, impervious surface, and the 1985→2025 class comparison. The separate views make it easier to use the county for classroom work, agricultural and wetland context, river-corridor discussions, presentations, or a quick reference without forcing every topic onto one graphic.
Table of Contents
Desha County begins with fields, wetlands, and a river-shaped edge
More than half of the 2025 county surface is classified as agriculture. Yellow covers most of the broad western block and continues through much of the southern half. That dominance is easy to miss if attention goes first to the complicated eastern boundary, where wetlands and water create a very different pattern. Reading those two large zones together gives a better county overview than treating each legend color as an isolated statistic.
The Association of Arkansas Counties describes Desha County as rich, flat Delta farmland and identifies the Mississippi River as its eastern boundary. It also notes the county’s position around the White, Arkansas, and Mississippi river system. That local background fits the visible contrast between extensive farm ground and the winding eastern side, but the land-cover image should still be treated as classification evidence rather than a complete hydrologic map.
Developed land represents 3.65% of the county. Instead of forming one continuous urban area, red pixels are concentrated in several clusters, with thin developed lines extending outward along transportation corridors. The University of Arkansas Cooperative Extension office says it serves Dumas, McGehee, Arkansas City, and other county communities. Those town names provide useful geographic context, although the map itself does not label municipal limits.
The river side is not simply “water”
Blue water and teal wetlands sit close together on the eastern side, yet they represent different surfaces. Open water accounts for 6.42%, whereas wetlands cover 31.70%. A reader who combines both colors into one water category would lose one of the most important distinctions in the supplied legend. Wetland classification describes surface cover associated with wet conditions and vegetation; it is not the same thing as permanently open water.
The eastern half contains long wetland corridors, broad patches, narrow channels, and several bends where water and wetland colors alternate. Smaller wet features also cross the agricultural interior. This mix matters because Desha County is not a simple two-color split between dry farmland and a single river. Even within the farm-dominated part of the county, drainage features and wet ground break up the larger yellow blocks.
Legal wetland boundaries should not be inferred from these pixels. The map is designed for county-scale land-cover comparison, not regulatory delineation. A parcel may include several surface types inside one generalized raster cell, and current site conditions can differ from the 2025 classification. Environmental review or permitting requires the appropriate current agency data and, where necessary, field work.
Hard surfaces occupy a small share but form recognizable clusters
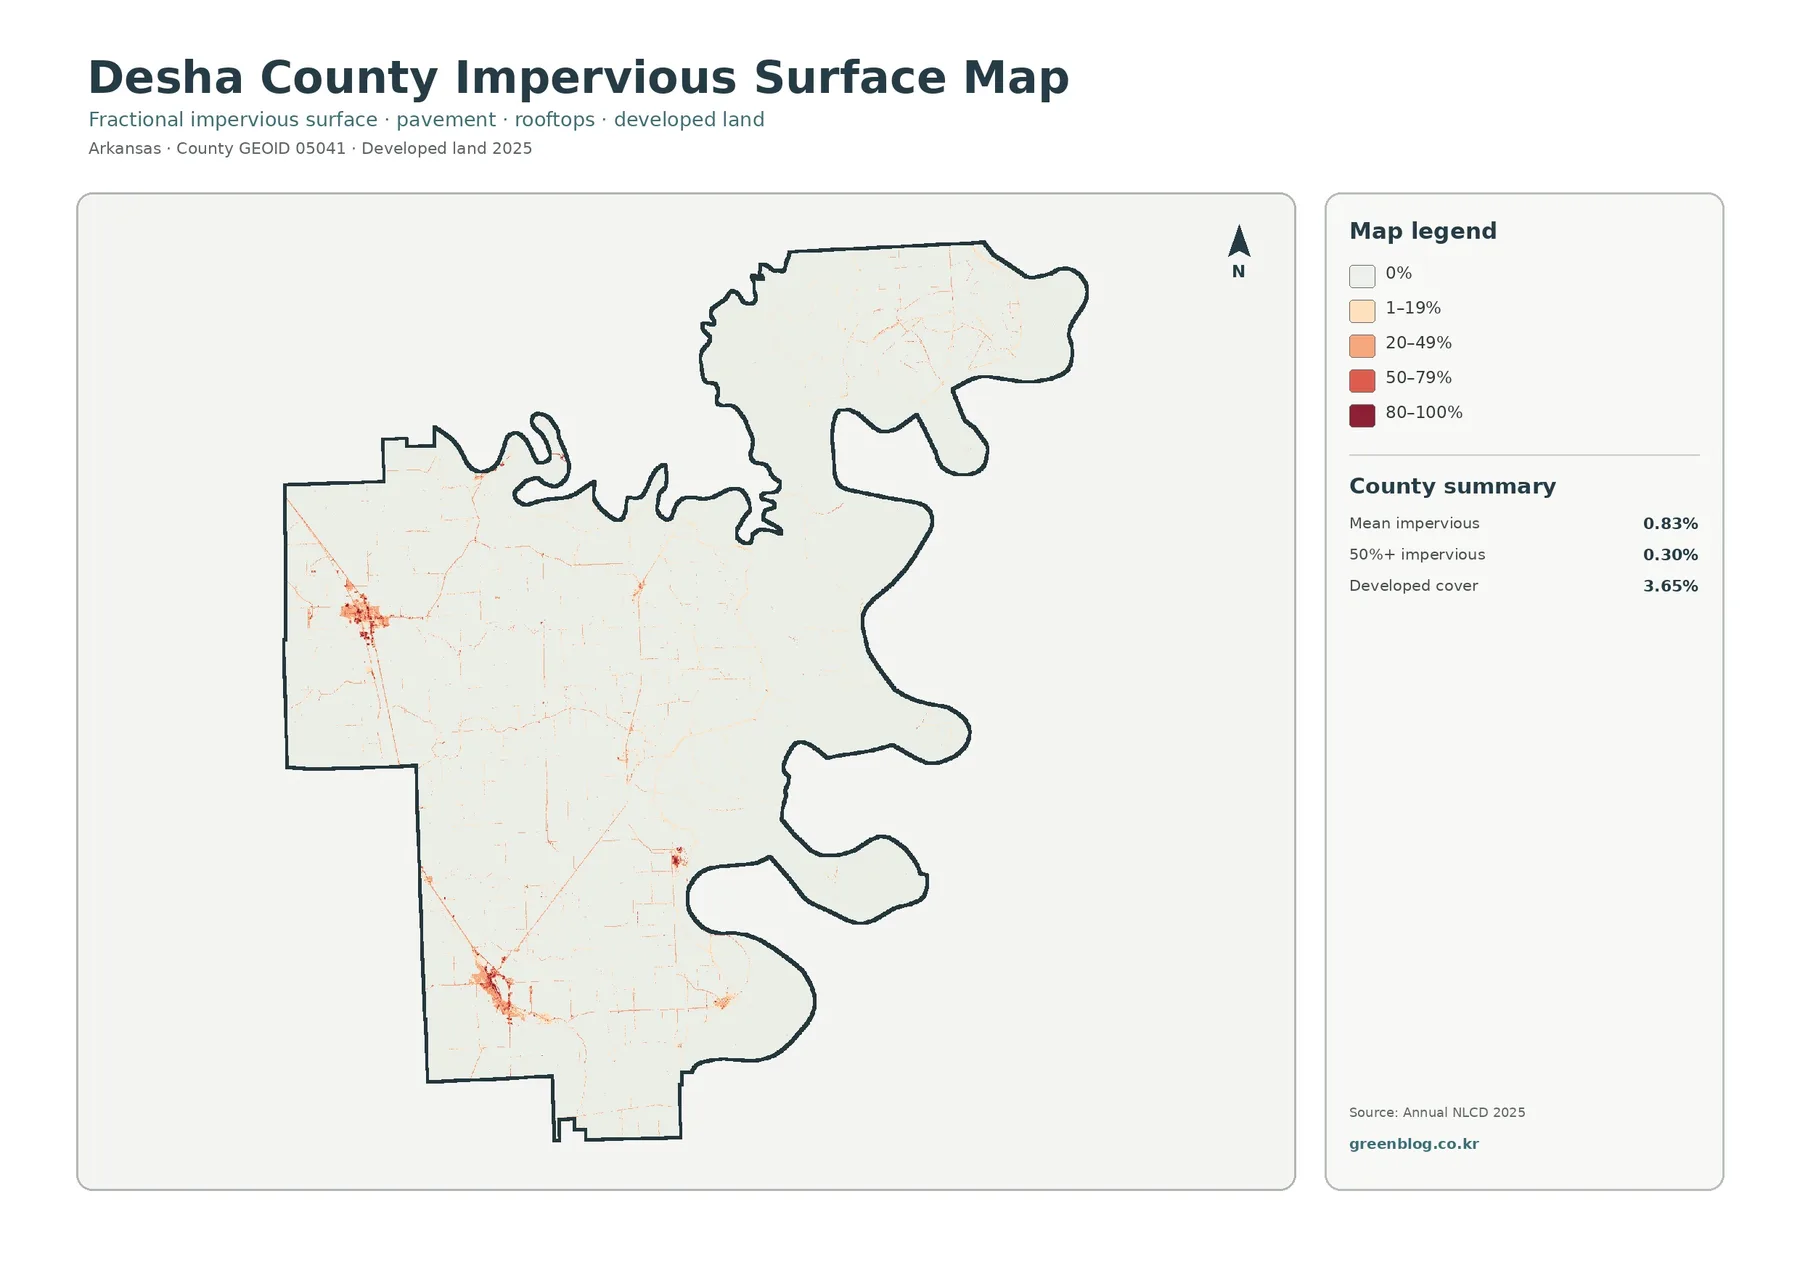
The impervious-surface view measures hard surfaces such as pavement and rooftops rather than all land classified as developed. Countywide mean imperviousness is 0.83%, and only 0.30% of the county falls in cells that are at least 50% impervious. Those values are much smaller than the 3.65% developed-land share because developed classes can also contain lawns, trees, exposed soil, and other surfaces that still absorb water.
Most of the county appears nearly white in this view. Stronger orange and red marks gather in a western settlement cluster and a southern cluster, while fine lines connect smaller developed locations. That pattern is useful for separating the footprint of roads and built surfaces from the far larger agricultural area. It also prevents an easy mistake: large cultivated fields may be highly modified by people, but they are not automatically impervious.
Dumas and McGehee are among the communities served by the county extension office, and the developed pattern is concentrated around a few settlement areas rather than spread evenly across Desha County. The map does not provide city boundaries, street names, or parcel lines, so outside location references should be used only to orient the reader. A site-specific infrastructure study would require more detailed transportation and municipal data.
A forest-and-farmland view confirms how unusual the forest share is
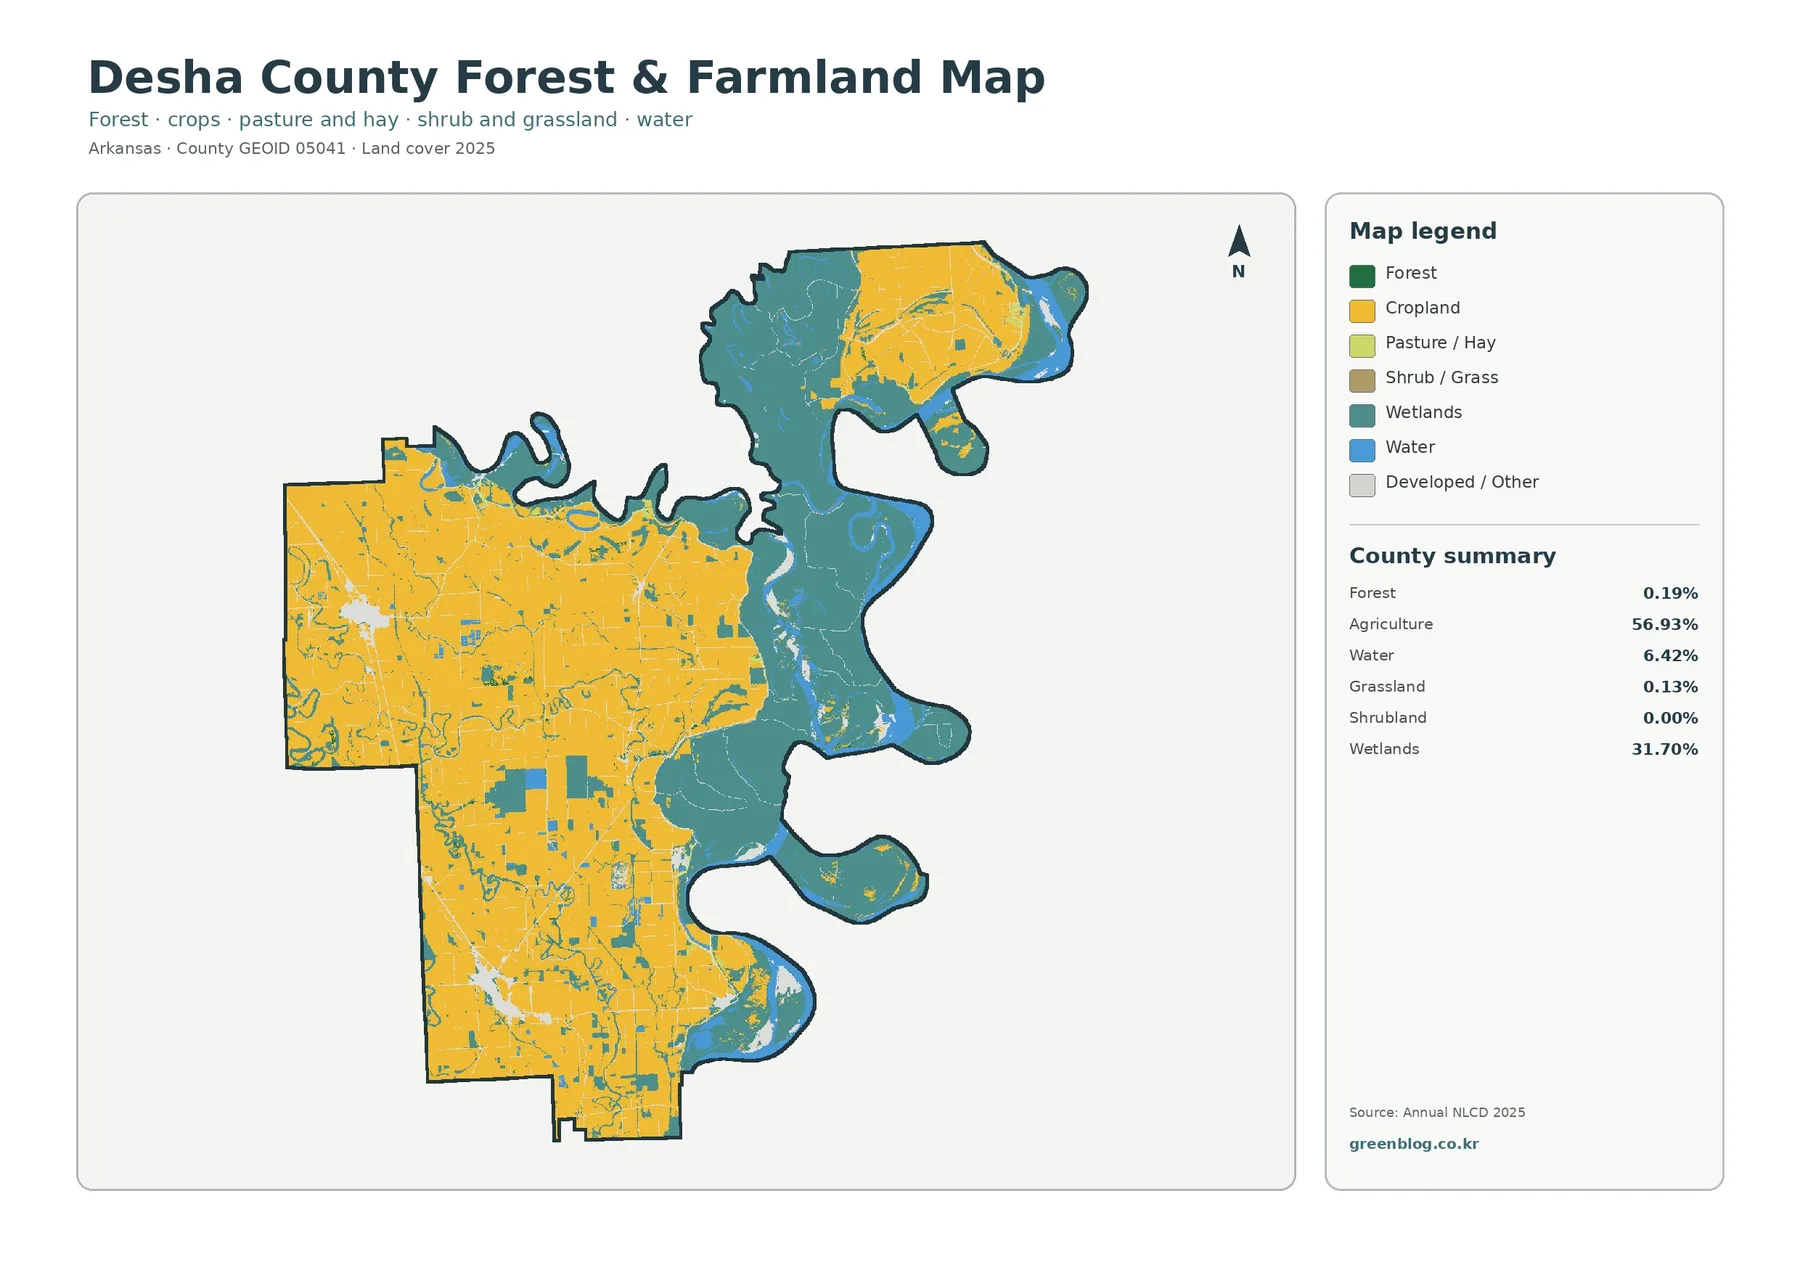
The simplified forest-and-farmland view makes the county’s land-cover balance even clearer. Agriculture remains 56.93% and wetlands 31.70%, with water at 6.42%. Forest is only 0.19%, grassland 0.13%, and shrubland rounds to 0.00% in the supplied summary. Desha County therefore differs from many Arkansas counties where forest is the background class and fields appear as openings within it.
Here the agricultural blocks themselves form the main western and southern background. Forest appears only in tiny fragments that are difficult to see at full-page scale. Wetlands, by contrast, remain prominent even after the legend is simplified. This view is especially useful when a report needs to explain that “rural” does not necessarily mean “forested”; a county can be predominantly rural while its visible surface is mostly cropland and wetland.
The Desha County Extension office provides agriculture and natural-resources education, including services for farmers and families. That source confirms the local importance of agricultural topics without telling us what crop occupies any particular yellow cell. The map should not be used to identify crop species, ownership, farm boundaries, or management practices. It is a broad surface-cover reference, not a farm inventory.
The 1985–2025 comparison records several kinds of difference
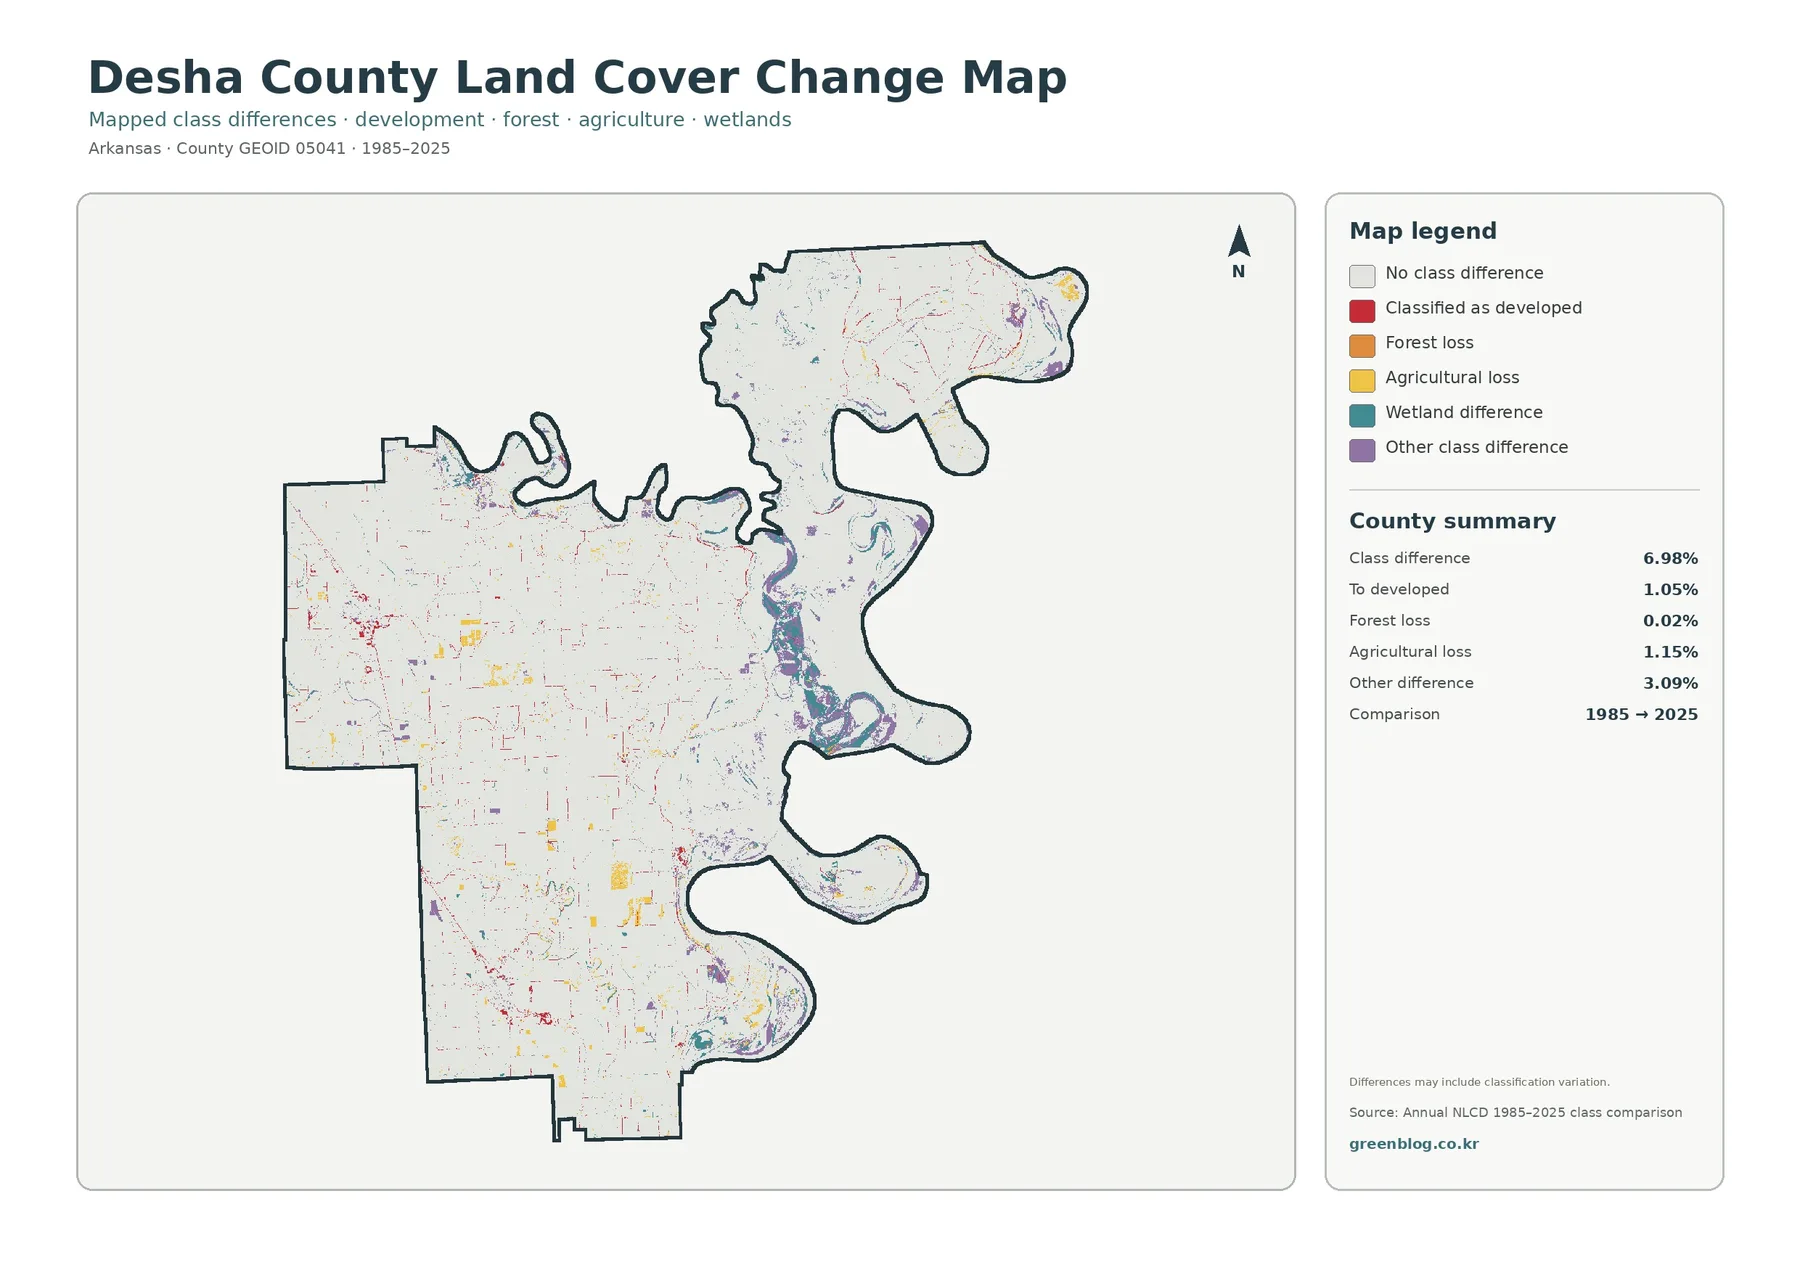
The long-term comparison reports a 6.98% class difference between 1985 and 2025. That percentage is not a development rate. The supplied summary separates 1.05% classified as developed, 0.02% forest loss, 1.15% agricultural loss, and 3.09% other class difference. Wetland differences are also mapped, particularly around the complicated eastern river-and-wetland zone.
Change pixels are scattered across the farm country rather than forming one single band. Red developed-change marks occur around settlement corridors, while yellow and purple differences appear in smaller patches across agricultural areas. The eastern side contains a denser mixture of wetland and other class differences. This distribution makes the comparison more useful as a screening layer for where classifications differ than as a simple before-and-after story.
Classification variation is explicitly noted on the supplied graphic. Differences can reflect real surface change, but boundaries between water, wetlands, agriculture, and other classes can also shift with imagery, seasonal conditions, and classification methods. A point that matters for research should be checked against additional dates or imagery before it is described as a confirmed land-use event.
How the four views can be used together
For a county overview, start with the current land-cover view because it keeps agriculture, wetlands, water, development, and smaller classes in one frame. A second slide can use the forest-and-farmland version to make the agriculture-versus-wetland balance easier to explain. The impervious layer is better reserved for questions about paved and built surfaces, while the class-difference image belongs in a section about long-term comparison.
An agriculture lesson can pair the 56.93% share with the visible extent of the western and southern fields. A wetland or river-corridor discussion can contrast 31.70% wetlands with 6.42% open water and ask why those are separate legend categories. A planning presentation can add the 0.83% mean impervious value to show that built hard surfaces occupy a very small portion of a county whose landscape is dominated by fields and wet ground.
The four views are also useful for avoiding overgeneralization. The current classification tells what surface classes are mapped now; the impervious layer answers a narrower question about hard surfaces; the change layer compares two classification dates. Keeping those purposes separate helps a reader avoid turning every red or purple pixel into a claim about construction, population growth, flood history, or property use.
Download the four original Desha County JPG files
The ZIP package contains the four original JPGs used for this page, each at 2480 × 1754 pixels. They include the 2025 land-cover view, forest and farmland view, impervious-surface/developed-land view, and the 1985→2025 class-difference view. Separate files make it easy to choose one graphic for a worksheet or presentation without extracting screenshots from the web previews.
Keep the legend and year visible whenever possible. Cropping away those elements can make a blue water class look interchangeable with teal wetlands or make a class-difference color appear to represent confirmed development. For reports, a short caption that names the year and the specific layer is usually enough to preserve the intended meaning.
Scale, mixed pixels, and the meaning of land cover
Annual NLCD products are raster classifications, meaning the landscape is divided into grid cells and each cell receives a representative class. A real cell can contain a road beside crops, trees beside a building, or water beside wet vegetation. Those mixed pixels simplify very narrow features and make small boundaries less precise when the map is viewed at county scale.
The current maps are labeled 2025. Construction, crop rotation, vegetation change, water-level variation, or other changes after that observation period are not represented here. The comparison layer uses 1985 and 2025 endpoints; it does not document every intermediate year. Recent aerial imagery and local records are better choices when a question depends on present site conditions.
Land cover is not zoning, legal land use, ownership, or a parcel survey. An agriculture pixel does not identify a farm owner or crop. A wetland pixel does not by itself establish a regulated wetland boundary. Developed land does not state what uses are legally permitted. County, state, federal, or professional sources are needed for decisions that depend on those legal or parcel-level details.
Frequently Asked Questions
What is the largest 2025 land-cover class in Desha County?
Agriculture is the largest class at 56.93%. Wetlands follow at 31.70%, water at 6.42%, and developed land at 3.65%. The spatial pattern is just as important as the ranking: agricultural land is broad in the west and south, while wetland and water are concentrated toward the irregular eastern side.
Why is forest barely visible in the forest-and-farmland view?
The supplied 2025 summary lists forest at only 0.19%. That is far smaller than agriculture or wetlands, so forest appears as tiny fragments instead of broad connected blocks. This is one reason Desha County looks very different from forest-dominated parts of Arkansas.
Does the 6.98% class difference mean 6.98% of the county became developed?
No. The 6.98% value combines multiple kinds of differences between 1985 and 2025. Only 1.05% is listed as change to developed. Agricultural loss, forest loss, wetland differences, and other class differences are separate parts of the comparison.
Can the impervious layer be used as a city-boundary map?
No. It measures the fraction of hard surface in raster cells and does not contain legal municipal boundaries. The clusters are useful for recognizing where pavement and rooftops are concentrated, but official boundary data are required for city or parcel questions.
Map File Information
Included in the archive are all four original Desha County JPGs represented on this page.
- File Type: Four JPG files in one ZIP archive
Related Maps
- A Craighead County Arkansas Land Cover Map
- Arkansas County Arkansas Land Cover Map
- Ashley County Arkansas Land Cover Map
Sources and local context
- MRLC Annual NLCD Data — Annual NLCD data access
- USGS Annual NLCD Land Cover Classification — class definitions and interpretation guidance
- U.S. Census Bureau TIGER/Line Shapefiles — county boundary reference
- Association of Arkansas Counties — Desha County — local overview of Delta farmland and river boundaries
- University of Arkansas Cooperative Extension — Desha County — county agriculture and natural-resources services
Green Map creates custom-edited map images using open geographic data sources such as geoBoundaries, Natural Earth, OpenStreetMap, and government open data.
These maps are edited visual materials, not raw data files, and are provided for education, documents, presentations, and graphic reference.