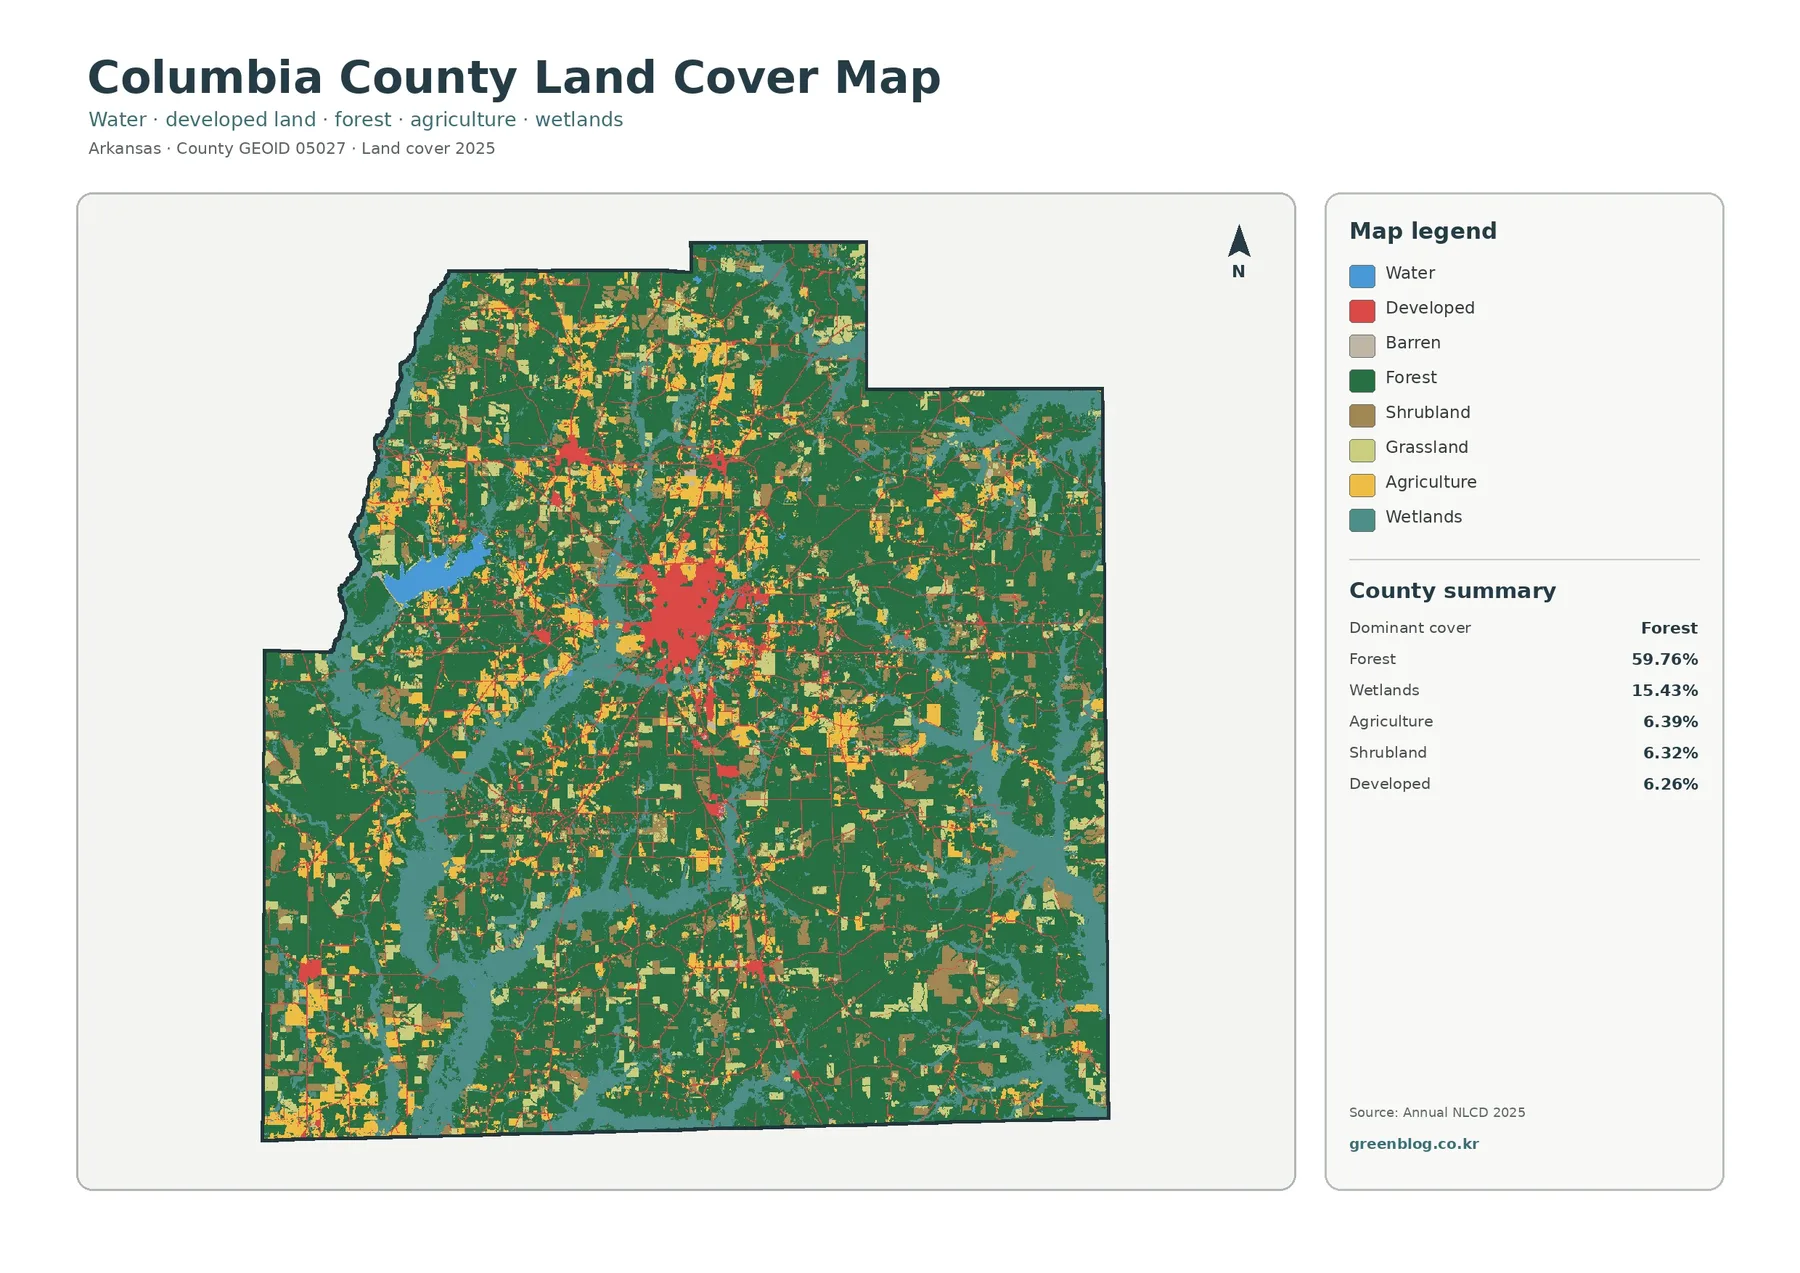
The Columbia County Arkansas Land Cover Map set shows a county where forest is the dominant 2025 cover, wetlands form a substantial second layer, and developed land is concentrated much more strongly near the center than around the outer edges. Forest accounts for 59.76% of the mapped area, while wetlands account for 15.43%, giving the county a distinctly wooded and wet landscape at this scale.
Four views are included on this page: general land cover, forest and farmland, impervious surface, and mapped land-cover differences from 1985 to 2025. The four original JPG maps are also available together in one download for classroom work, local reference, reports, or presentation graphics.
Table of Contents
Forest dominates the 2025 county pattern
The overall land-cover map is the best place to start because it keeps all major classes visible at once. Forest covers 59.76% of Columbia County. Wetlands are the next largest summarized class at 15.43%. Agriculture represents 6.39%, shrubland 6.32%, and developed land 6.26%. Water is only 0.64% of the county, so the blue areas are much smaller in total than either forest or wetlands even though several water features are easy to spot on the map.
Forest is widespread rather than confined to one corner. Large green areas extend through the north, east, south, and western portions of the county, but they are broken by smaller agricultural fields, open vegetation, wetlands, and local development. The central developed concentration stands out because the red class forms a much larger and denser patch there than it does elsewhere. Away from that center, developed cover usually appears as smaller pieces and narrow connections within a mostly natural landscape.
A forest-and-farmland view reveals the smaller open areas
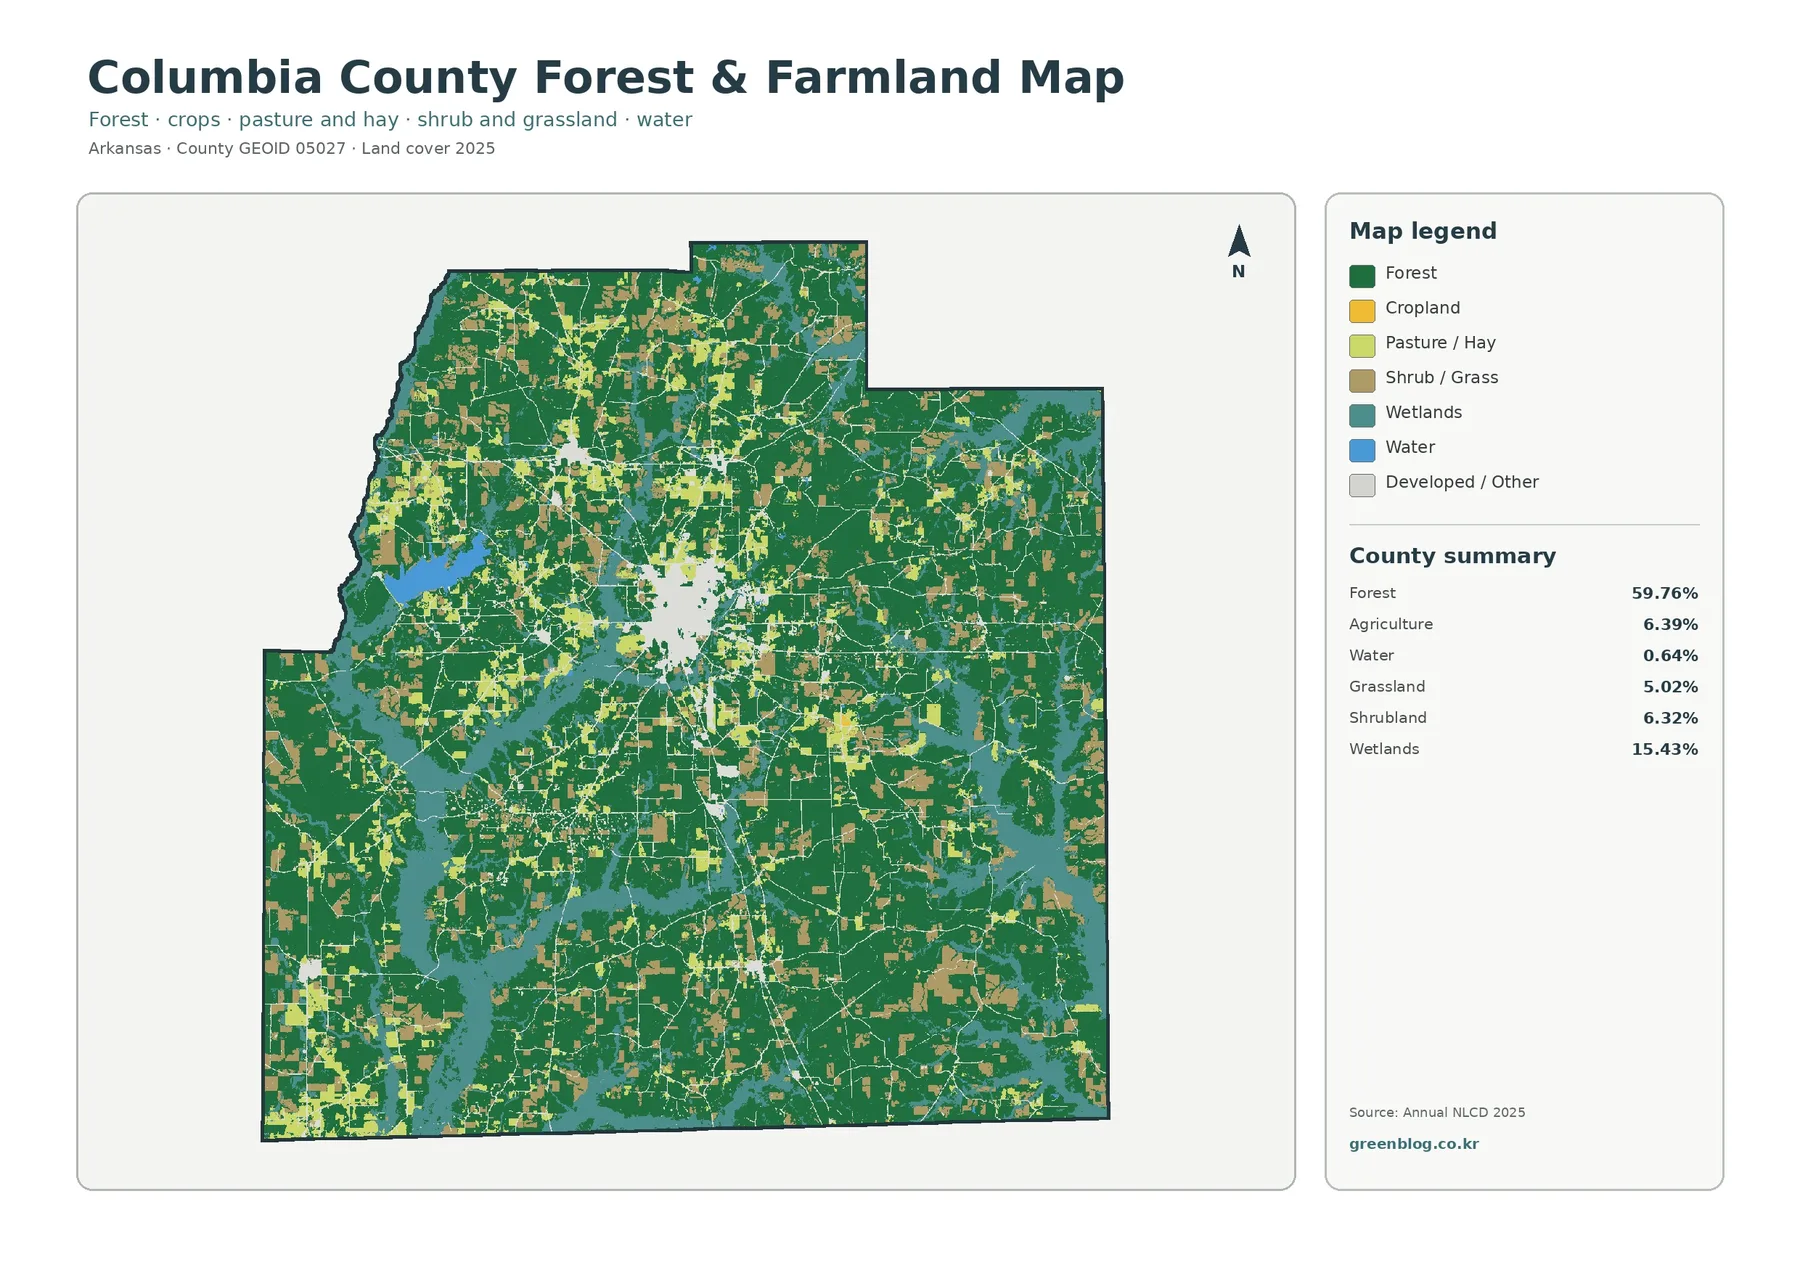
The forest and farmland map simplifies the legend so the relationship between wooded land and open land is easier to follow. Forest remains the broad background, while cropland and pasture or hay appear as smaller, often more angular patches. Rather than forming one continuous agricultural belt, these open areas are dispersed among wooded and wet areas. That visual pattern is consistent with agriculture accounting for 6.39% of the 2025 county summary instead of dominating the county.
Wetlands remain prominent at 15.43%. They are more extensive than mapped agriculture and appear in irregular bands and blocks among the forest. Water itself is 0.64%, so the wetland class is much larger than the visible blue surface-water class. This distinction matters for environmental study: a wetland may have saturated soils and wetland vegetation without appearing as open water, and the map intentionally treats those surfaces as different classes.
Impervious surfaces are concentrated near the county center
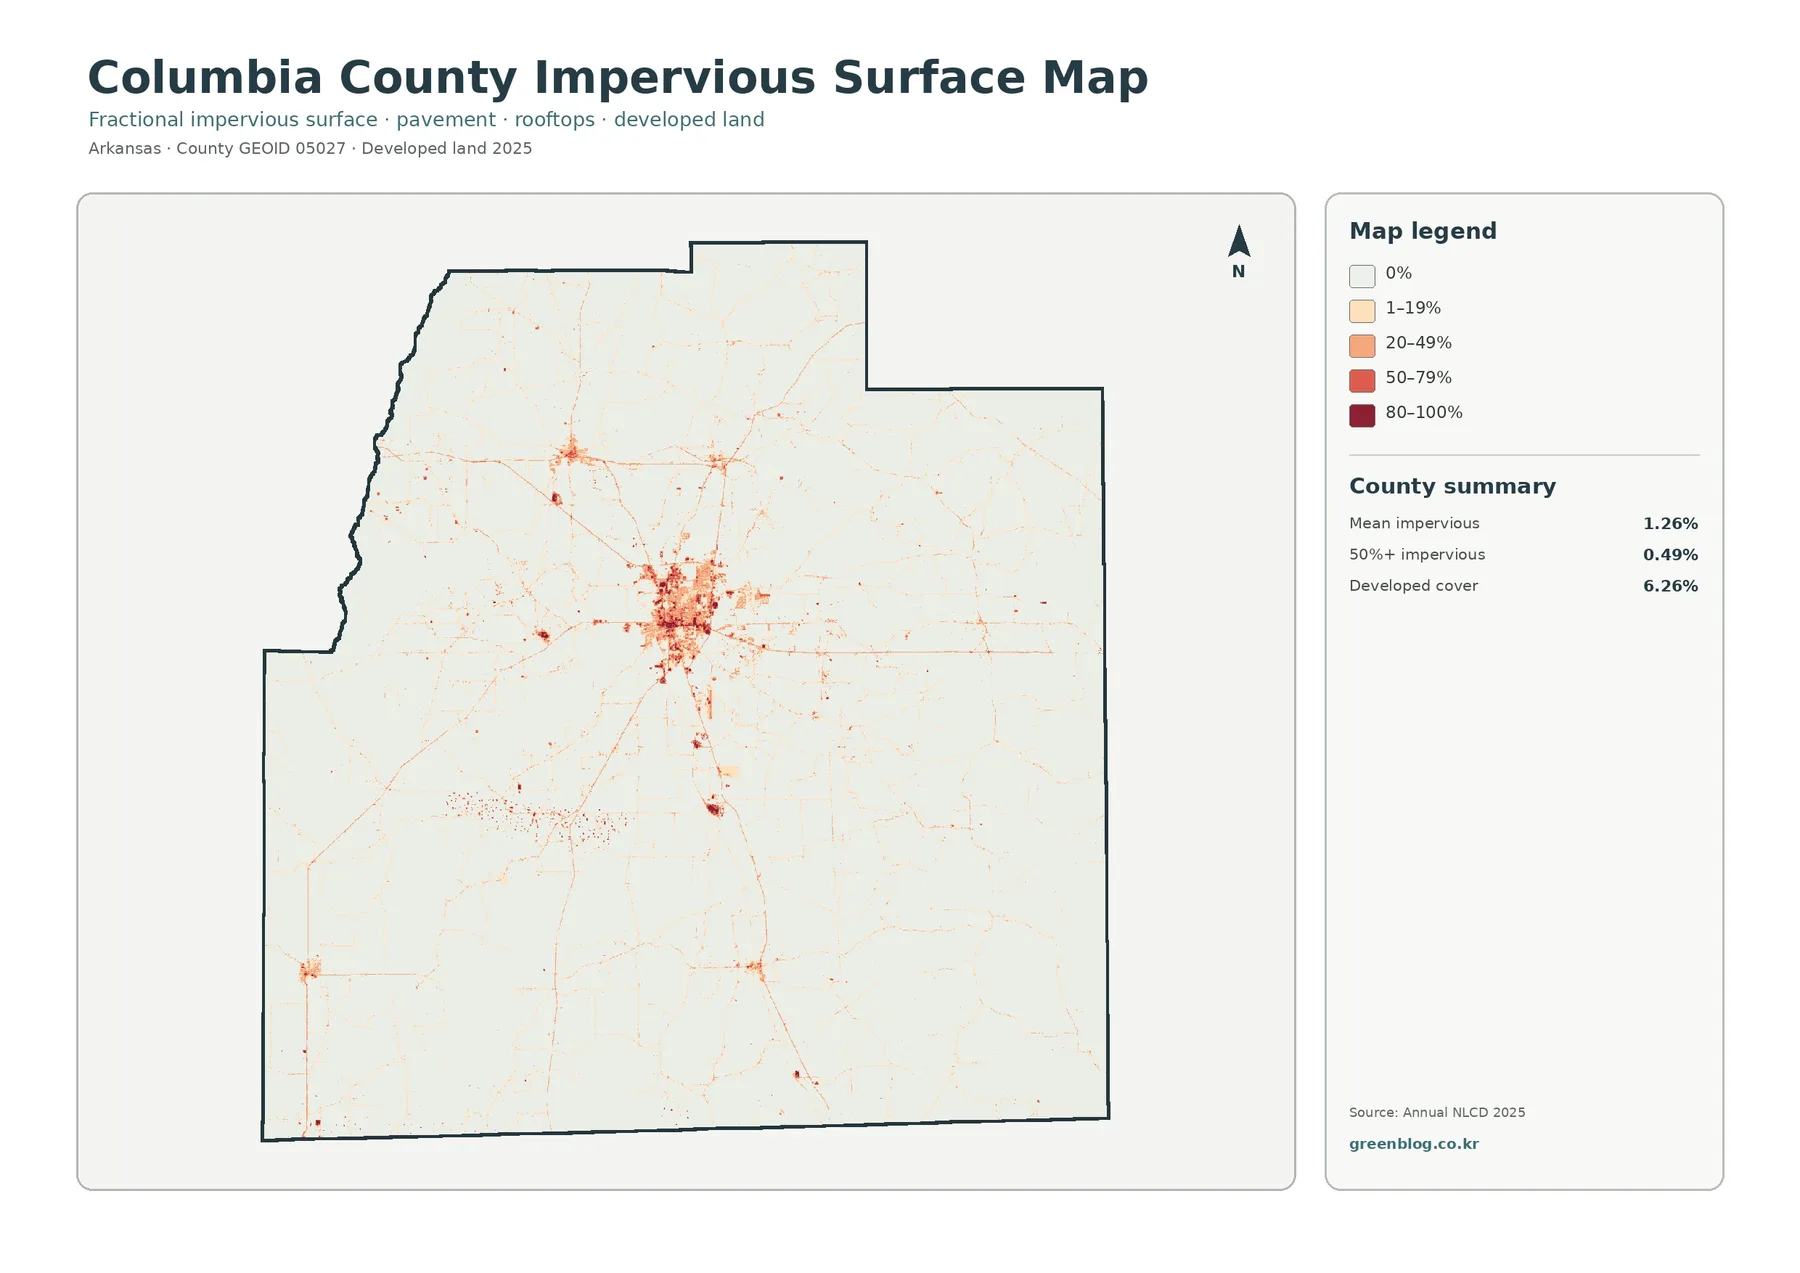
Impervious surface means pavement, rooftops, and other surfaces that allow little water to soak directly into the ground. Columbia County’s mean impervious value is 1.26%, while only 0.49% of the county is mapped at 50% impervious or higher. Developed cover, however, is 6.26%. Those numbers are not contradictory. Developed land can include lawns, trees, and other pervious ground around homes, businesses, roads, and other built features.
The strongest pattern on this map is the dense cluster near the center of the county. Darker orange and red cells are concentrated there, and thinner lines extend outward in several directions. Most of the rest of the county is much lighter, with scattered points and narrow lines rather than broad high-impervious zones. That contrast makes the developed core easy to distinguish from the surrounding forest, wetland, and rural open areas.
The 1985–2025 map records class differences, not one simple trend
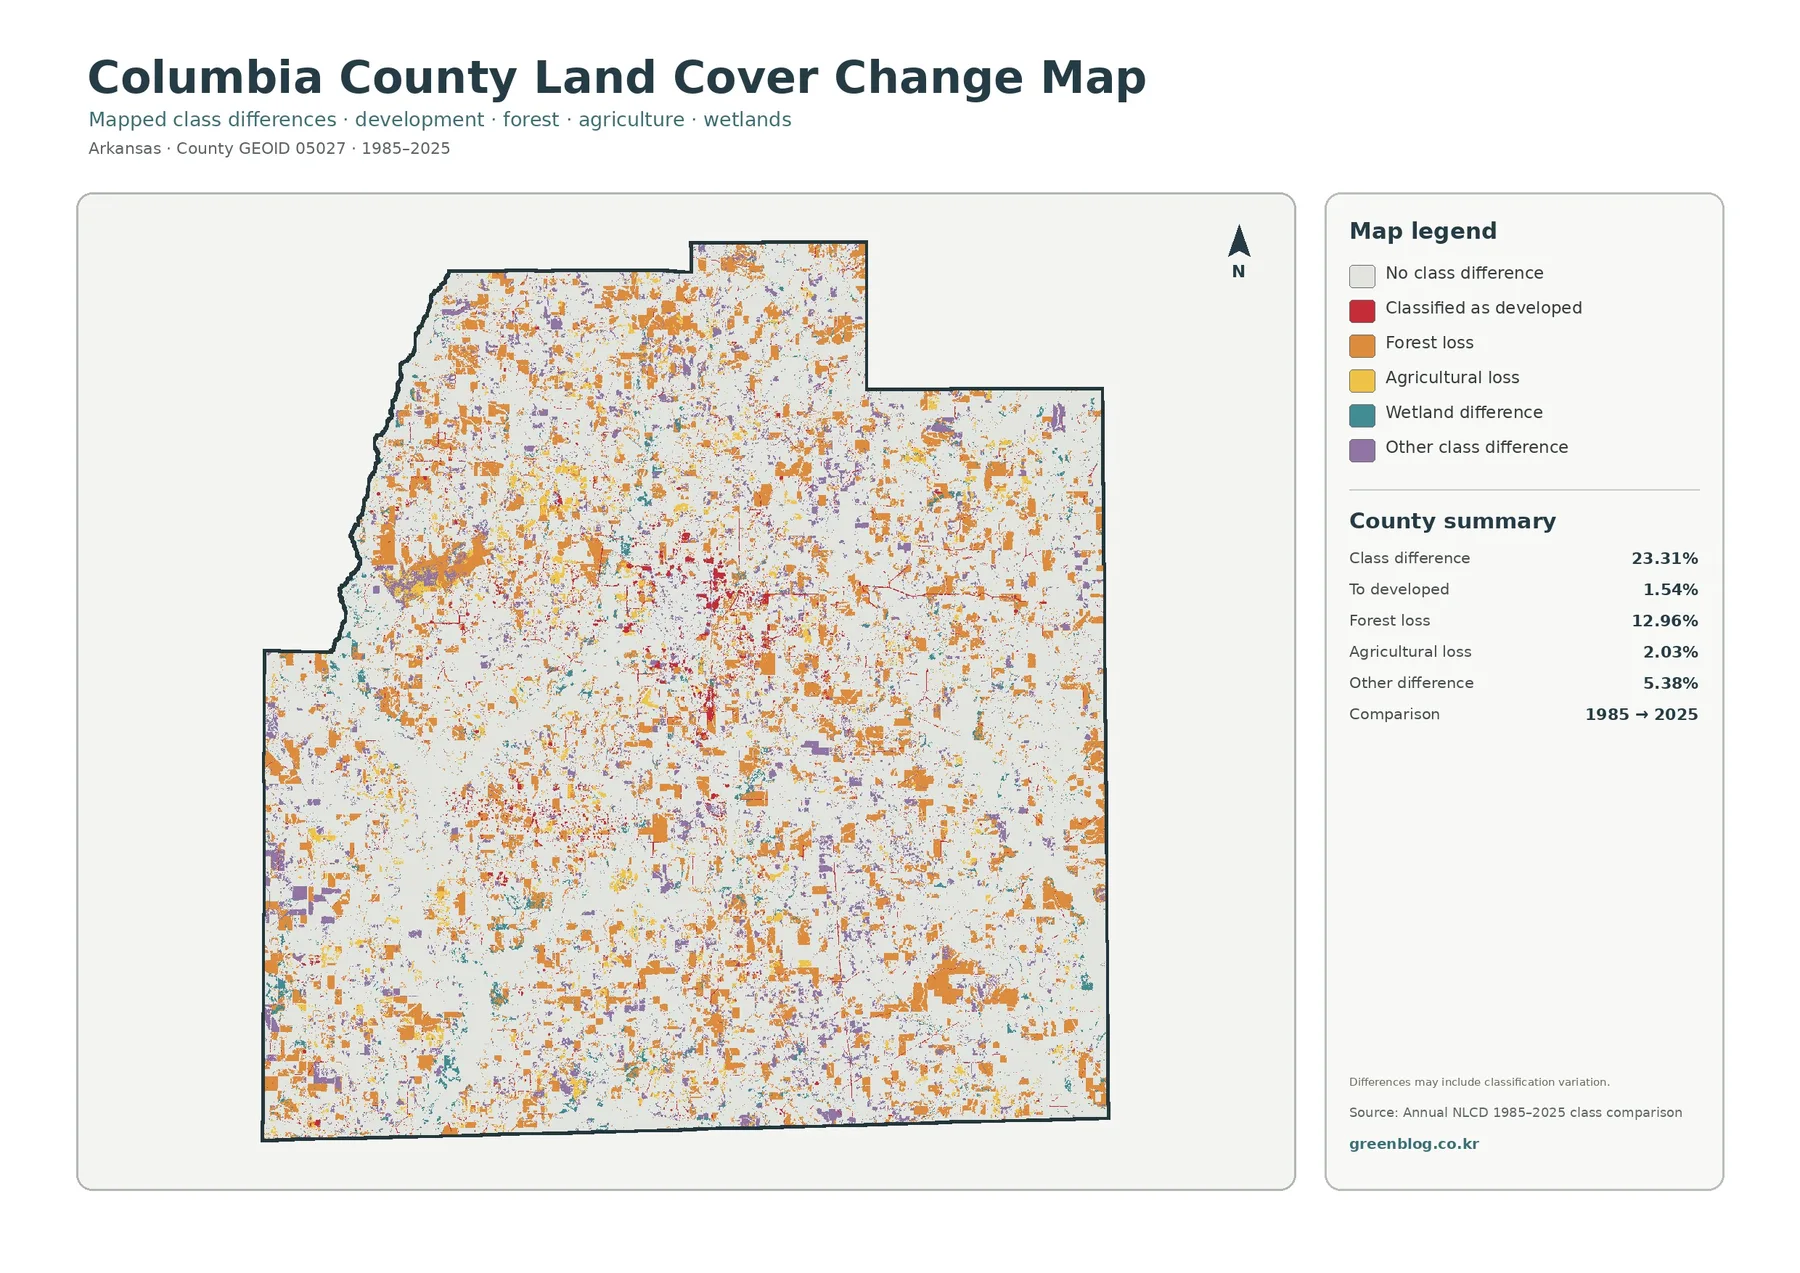
The change view compares classifications from 1985 and 2025. Its county summary reports a total class difference of 23.31%. Within that comparison, 1.54% is mapped as a change to developed land, 12.96% as forest loss, 2.03% as agricultural loss, and 5.38% as other difference. The remaining mapped differences include categories such as wetland difference. Light areas indicate no class difference between the two comparison years.
Orange forest-loss cells are spread widely across the county rather than confined to the central developed cluster. Red cells classified as change to developed land are more noticeable around the central concentration and in smaller scattered locations. Other change colors appear throughout the map as well. This broad mixture is why the 23.31% total should not be described as an urban-growth percentage. The specific “to developed” category is much smaller at 1.54%.
Classification variation can contribute to mapped differences. Imagery conditions, mixed pixels, changing vegetation, and improvements in the classification process can move a cell from one category to another even when the on-the-ground change is subtle. The map itself notes that differences may include classification variation. For that reason, a colored patch is best treated as a place to investigate rather than automatic proof of a specific land-use event.
Frequently Asked Questions
What is the largest land-cover class in Columbia County?
Forest is the largest 2025 class at 59.76% of the county. Wetlands follow at 15.43%. Agriculture is 6.39%, shrubland 6.32%, and developed land 6.26%. The percentages summarize the county as a whole, while the maps show where those classes are distributed.
Why is developed cover 6.26% when mean impervious surface is only 1.26%?
Developed land can include yards, trees, and other surfaces that still absorb water, while impervious surface focuses on pavement, rooftops, and similar sealed surfaces. A low-density developed cell can therefore belong to a developed class without being mostly impervious. The two measures describe related but different characteristics.
Does the 23.31% class difference mean 23.31% of the county was developed?
No. The 23.31% figure is the total share of cells with a different mapped class between 1985 and 2025. The separate “to developed” category is 1.54%. The total also includes forest loss, agricultural loss, wetland differences, other class differences, and possible classification variation.
Useful applications for study, comparison, and presentations
For environmental education, the maps provide a clear county-scale example of a landscape where forest and wetlands together account for most of the mapped cover. Students can compare 59.76% forest and 15.43% wetlands with the much smaller shares of agriculture and development, then look at where those smaller classes are actually located. This combines numerical reading with visual interpretation instead of treating percentages as isolated facts.
Limits to remember before using the maps
Annual NLCD is intended for consistent regional and national land-cover analysis. That strength comes with generalization. Raster cells summarize the surface at a fixed spatial scale, so narrow features and small patches can be blended with their surroundings. A cell at a forest edge may contain trees, road surface, and grass at the same time. The classification assigns a useful category, but it cannot reproduce every fine boundary visible in a site survey.
Download the four Columbia County JPG maps
The download package contains the original JPG versions of the general land-cover map, forest and farmland map, impervious and developed-land map, and 1985–2025 land-cover change map. Each original image is 2480 × 1754 pixels. Keeping the four files separate makes it easy to select only the view needed for a lesson, report, reference sheet, or presentation.
Map File Information
The ZIP contains the four original Columbia County land-cover JPG maps shown and discussed on this page.
- File Type: Four JPG images in one ZIP archive
Related Maps
- Arkansas County Arkansas Land Cover Map
- Ashley County Arkansas Land Cover Map
- Baxter County Arkansas Land Cover Map
Sources and data notes
- MRLC Annual NLCD Data – access point for the Annual NLCD land-cover datasets used for year-based comparison.
- USGS Annual NLCD Land Cover Classification – definitions for developed, forest, agriculture, wetland, and other mapped classes.
- U.S. Census Bureau TIGER/Line Shapefiles – official geographic boundary resources used to identify county geography.
Green Map creates custom-edited map images using open geographic data sources such as geoBoundaries, Natural Earth, OpenStreetMap, and government open data.
These maps are edited visual materials, not raw data files, and are provided for education, documents, presentations, and graphic reference.