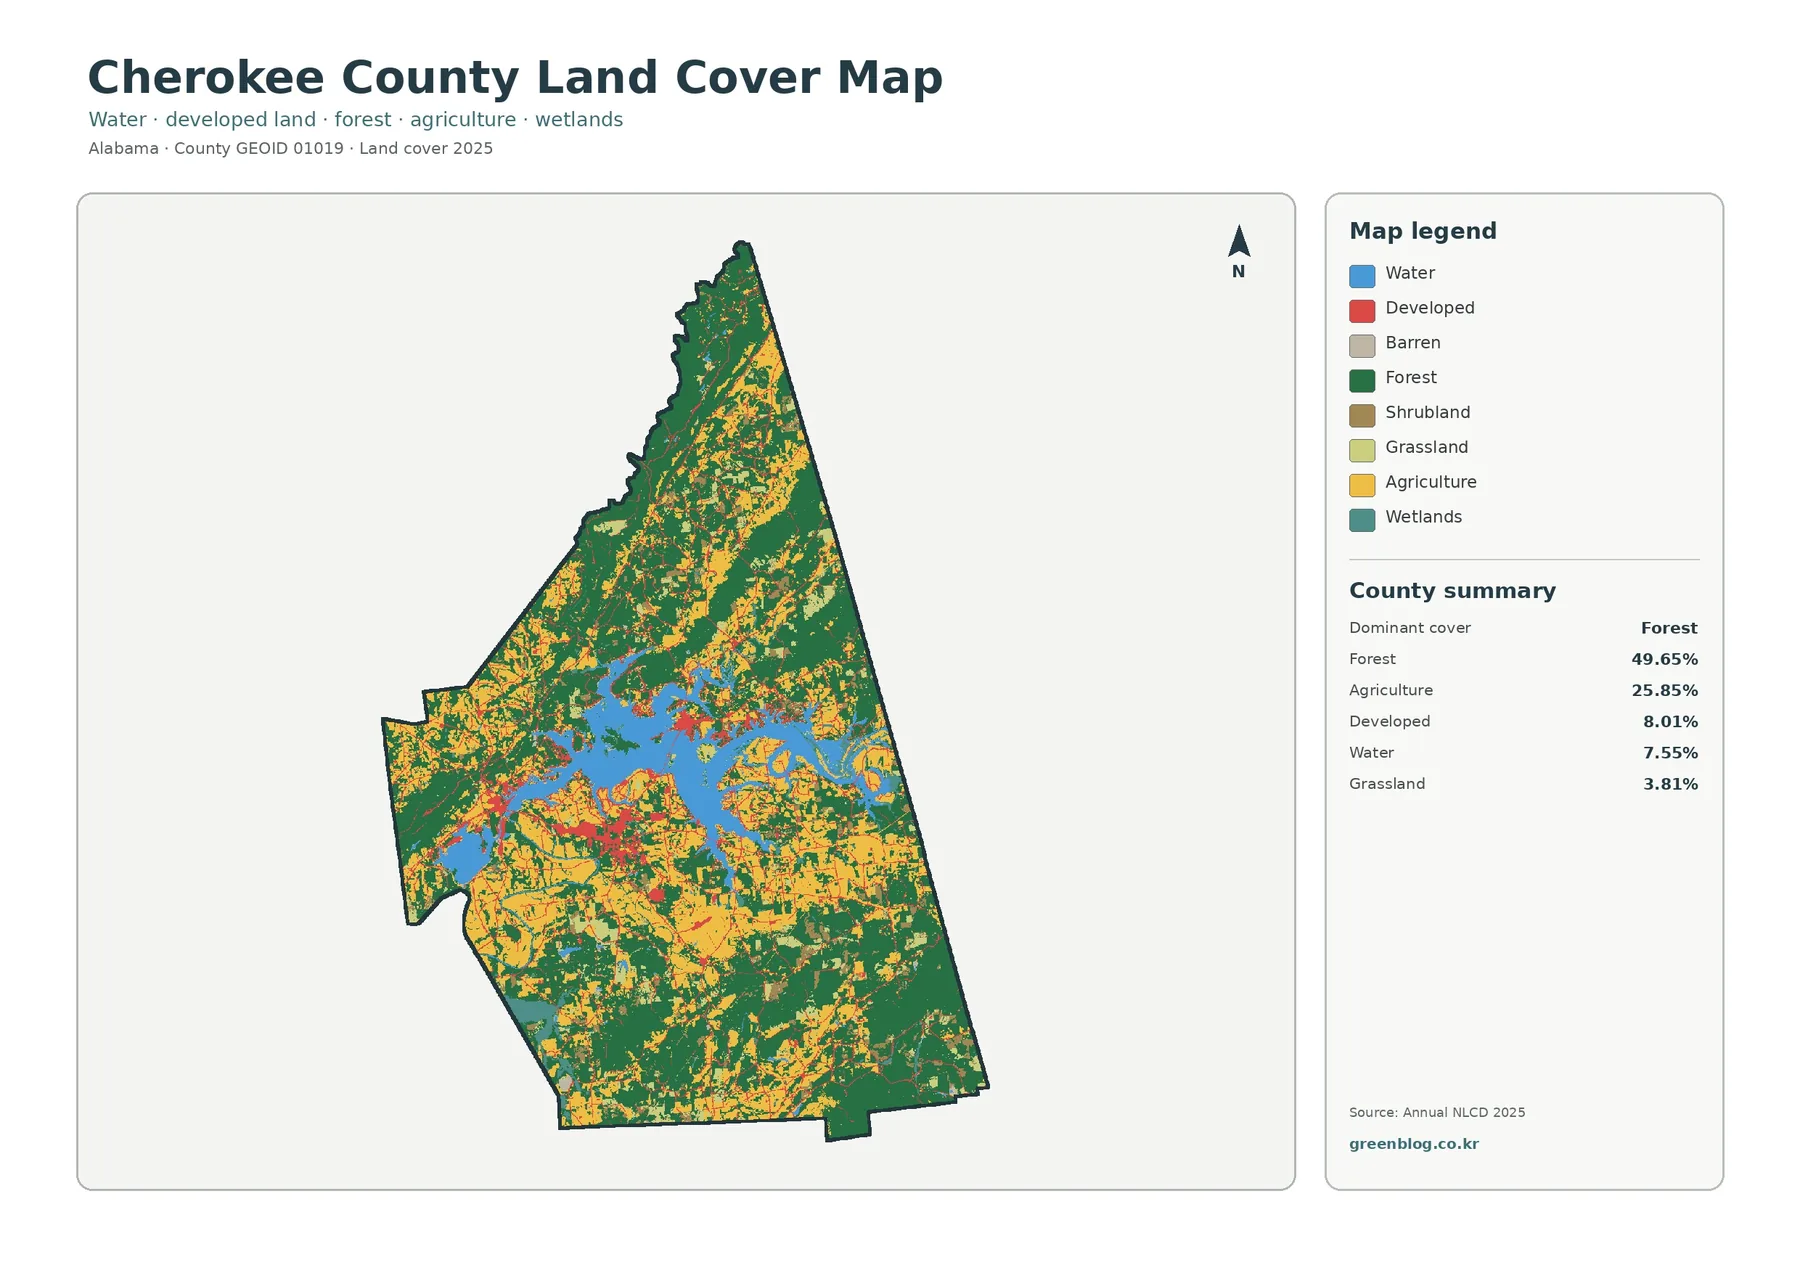
Cherokee County in northeast Alabama has a 2025 land-cover pattern shaped by three large elements: forest, agriculture, and the broad water footprint of Weiss Lake. Forest is the dominant class at 49.65%, followed by agriculture at 25.85%, developed land at 8.01%, water at 7.55%, and grassland at 3.81%. The result is not a uniformly wooded county. Large forest areas are broken by farm cover, settled areas, and a lake system that provides an unusually clear reference point for comparing the four maps.
This page provides four views of the same county: general 2025 land cover, forest and farmland, impervious surface and developed land, and a 1985–2025 class comparison. The WebP previews make the patterns easy to inspect online, while the four original JPG maps are available together in one ZIP download. They can be used in classroom material, presentations, county comparisons, preliminary environmental review, or any project that benefits from seeing the same boundary with a different theme.
Table of Contents
A county landscape organized around forest, farms, and Weiss Lake
The full land-cover map is easiest to read by starting with the large blue water area near the center of the county. The Cherokee County Commission identifies Weiss Lake as one of the county’s defining features, and its broad shape is clearly visible in the map. Forest and agricultural cover meet the lake on many sides, while developed patches appear near settled shore areas and along narrow connecting corridors. Because the lake is so distinctive, it works as a reliable landmark when moving from one map view to another.
Forest covers 49.65% of the county, almost half of the mapped area. Dark green is especially extensive across the northern and eastern parts of the county, but wooded cover also appears throughout the south and west. The forest is interrupted rather than continuous. Yellow agricultural patches repeatedly enter the green areas, creating a mixed landscape where farm cover and woods are often close together. That distribution matters more than the percentage alone because a single countywide number cannot show whether a class forms one block or many separated patches.
Agriculture accounts for 25.85%, making it the second-largest class by a wide margin. The yellow areas are not arranged as one simple belt. Some form broad patches, while others appear as smaller pieces surrounded by forest or positioned near the lake and other open areas. This scattered pattern is useful when comparing Cherokee County with counties where farmland dominates one large plain. Here, farming and forest cover are repeatedly interwoven, which gives the map a more varied texture even before the smaller grassland and shrubland classes are considered.
Developed land covers 8.01% of the county. Red areas are much smaller than forest or agriculture, but they stand out where they cluster around settled areas and along thin linear features that resemble transportation corridors. The map does not label roads or municipal boundaries, so those lines should not be assigned a road name from the image alone. A safe interpretation is that developed cover is concentrated in several connected settlement areas rather than spread evenly across the county.
Why the forest-and-farmland view changes the emphasis
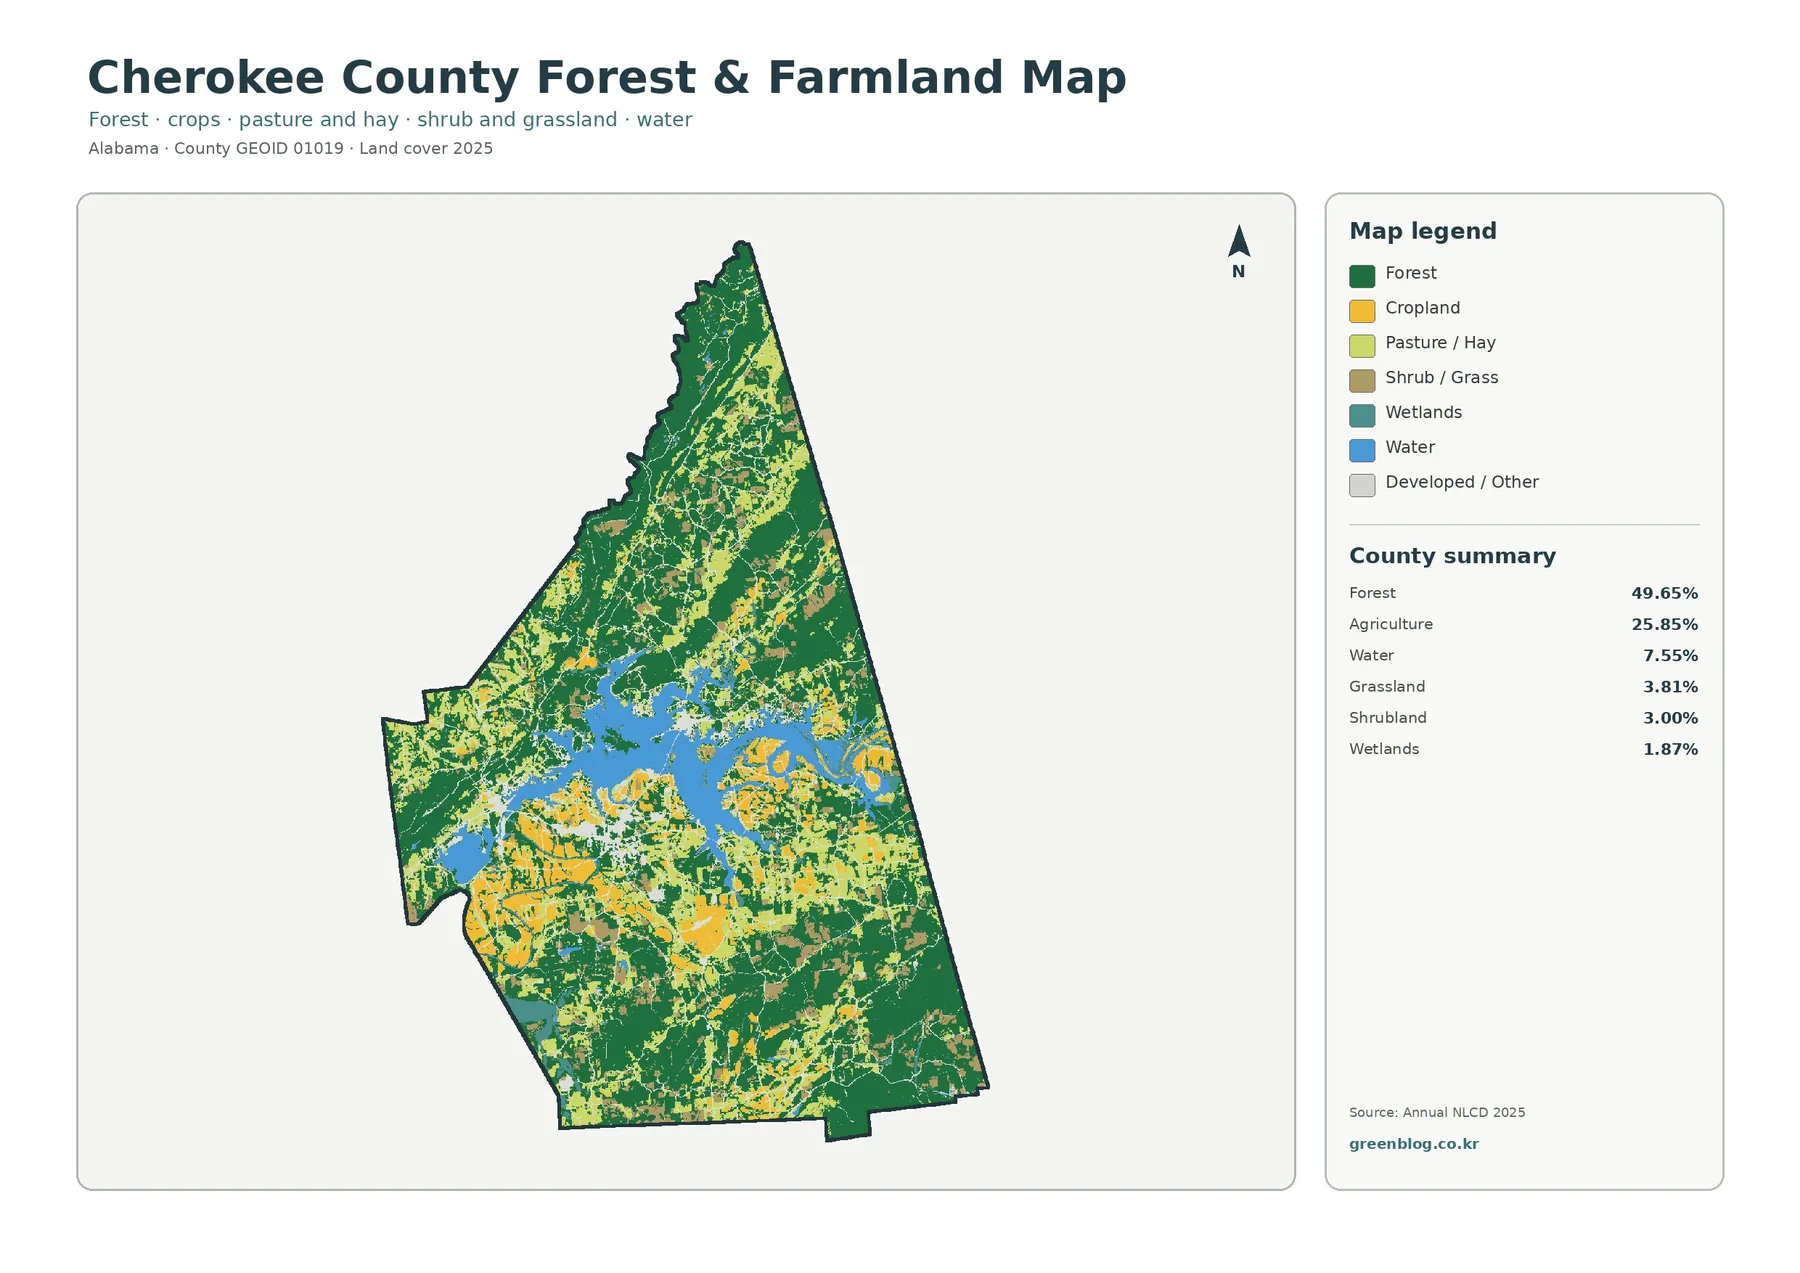
The forest-and-farmland map simplifies the general legend so that wooded and agricultural patterns are easier to separate. Forest remains the strongest background class, but agriculture becomes easier to trace through the center, west, south, and around parts of the lake. Pasture or hay, shrub and grass cover, wetlands, and water are retained because they help explain the transition between heavily wooded ground and more open land. Developed and other classes are visually reduced so they do not compete with the map’s main comparison.
The summary for this view lists forest at 49.65%, agriculture at 25.85%, water at 7.55%, grassland at 3.81%, shrubland at 3.00%, and wetlands at 1.87%. Together, forest and agriculture account for most of the county’s mapped surface, yet their spatial arrangement is not uniform. Some agricultural areas sit in broad clusters, while others are narrow or fragmented. The large water share is concentrated in a recognizable lake shape, so 7.55% of the county can appear visually more dominant than a larger class that is spread across many separate patches.
Grassland and shrubland are smaller categories, but they help explain why the boundary between forest and agriculture is rarely a clean line. Open grassy cover and shrub-dominated areas occur in scattered pieces among larger green and yellow zones. At the 30-meter raster scale, one map cell may contain several real-world surfaces, such as trees, pasture, a narrow road, and a building. The classification assigns a representative value, so small patches should be read as generalized land-cover units rather than exact property boundaries.
Land cover should also be kept separate from legal land use. A yellow agricultural class indicates a surface classified as agricultural cover in the satellite-based dataset; it does not prove that a parcel is zoned for agriculture. The same is true of forest. A green cell says that tree cover is the mapped surface, not whether the land is publicly owned, privately managed, protected, or available for timber harvest. Parcel questions require current local property and planning information.
Water is only 7.55%, but it is a major visual anchor
Countywide percentages and visual prominence are not the same thing. Water makes up 7.55% of the mapped area, but much of it is concentrated in the broad Weiss Lake system rather than dispersed among tiny ponds. That concentration gives water a strong presence in the map. The lake’s branching shape divides nearby forest and farmland into recognizable sections and makes it easier to compare locations across the general, forest-and-farmland, impervious, and change views without relying on road or town labels.
Wetlands account for 1.87% in the forest-and-farmland summary. Teal wetland cells appear around parts of the water edge and along smaller drainage areas, but they should not be treated as legal wetland boundaries. The map is a land-cover classification based on raster cells, not a regulatory wetland delineation. Open water and wetlands also represent different surface conditions, so the blue and teal classes should remain separate when explaining the county’s water-related cover.
Another useful piece of local context comes from Little River Canyon National Preserve. The National Park Service notes that the preserve lies on the DeKalb–Cherokee county boundary in the wooded uplands of northeast Alabama and protects the Little River canyon landscape. That helps explain the broader regional setting of extensive forest in the northeastern part of the county. The land-cover map, however, does not include the preserve boundary, so the green area should not be interpreted as a map of protected land.
Impervious surface reveals a much smaller hard-surface footprint
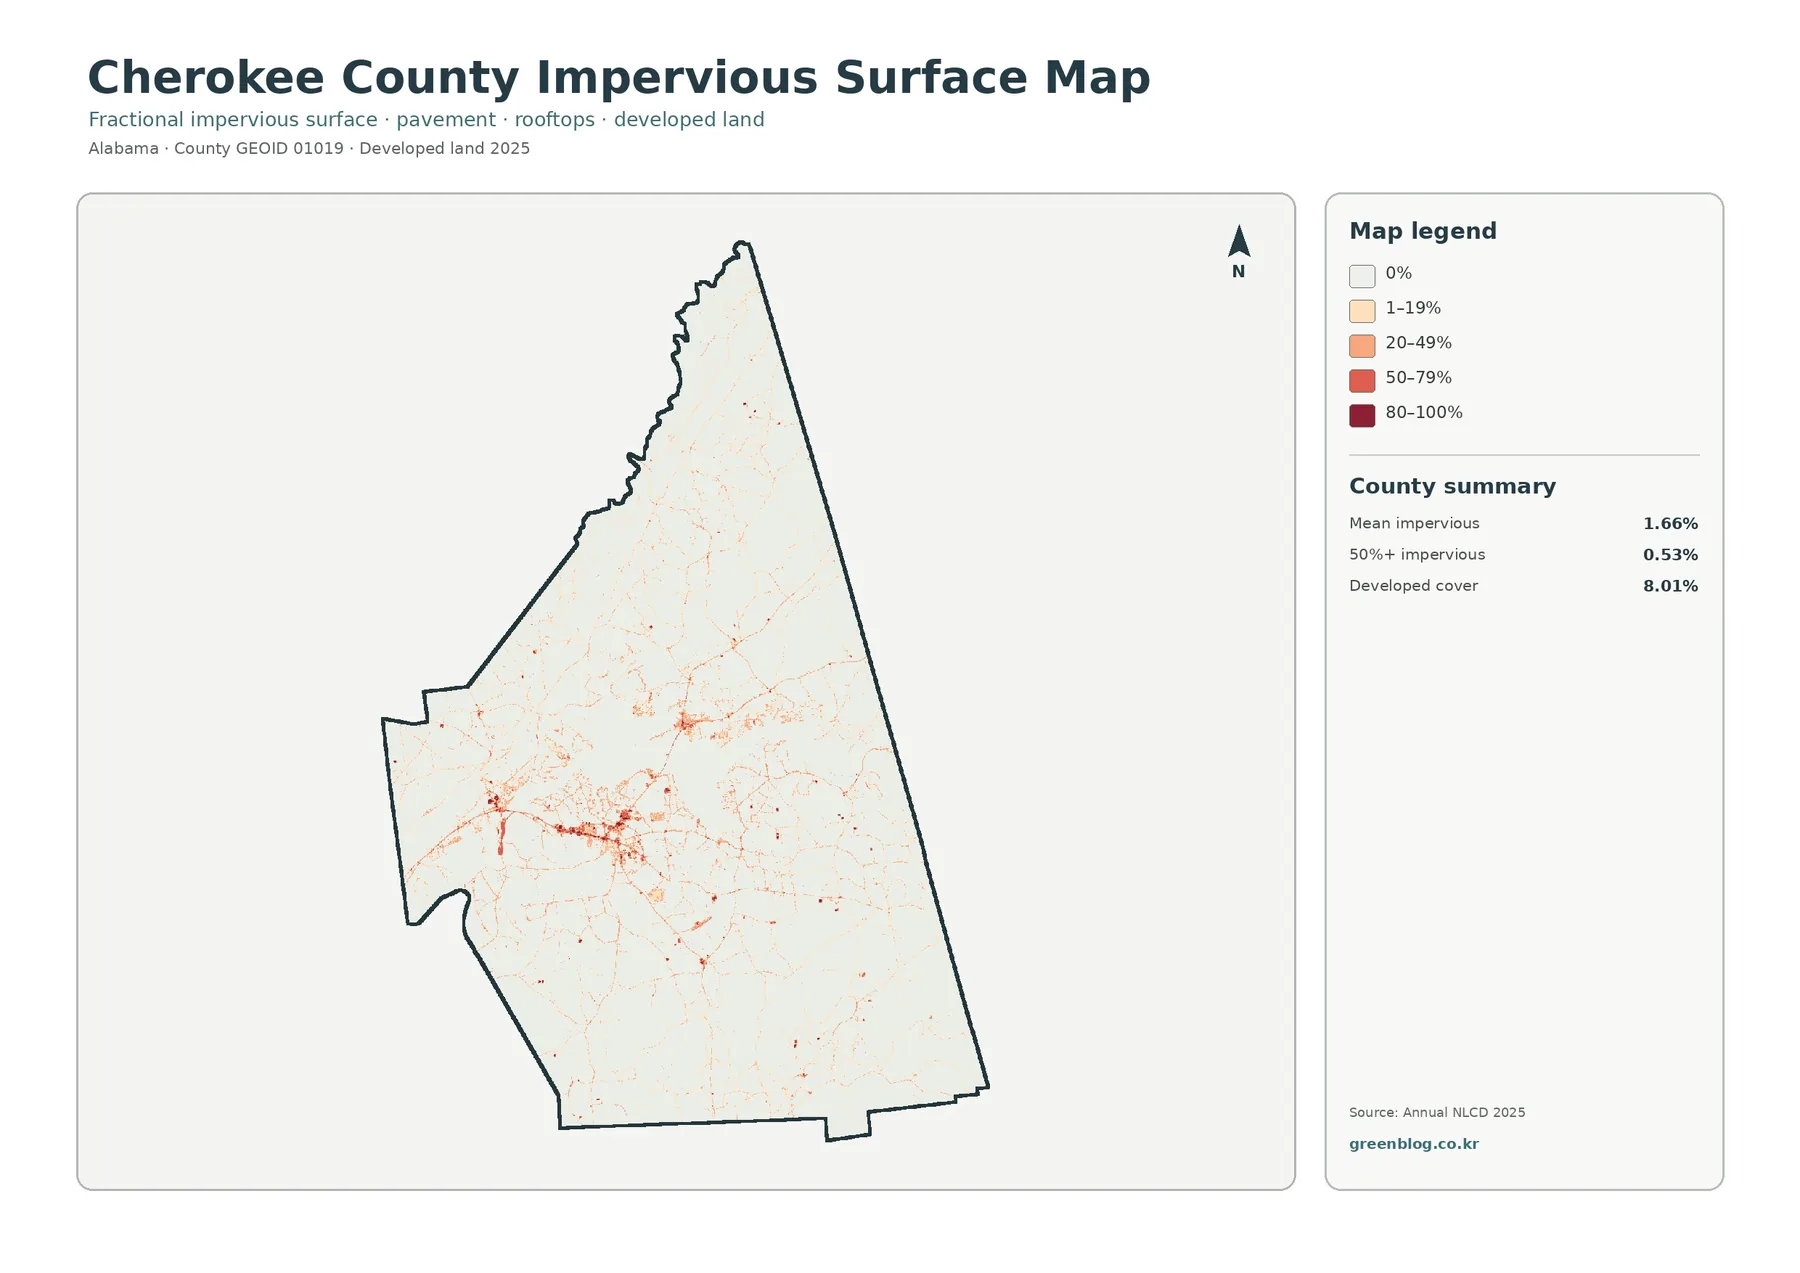
Impervious surface means hard ground cover such as pavement, rooftops, and large parking areas where rain cannot easily soak into the soil. Cherokee County’s mean impervious value is 1.66%, and only 0.53% of the county is summarized as having at least 50% impervious cover. Those figures are much lower than the 8.01% developed-land share because developed land is a broader class. A low-density residential cell can include a house and driveway but also lawn, trees, and other permeable ground.
The impervious map is mostly pale, with stronger orange and red values concentrated in a limited number of settlement clusters and thin connecting lines. This makes the contrast with the general map useful. An area can be shown as developed in the land-cover classification while still having only a modest amount of pavement or rooftop surface. Where the impervious colors become stronger, the proportion of hard surface within the raster cells is higher.
Several of the more visible hard-surface clusters occur around the settled parts of the county near Weiss Lake, with smaller linear traces extending away from them. Those narrow traces may follow roads or other developed corridors, but the image does not provide road names. The map is therefore best used to compare the concentration of built surface, not as a transportation map. A road inventory or county highway map is the appropriate source when the identity of a specific route matters.
Impervious cover can be useful in watershed education because it highlights where rainfall is more likely to run over hard surfaces instead of soaking directly into the ground. It should not be treated as a flood-risk map. Flooding depends on terrain, soil, drainage infrastructure, channel capacity, rainfall, and other conditions. The impervious layer can help identify areas worth examining more closely, but engineering or hazard decisions require additional hydrologic and elevation data.
What the 33.00% class difference from 1985 to 2025 actually means
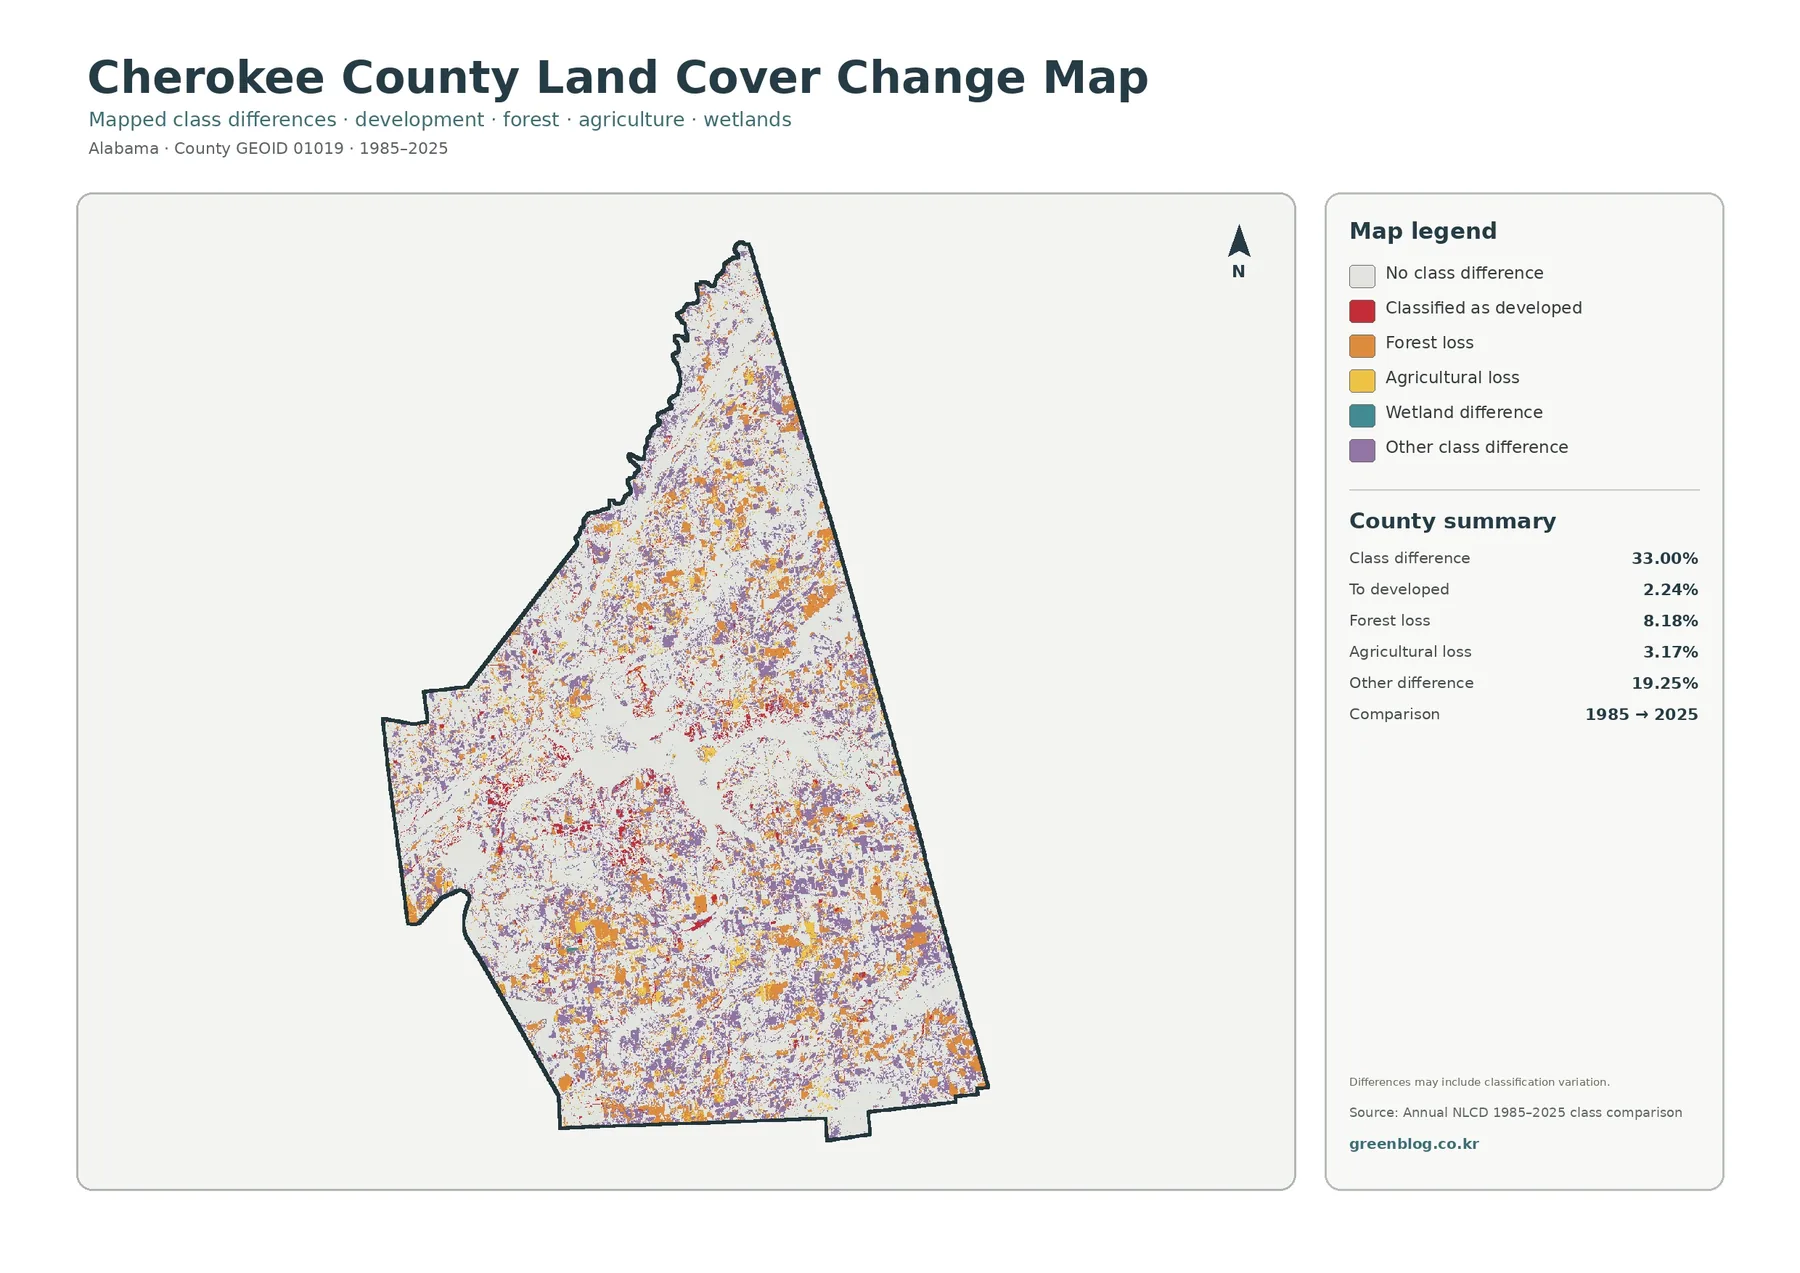
The change map compares the land-cover class recorded for 1985 with the class recorded for 2025. Its summary reports a total class difference of 33.00%. The listed components include 2.24% classified to developed, 8.18% forest loss, 3.17% agricultural loss, and 19.25% other class difference. Wetland difference is also a legend category, but the map summary does not provide a separate percentage for it, so no additional exact value should be inferred.
Purple other-difference cells are spread widely through the county, and orange forest-loss cells also appear in many separated patches. Agricultural-loss areas form smaller yellow pieces, while red areas classified to developed are more localized. The pattern does not resemble a single wave moving across Cherokee County. Instead, many kinds of endpoint differences occur in different settings around the lake, within forest-farm mosaics, and near developed areas.
The 33.00% value should not be described as the share of the county that was developed during the forty-year period. Only 2.24% is summarized as changing to the developed class in this comparison. The total difference includes several other transitions and may also contain some classification variation. Satellite conditions, mixed pixels, changes in classification practice, or temporary vegetation states can cause two endpoints to receive different classes even when the story on the ground is more complicated.
Forest loss at 8.18% also requires careful wording. It means that cells classified as forest at the earlier endpoint were classified differently at the later endpoint. The map by itself cannot establish whether the cause was permanent development, timber harvest, agricultural conversion, vegetation succession, or a difference between forest and shrub classification. Agricultural loss at 3.17% carries the same limitation. To identify timing and cause, annual NLCD layers, aerial imagery, and local records are needed.
A practical way to compare the four maps without mixing their meanings
Start with the general 2025 map and use Weiss Lake as the first location anchor. Note where forest, agriculture, and developed cover meet the water. Then move to the forest-and-farmland view to simplify the same area and see whether open land is agricultural, grassy, shrubby, wetland, or water. This sequence is especially helpful in Cherokee County because the lake’s shape remains easy to recognize while the surrounding thematic colors change.
If the question is about built surfaces, switch to the impervious map after locating the same settlement area in the general map. Compare the broader developed class with the smaller hard-surface footprint. This makes it clear why 8.01% developed cover and a 1.66% mean impervious value describe related but different things. The change map should come last, after the present-day locations are familiar, because its colors represent endpoint differences rather than current land-cover classes.
For classroom use, the four views can demonstrate several basic map-reading ideas in one county. Students can compare a percentage with its geographic distribution, distinguish developed land from impervious surface, and learn why a class-difference map does not automatically explain the cause of change. For presentations, two carefully chosen maps are often clearer than placing all four on one slide. Keeping the year and legend visible is more important than maximizing the number of images.
For preliminary environmental work, the maps can help divide the county into broad areas for follow-up: heavily forested zones, mixed forest-farm areas, lake and wetland edges, settled areas with more hard surface, and places where endpoint classifications differ. Those categories can guide a more detailed search for aerial photos, parcel data, terrain, streams, or field information. The maps are strongest as a screening and orientation resource rather than as final evidence for a parcel-level decision.
Download the four original JPG maps
The downloadable ZIP contains four original 2480×1754 JPG files: the 2025 general land-cover map, the forest-and-farmland map, the impervious-surface and developed-land map, and the 1985–2025 class-difference map. These are larger than the 1800-pixel-wide WebP previews used in the article. Because each file uses the same Cherokee County extent, they can be placed side by side in documents or presentations without having to reconstruct the county boundary.
The asset manifest does not mark the JPG files as meeting an A3 high-resolution reference. They can still be useful for ordinary documents, screens, handouts, and slide decks, but large-format printing should be tested before final production. Increasing the image dimensions in layout software does not create more ground detail than the source raster contains, so extreme enlargement can make the cells and labels look coarse.
When comparing Cherokee County with another county, match map type and year before drawing conclusions. A 2025 land-cover percentage should be compared with another 2025 land-cover map using the same classification, while a class-difference percentage belongs to a different question. Keeping current cover and endpoint change in separate charts or captions prevents readers from confusing a present-day share with a change statistic.
Reading limits of a 30-meter raster map
Annual NLCD land cover is raster data. In plain language, the ground is divided into grid cells and each cell receives a representative class or value. At the commonly used 30-meter land-cover scale, a cell can contain trees, grass, a narrow road, a small building, shoreline, or several of those surfaces at once. The map must simplify that mixture, so the edge of a color patch should not be expected to match a parcel line, field boundary, or streambank exactly.
A mixed pixel is a cell containing more than one real-world surface. Mixed pixels are especially common along shorelines, narrow streams, forest edges, small settlements, and places where farm fields meet woods. Zooming into the JPG only makes the cell larger on the screen; it does not improve the source accuracy. Parcel ownership, zoning, road right-of-way, regulated wetland limits, and construction suitability require more detailed current data.
The 2025 map is also a snapshot. Construction, harvest, crop rotation, vegetation recovery, and other events after the observation year are not shown. The 1985–2025 map compares two endpoints, so it cannot reveal every intermediate transition during the forty-year interval. If the year of a change matters, the better approach is to review annual NLCD layers and aerial photographs rather than infer a timeline from a two-date comparison.
These limits do not make the maps less useful; they define the questions the maps can answer well. At county scale, the maps quickly show where forest dominates, where agriculture is mixed with woods, how Weiss Lake shapes the visual geography, where hard surfaces cluster, and where endpoint classes differ. They are a practical first reference for deciding what deserves closer study, not a substitute for a survey, legal record, or site inspection.
Frequently Asked Questions
What is the dominant 2025 land-cover class in Cherokee County?
Forest is the largest class at 49.65%. Agriculture is second at 25.85%, followed by developed land at 8.01%, water at 7.55%, and grassland at 3.81%. The countywide percentages are useful for scale, but the maps are needed to see that forest and farmland are interwoven while much of the water is concentrated in the large Weiss Lake system.
Why does 7.55% water look so prominent on the map?
Much of the water is concentrated in a large, recognizable lake area rather than scattered among many tiny features. A class can therefore occupy a modest share of the county while still appearing visually dominant in one part of the map. Weiss Lake also branches through the surrounding landscape, which increases its importance as a location reference when comparing the other map views.
Why is developed land 8.01% while mean impervious surface is 1.66%?
Developed land is a broad land-cover category that can contain houses, roads, lawns, trees, soil, and other surfaces in the same area. Impervious surface measures the hard portion, such as pavement and rooftops. A low-density developed cell may therefore have a substantial amount of permeable ground, so the developed share and impervious percentage are not expected to match.
Does the 33.00% class difference mean one-third of Cherokee County became developed?
No. The 33.00% figure is the total share of cells with a different land-cover class between the 1985 and 2025 endpoints. Only 2.24% is summarized as classified to developed. The total also includes forest loss, agricultural loss, other class differences, wetland differences, and possible classification variation. Additional years are needed to determine the timing and cause of specific changes.
What files are included in the download?
The ZIP contains four original 2480×1754 JPG maps: general 2025 land cover, forest and farmland, impervious surface and developed land, and the 1985–2025 class comparison. The asset manifest does not mark them as meeting an A3 high-resolution reference, so anyone planning a large print should check text and legend clarity at the intended output size first.
Map File Information
Cherokee County Land Cover Maps Four original JPG maps: 2025 land cover, forest and farmland, impervious surface and developed land, and 1985–2025 class difference
- Included Files: Use only the versions confirmed in the article and supplied images
- File Type: Use the confirmed download contents
- Intended Use: Printing, education, presentations, and map-based projects
Related Maps
- Autauga County Alabama Land Cover Map
- Baldwin County Alabama Land Cover Map
- Barbour County Alabama Land Cover Map
Sources and reference links
- MRLC Annual NLCD Data – official access to Annual NLCD land-cover products and related datasets.
- USGS Annual NLCD Land Cover Classification – documentation for the land-cover classification used in Annual NLCD.
- U.S. Census Bureau TIGER/Line Shapefiles – official county boundary and geographic reference data.
- Cherokee County Commission – official county information, including Cherokee County’s northeast Alabama location and Weiss Lake context.
- Little River Canyon National Preserve – National Park Service information on the canyon, river, and wooded uplands along the DeKalb–Cherokee county boundary.
- Alabama Cooperative Extension System – Cherokee County – local extension information and programs related to agriculture and natural resources.
Green Map creates custom-edited map images using open geographic data sources such as geoBoundaries, Natural Earth, OpenStreetMap, and government open data.
These maps are edited visual materials, not raw data files, and are provided for education, documents, presentations, and graphic reference.