Bibb County is predominantly wooded in the supplied 2025 land-cover data. Forest accounts for 64.42% of the county, while wetlands, agriculture, shrubland, grassland, and developed cover break the forest into a more varied pattern than the headline number alone suggests. The four maps on this page separate that pattern into a general land-cover view, a forest-and-farmland view, an impervious-surface view, and a comparison of mapped classes between 1985 and 2025.
The original JPG versions of all four maps are available together in one download. They are useful for county-scale reference, classroom work, regional comparisons, presentations, and printed material where a larger image is helpful. These maps describe what covers the ground; they do not show parcel ownership, zoning, building rights, tax status, or exact property boundaries.
Table of Contents
A forest majority does not make the county visually uniform
Forest is the dominant 2025 class at 64.42%. Wetlands account for 7.57%, agriculture 7.35%, shrubland 6.94%, and developed cover 6.76%. The forest-and-farmland map also lists grassland at 6.21% and water at 0.53%. Together, these values describe a county in which woodland forms the broad background but many other surfaces recur across the landscape. Agricultural and open-cover patches interrupt the forest, wetland colors follow sinuous low-lying features, and built cover becomes much denser in a few localized areas.
The general 2025 map shows where the cover becomes more mixed
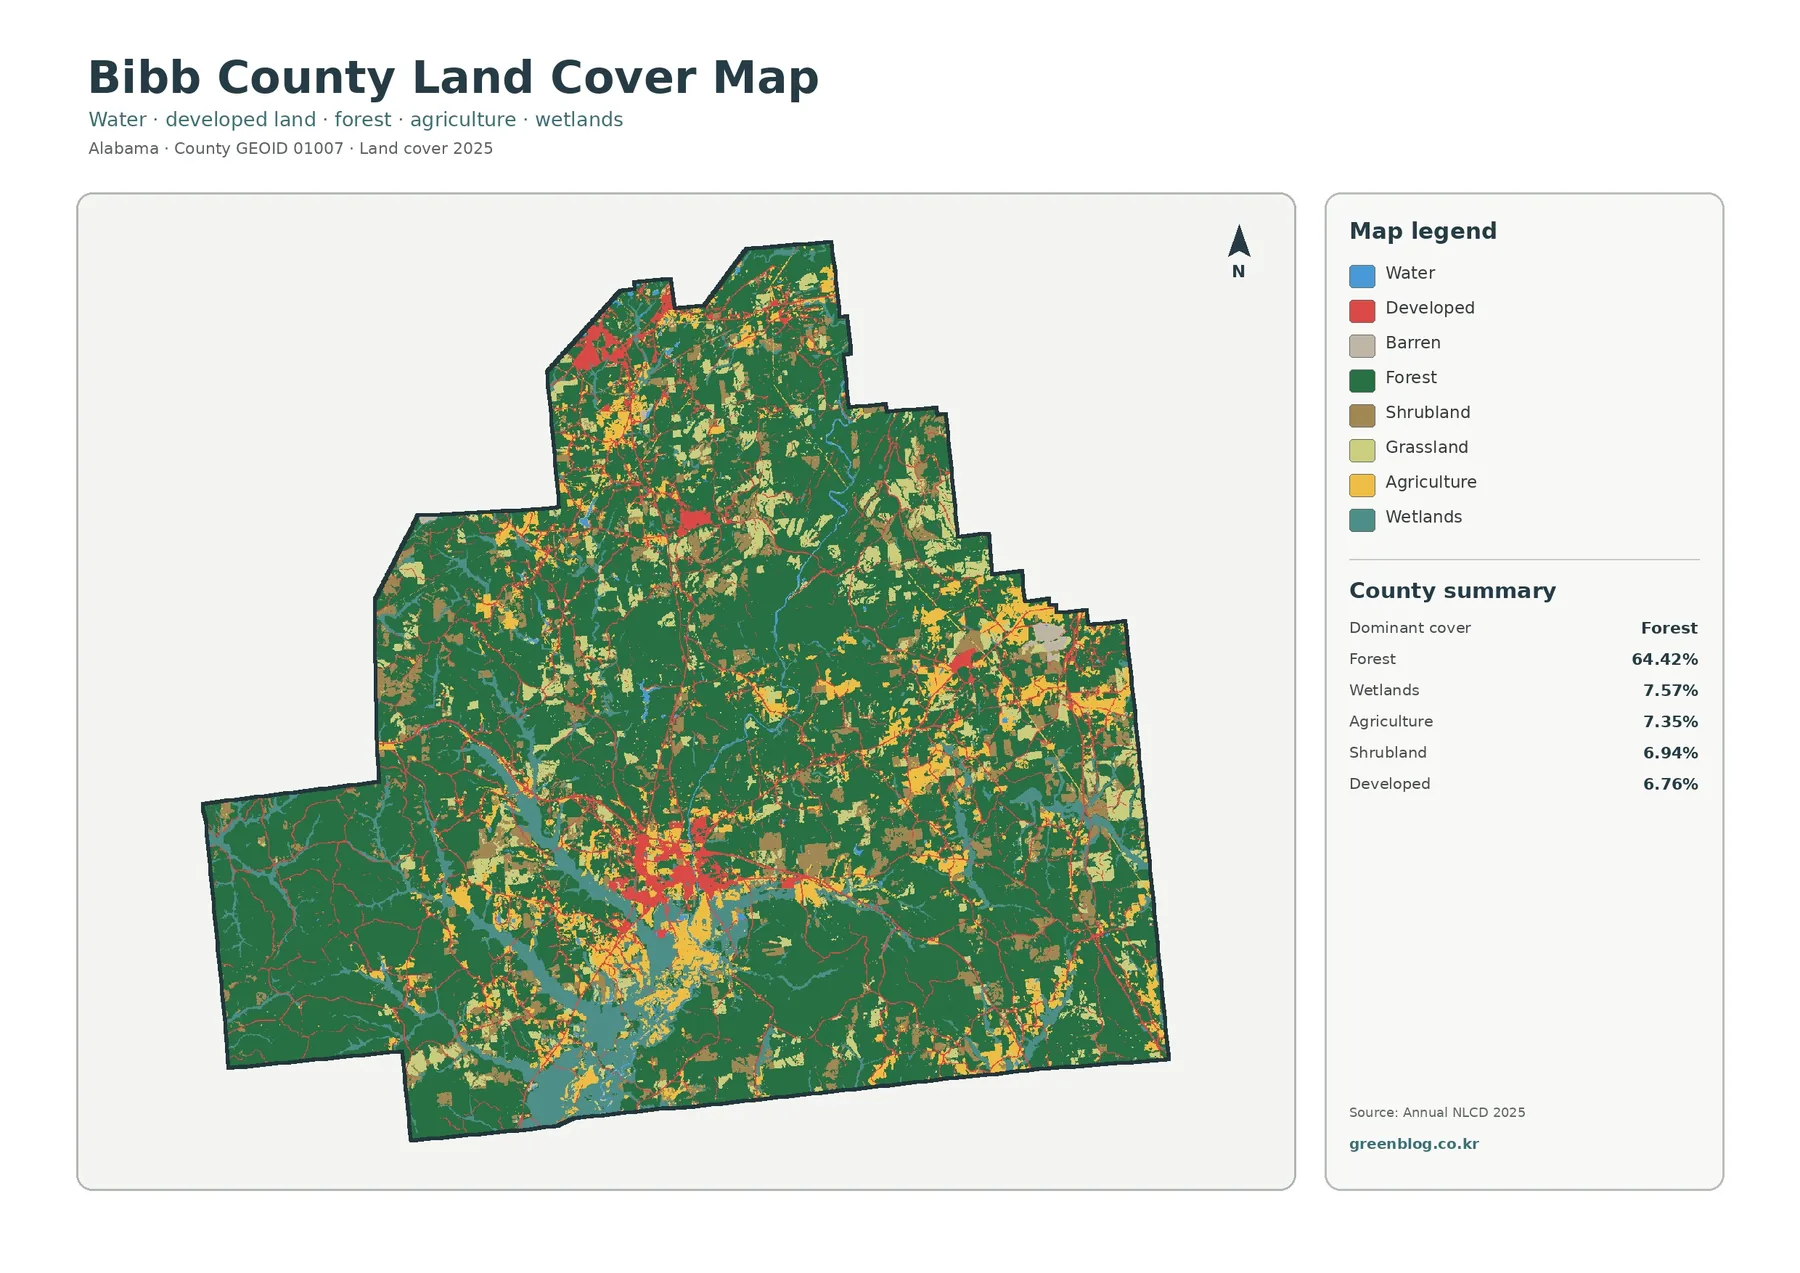
The general map is the best starting point because it keeps the full set of mapped classes visible. Dark green forest dominates, but the south-central portion is noticeably more complex, with red developed cover, yellow agriculture, wetland colors, and open vegetation close together. A smaller built concentration appears near the northern edge, and additional lighter patches occur in the eastern and northeastern portions. The result is a landscape with a few visibly denser settlement areas separated by broad wooded tracts rather than an even spread of development.
Wetlands are nearly as extensive as agriculture in the county summary. Their 7.57% share appears as teal patches and narrow, branching shapes that often lie beside water or follow drainage-like features. Water itself is only 0.53%, so the blue class covers relatively little total area even though narrow streams can extend a long distance across the county. The distinction is important: open water and wetlands are separate land-cover classes, and the map should not be read as if every teal area were a permanent lake or river channel.
Developed cover, at 6.76%, is easy to notice because the red symbol is visually strong. The largest red concentration sits in the south-central part of the county, with smaller concentrations to the north and east and thin linear traces between them. Bibb County’s official site lists Centreville, Brent, West Blocton, and Woodstock among its municipalities. Because the supplied map does not label municipal boundaries, individual red pixels should not be assigned to a particular city without another reference map. What the image does support is a clear contrast between compact built clusters and the much larger surrounding forest matrix.
Land cover is not the same thing as land use or zoning
Land cover classifies the physical surface that a satellite-based product detects: forest, water, wetland, agriculture, developed land, grass, shrub, and similar categories. Land use describes what people do with land, while zoning and parcel records are legal or administrative systems. A forest pixel is therefore not proof that the land is protected, publicly owned, or unavailable for development. An agricultural pixel does not establish a farm parcel boundary, and a developed class does not tell you what type of building is present. Property decisions require parcel, planning, and local government records.
Bibb County’s river setting adds useful context to the wetland pattern
The Cahaba River is an important part of Bibb County’s natural setting. The U.S. Fish and Wildlife Service states that Cahaba River National Wildlife Refuge is located in Bibb County and was established to protect a section of the river and adjacent land. The refuge information also emphasizes the river and its associated ecosystems. The supplied land-cover image does not label every watercourse, so it would be inaccurate to identify each blue or teal feature as the Cahaba River. Still, the official river context helps explain why water and wetland classes deserve attention even though open water occupies a small percentage of the county.
The forest-and-farmland view clarifies open land within the wooded matrix
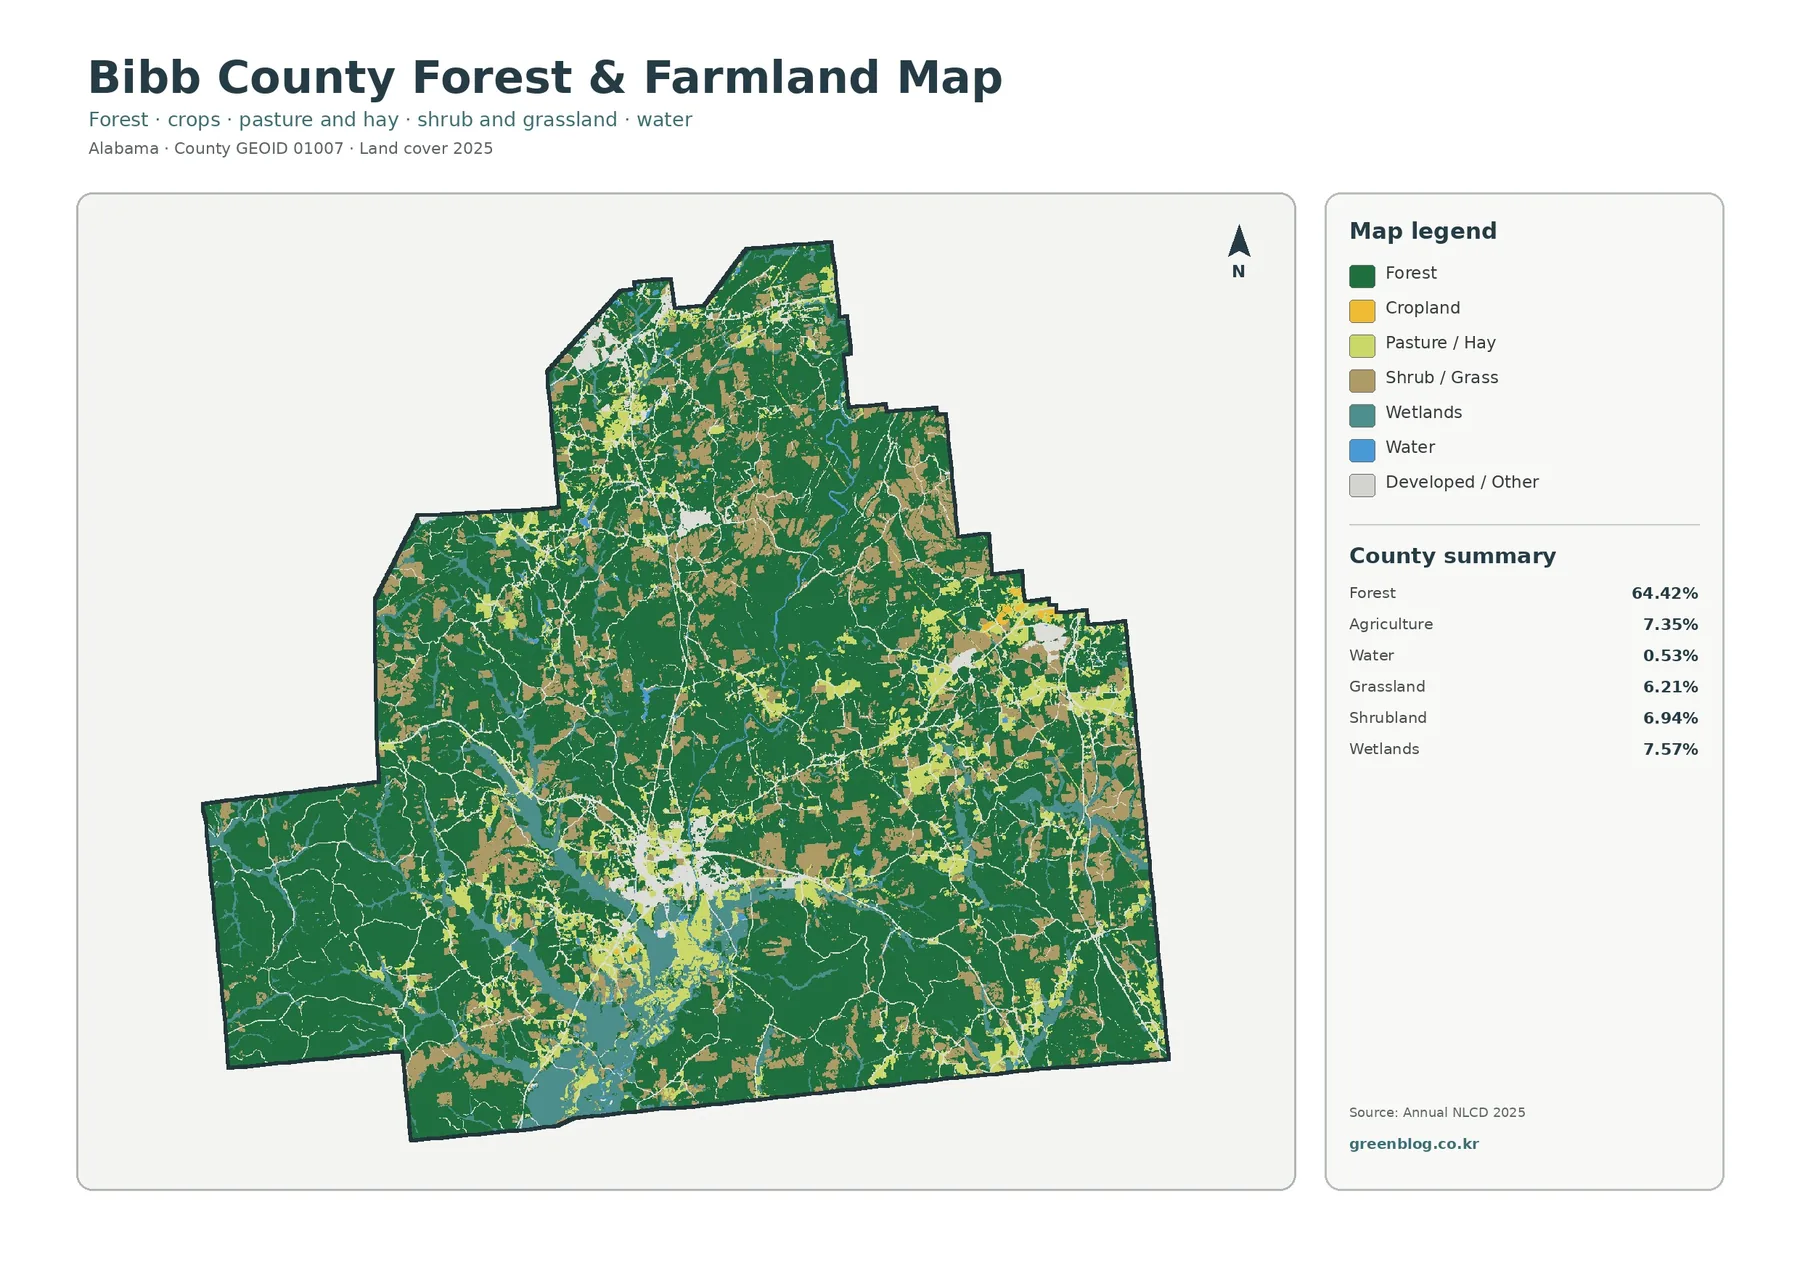
Reducing the visual emphasis on the full land-cover legend makes the rural pattern easier to read. Forest remains broad and continuous in the west, southwest, and much of the center. Cropland, pasture or hay, and shrub or grass appear as smaller pieces dispersed through the green background. Agriculture totals 7.35%, while grassland and shrubland are each a little above 6%. Those open classes therefore matter collectively even though none of them approaches forest in area.
The map also prevents a common reading error: not every pale or open-looking area is cropland. Some areas are pasture or hay, some are shrub or grass, some are wetlands, and developed or other land has its own symbol. Looking at the legend before describing a local patch keeps a rural landscape from being simplified into only “forest and farms.” This is particularly useful in the south-central and eastern parts of the county, where several open-cover classes occur near one another.
Impervious cover is small countywide but highly concentrated
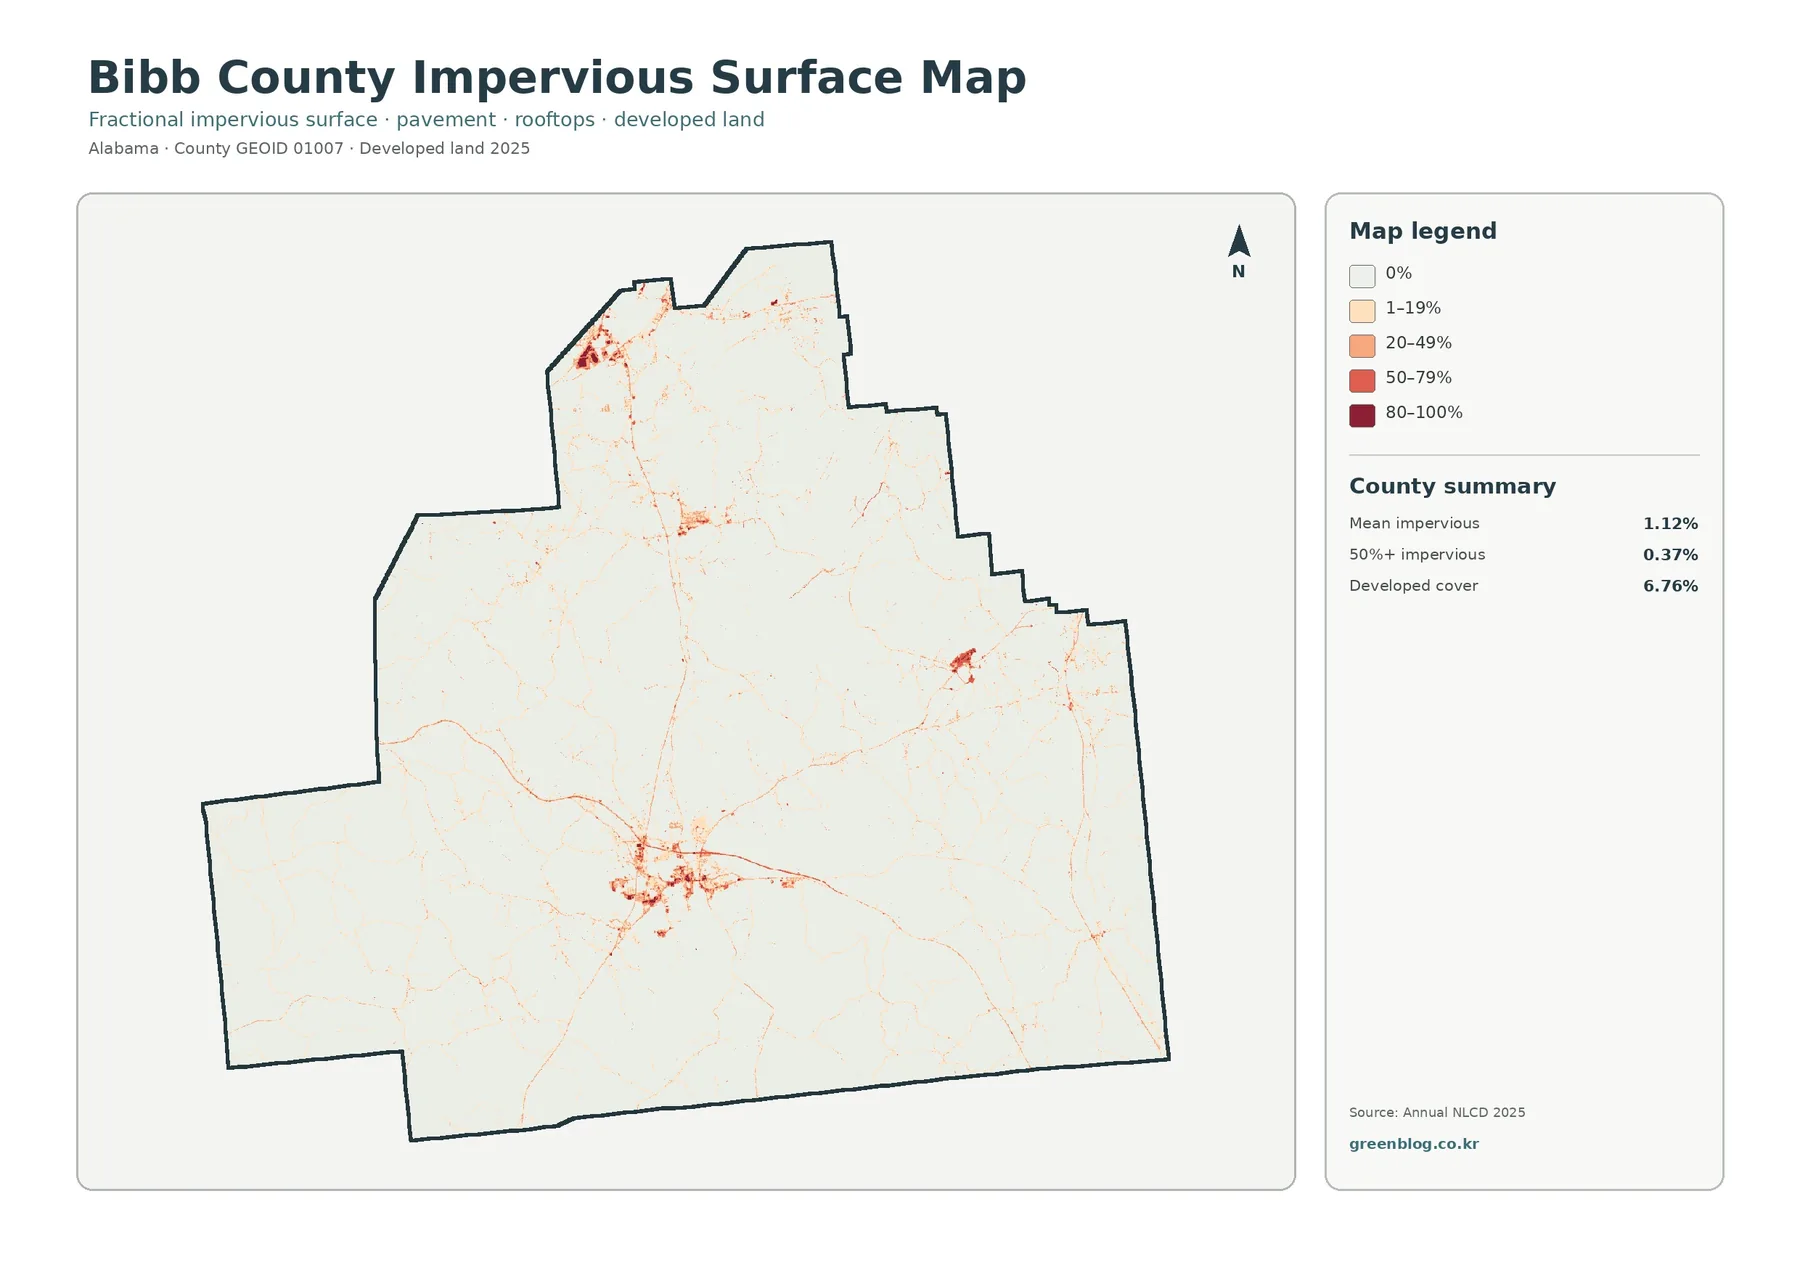
Impervious surface means pavement, roofs, parking areas, and other hard surfaces that rainwater does not readily soak through. Bibb County’s mean impervious value is 1.12%, and only 0.37% of the county is mapped at 50% or more impervious. Most of the county is therefore very pale on this map. The strongest colors collect in a south-central cluster, with another noticeable cluster near the north and a smaller concentration toward the east. Thin lines extend between and away from these centers.
The impervious pattern is much more selective than the 6.76% developed-cover figure on the general map. Developed classes can include houses, trees, lawns, and open ground in the same neighborhood, while the fractional impervious layer focuses on how much of the surface is actually hard and sealed. A low-density residential area may count as developed yet remain mostly permeable. This is why 6.76% developed cover and a 1.12% mean impervious value are not contradictory.
The 1985–2025 comparison contains several kinds of class difference
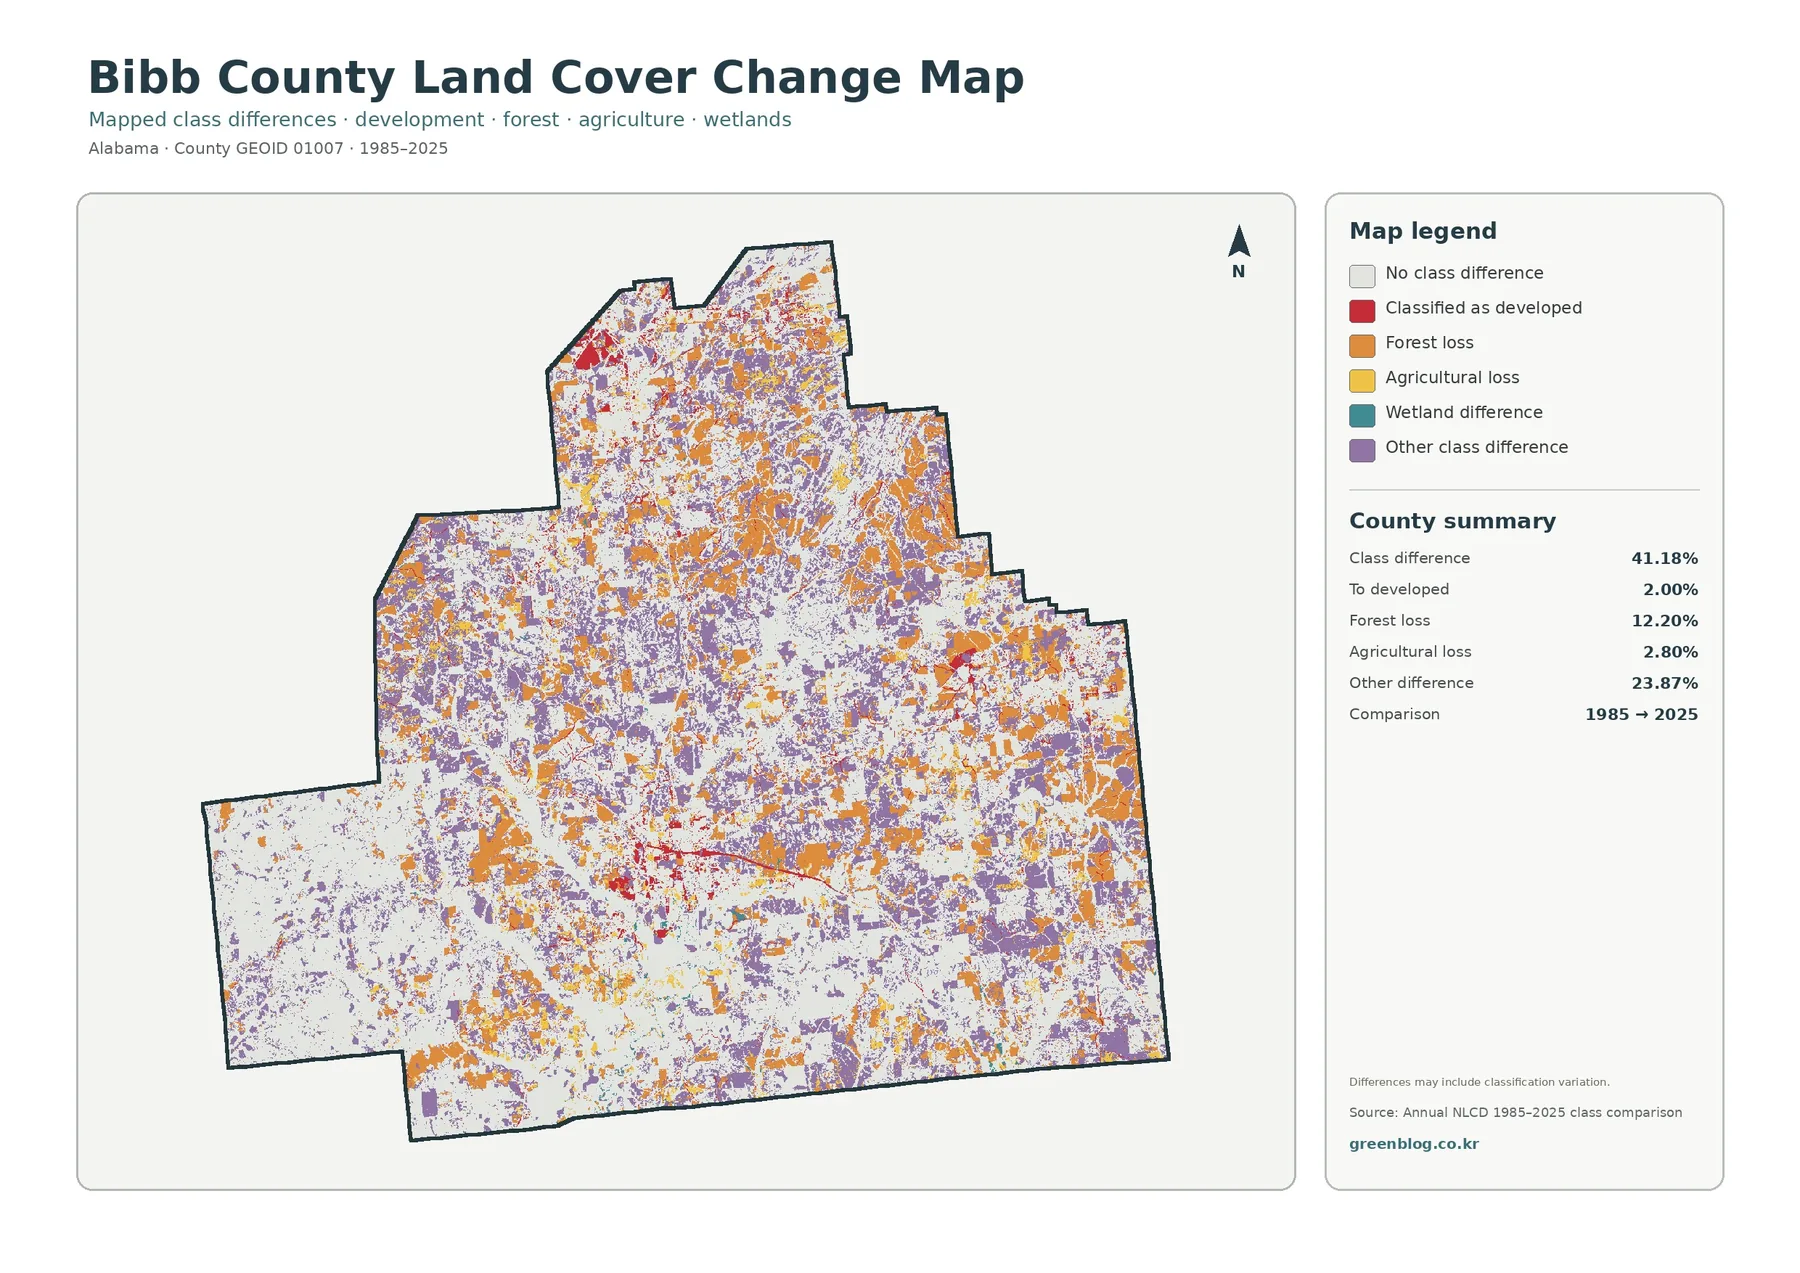
The endpoint comparison reports a class difference across 41.18% of Bibb County. Within the summary, 2.00% is labeled as changing to developed, 12.20% as forest loss, 2.80% as agricultural loss, and 23.87% as other class difference. Wetland difference is present in the legend, but the summary panel does not supply a separate percentage for it. The safest approach is therefore to use the values printed on the map and not invent an additional wetland-change number.
Orange forest-loss pixels and purple other-difference pixels are spread widely through the county rather than confined to one settlement. Red change-to-developed pixels cover a much smaller share and are most visible around the same general built concentrations that stand out on the current maps. Yellow agricultural-loss areas are scattered and less extensive than the orange forest-loss category. Because the largest listed component is the broad “other class difference” category at 23.87%, the image cannot be summarized accurately as a simple map of urban growth or forest clearing.
A change label indicates that the mapped class differs between the two endpoints. It does not, by itself, identify the physical cause or prove that a change was permanent. The map warns that differences can include classification variation. Forest-loss pixels may reflect real land-cover change, but important locations should be checked against intermediate Annual NLCD years, aerial imagery, and local information before conclusions are made about timber harvest, construction, agriculture, or restoration.
A practical way to compare the four maps
Start with the general map to find the broad forest background and the areas where several classes meet. Move to the forest-and-farmland map when you need a cleaner comparison between woodland and open rural cover. Use the impervious layer to separate actual hard surfaces from the wider developed class. Only after those current patterns are clear should the 1985–2025 comparison be used, because the change colors make more sense when the reader already knows what the county looks like in 2025.
Download the four original JPG maps
The ZIP contains four original JPG files: the 2025 general land-cover map, the forest-and-farmland map, the impervious-surface and developed-land map, and the 1985–2025 land-cover change map. The set is convenient when a larger source image is needed for a document, slide, classroom handout, or county comparison. Keeping the four views together also makes it easier to revisit the same location from a current-cover, rural-cover, built-surface, and long-term-change perspective.
Resolution, raster cells, and mixed pixels
Annual NLCD is a raster product based on Landsat imagery with 30-meter spatial resolution. A raster divides the land into grid cells and assigns a representative class or value to each cell. A narrow road, small stream, yard, and trees can all occur within one cell, so the map may generalize a complex real-world edge. A mixed pixel is simply a cell where more than one kind of surface is present even though the dataset must represent it with a single mapped value or dominant classification.
Those limits are especially important for endpoint change. A class difference between 1985 and 2025 does not reveal every transition that may have happened during the intervening years. A location could have changed more than once, or a borderline cell could be classified differently because of image or classification conditions. For county-scale questions such as where forest dominates, where hard surfaces cluster, or where many class differences appear, the maps remain useful. For site-specific decisions, more detailed and more recent local data are necessary.
Frequently Asked Questions
Does 64.42% forest mean most of Bibb County is one continuous forest?
No. Forest is the largest single class, but wetlands, agriculture, shrubland, grassland, developed cover, and water repeatedly interrupt it. The map contains some broad forest blocks, especially in the west and southwest, while other parts of the county show a finer mixture. The percentage also says nothing about tree species, stand age, ownership, or management.
Why is developed cover 6.76% while mean impervious surface is only 1.12%?
Developed land is a broader land-cover class. A developed neighborhood can contain roofs and pavement but also lawns, trees, and other permeable ground. Fractional impervious surface estimates the hard portion more directly. Low-density development can therefore contribute to the developed class without producing a high countywide impervious average.
Does the 41.18% class-difference value mean 41.18% of the county was developed?
No. The 41.18% figure combines multiple kinds of differences between 1985 and 2025. Only 2.00% is labeled as changing to developed. The summary also includes 12.20% forest loss, 2.80% agricultural loss, and 23.87% other class difference, while the legend separately includes wetland difference. Classification variation may contribute to some mapped changes, so causes should be verified with additional evidence.
Map File Information
Bibb County land cover map JPG download
- Included Files: Use only the versions confirmed in the article and supplied images
- File Type: Use the confirmed download contents
- Intended Use: Printing, education, presentations, and map-based projects
Related Maps
- Autauga County Alabama Land Cover Map
- Baldwin County Alabama Land Cover Map
- Barbour County Alabama Land Cover Map
Sources and further reading
Percentages and change values in this article come from the supplied Bibb County map images. The official resources below provide the Annual NLCD classification background, county boundary data, and local context for the Cahaba River and Bibb County.
- MRLC Annual NLCD Data – official access to Annual NLCD land-cover and related products.
- USGS Annual NLCD Land Cover Classification – official description of land-cover classes and interpretation.
- U.S. Census Bureau TIGER/Line Shapefiles – official county boundary and geographic data resources.
- U.S. Fish & Wildlife Service – Cahaba River National Wildlife Refuge – official information about the refuge and the Cahaba River setting in Bibb County.
- Bibb County, Alabama official website – county government and municipality information for Centreville, Brent, West Blocton, Woodstock, and other local communities.
Green Map creates custom-edited map images using open geographic data sources such as geoBoundaries, Natural Earth, OpenStreetMap, and government open data.
These maps are edited visual materials, not raw data files, and are provided for education, documents, presentations, and graphic reference.