Schoharie County is overwhelmingly green on the 2025 land-cover map, but the county is not uniform. Forest accounts for 60.83% of the mapped area, while agriculture covers 25.97%. Farm fields are much more common across the northern part of the county, broad forest dominates much of the south and center, and developed land appears in small settlement and transportation corridors rather than as one large urban block.
This page brings four views of the same county together: general land cover, forest and farmland, impervious surface, and mapped class differences between 1985 and 2025. The four original JPG maps are available in one ZIP for printing, teaching, presentations, and side-by-side reference. Land cover describes what physically covers the ground; it does not establish property ownership, zoning, development rights, or legal wetland boundaries.
Table of Contents
A county defined by forest and farm country
The strongest countywide pattern is the contrast between the wooded south and the more agricultural north. Large dark-green areas occupy much of the southern half, with additional forest extending through the middle of the county. Farther north, yellow agricultural areas become more frequent and form a finer patchwork among wooded parcels and settlement areas. That transition matters because the countywide statistics alone cannot show how differently the same 60.83% forest share is distributed from one end of Schoharie County to the other.
Agriculture is the second-largest mapped class at 25.97%. It forms broad groups of fields in the north and northwest, then follows more open terrain and valleys into the central part of the county. Smaller agricultural patches also appear inside the forest-heavy south. The resulting landscape is not a simple north-south split. Fields, woods, wetlands, roads, and small communities interlock in many places, which is why a map view is more useful than a list of percentages for understanding the county.
Developed land covers 7.44%, and its placement is more important than its total share. Red developed cells gather around the north-central settlement corridor and appear as smaller nodes connected by thin lines. Schoharie County planning documents describe a highway and rail corridor passing through Esperance, Schoharie, Cobleskill, and Richmondville as an important location for communities and services. That official context is consistent with the concentration seen on the maps, although the land-cover image by itself cannot prove why any individual site developed.
Wetlands make up 4.27% of the county summary. They occur as scattered blue-green patches rather than a single dominant wetland complex, and they appear among both farmland and forest. Water is only 0.74% by area, yet the blue shapes in the south and the creek corridor are valuable reference points when comparing maps. The relatively small water percentage should not be confused with ecological or practical importance; a narrow stream can matter greatly to a watershed even when it occupies little map area.
Read the 2025 land-cover map first
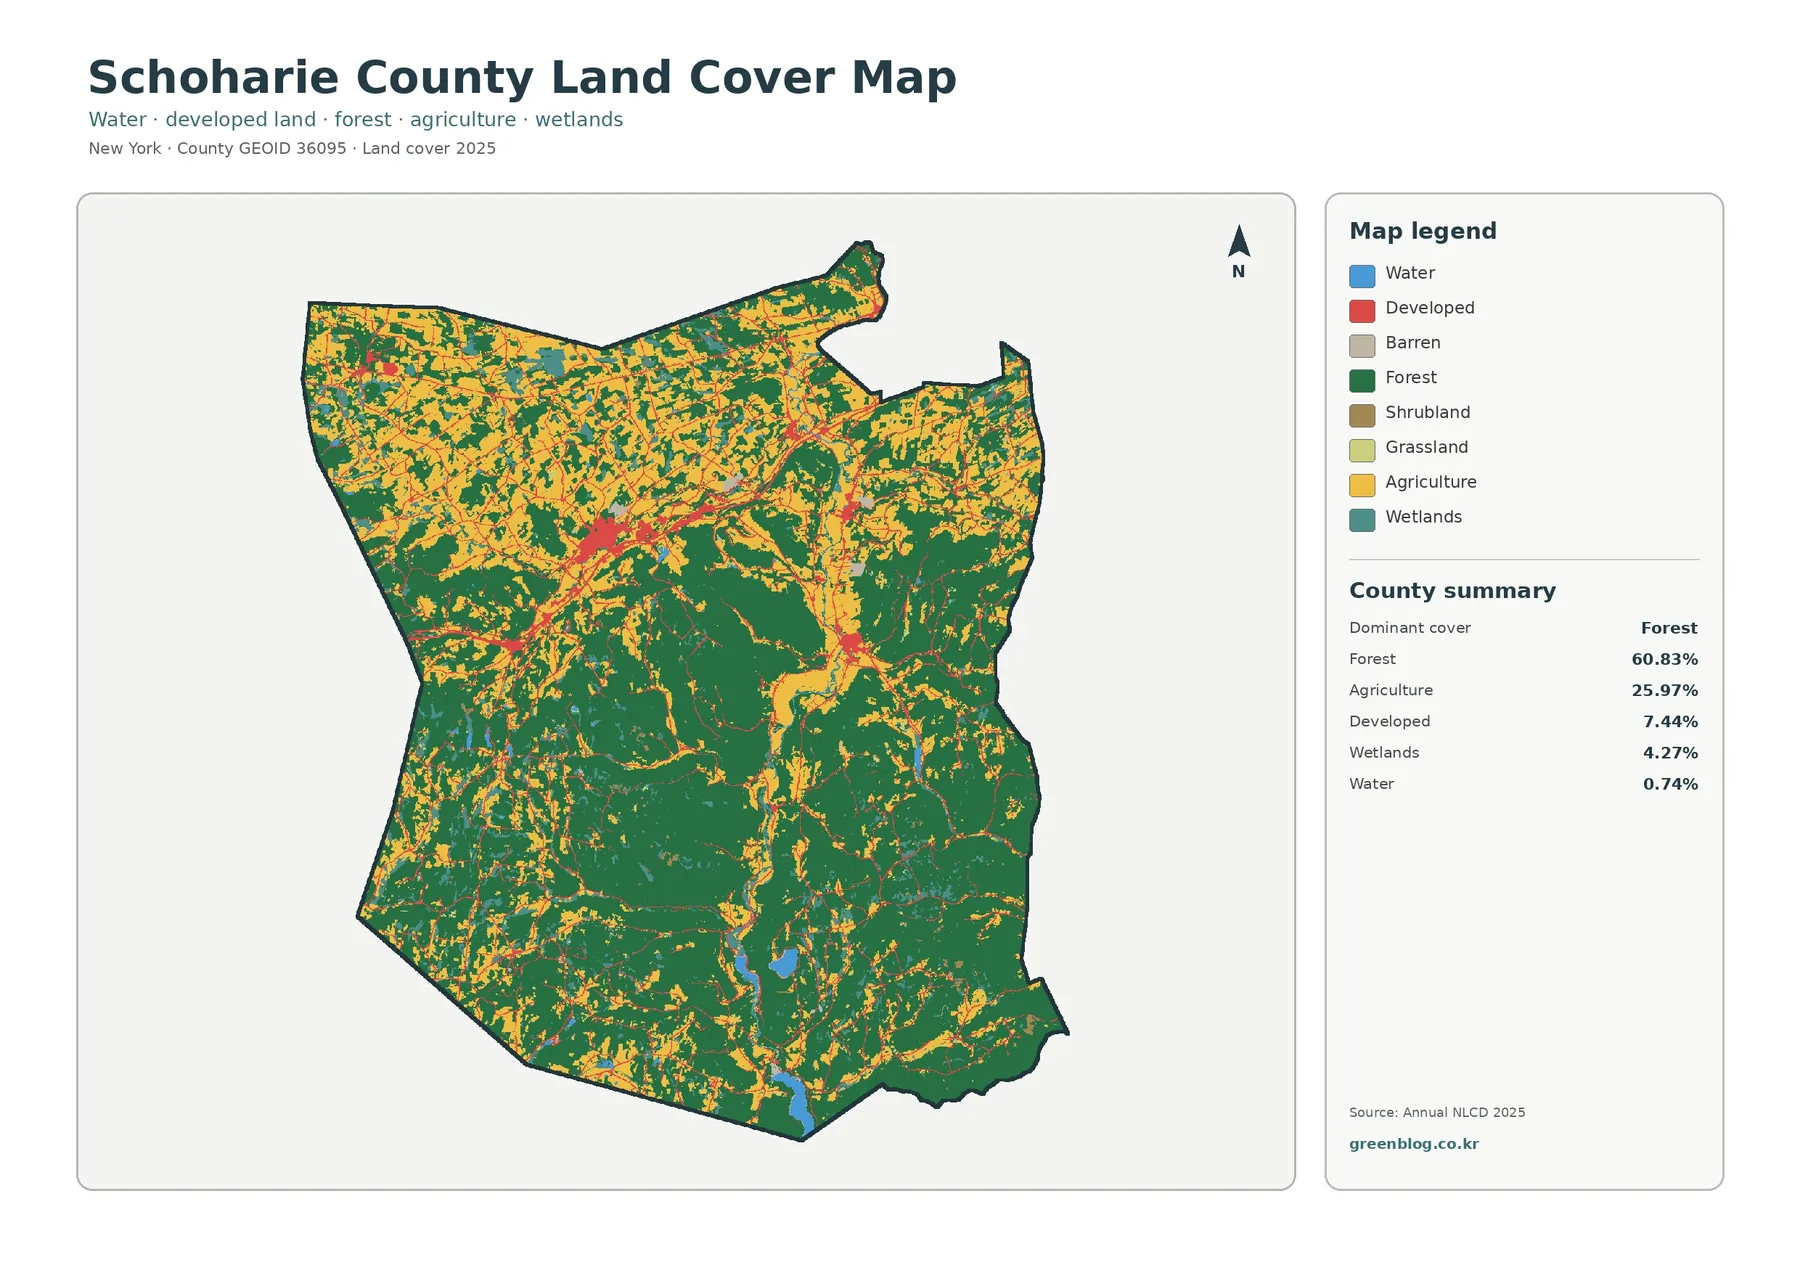
The general map is the best place to establish orientation because it keeps the major classes visible at the same time. The southern half reads as a broad forest region broken by narrow openings, small agricultural areas, water, and settlement lines. In the northern half, yellow agriculture becomes much more common and the red developed pattern is easier to notice. The central part of the county acts as a transition where farms, forest, small communities, and the Schoharie Creek corridor meet.
The legend also includes barren land, shrubland, and grassland. These classes are present in much smaller amounts than forest or agriculture, so they do not control the countywide visual pattern. Their value is local: they can mark transitional surfaces along field edges, recently changed land, open ground, or areas that do not fit the dominant categories. A small colored patch should be treated as a generalized raster classification, not as a surveyed parcel with a precise legal edge.
Schoharie Creek provides useful geographic context for the water and wetland pattern. New York City’s Department of Environmental Protection explains that Schoharie Reservoir is formed by damming Schoharie Creek and that the creek continues north before ultimately draining to the Mohawk River. On the county map, the southern water bodies and the creek-oriented valley help organize the surrounding forest and agricultural cover. The map does not show flow, water quality, flood depth, or reservoir operating boundaries, so those questions require separate hydrologic or agency data.
Use the statistics and image together. A forest share of 60.83% says that forest is dominant, but the map explains that the dominance is strongest across the south and center. Agriculture at 25.97% sounds substantial, and the map shows why: the northern farm country contains many repeated field-shaped patches. Developed cover at 7.44% is modest countywide, yet it becomes highly visible where it clusters near communities. The county summary answers “how much”; the map answers “where.”
Forest and farmland become the main story
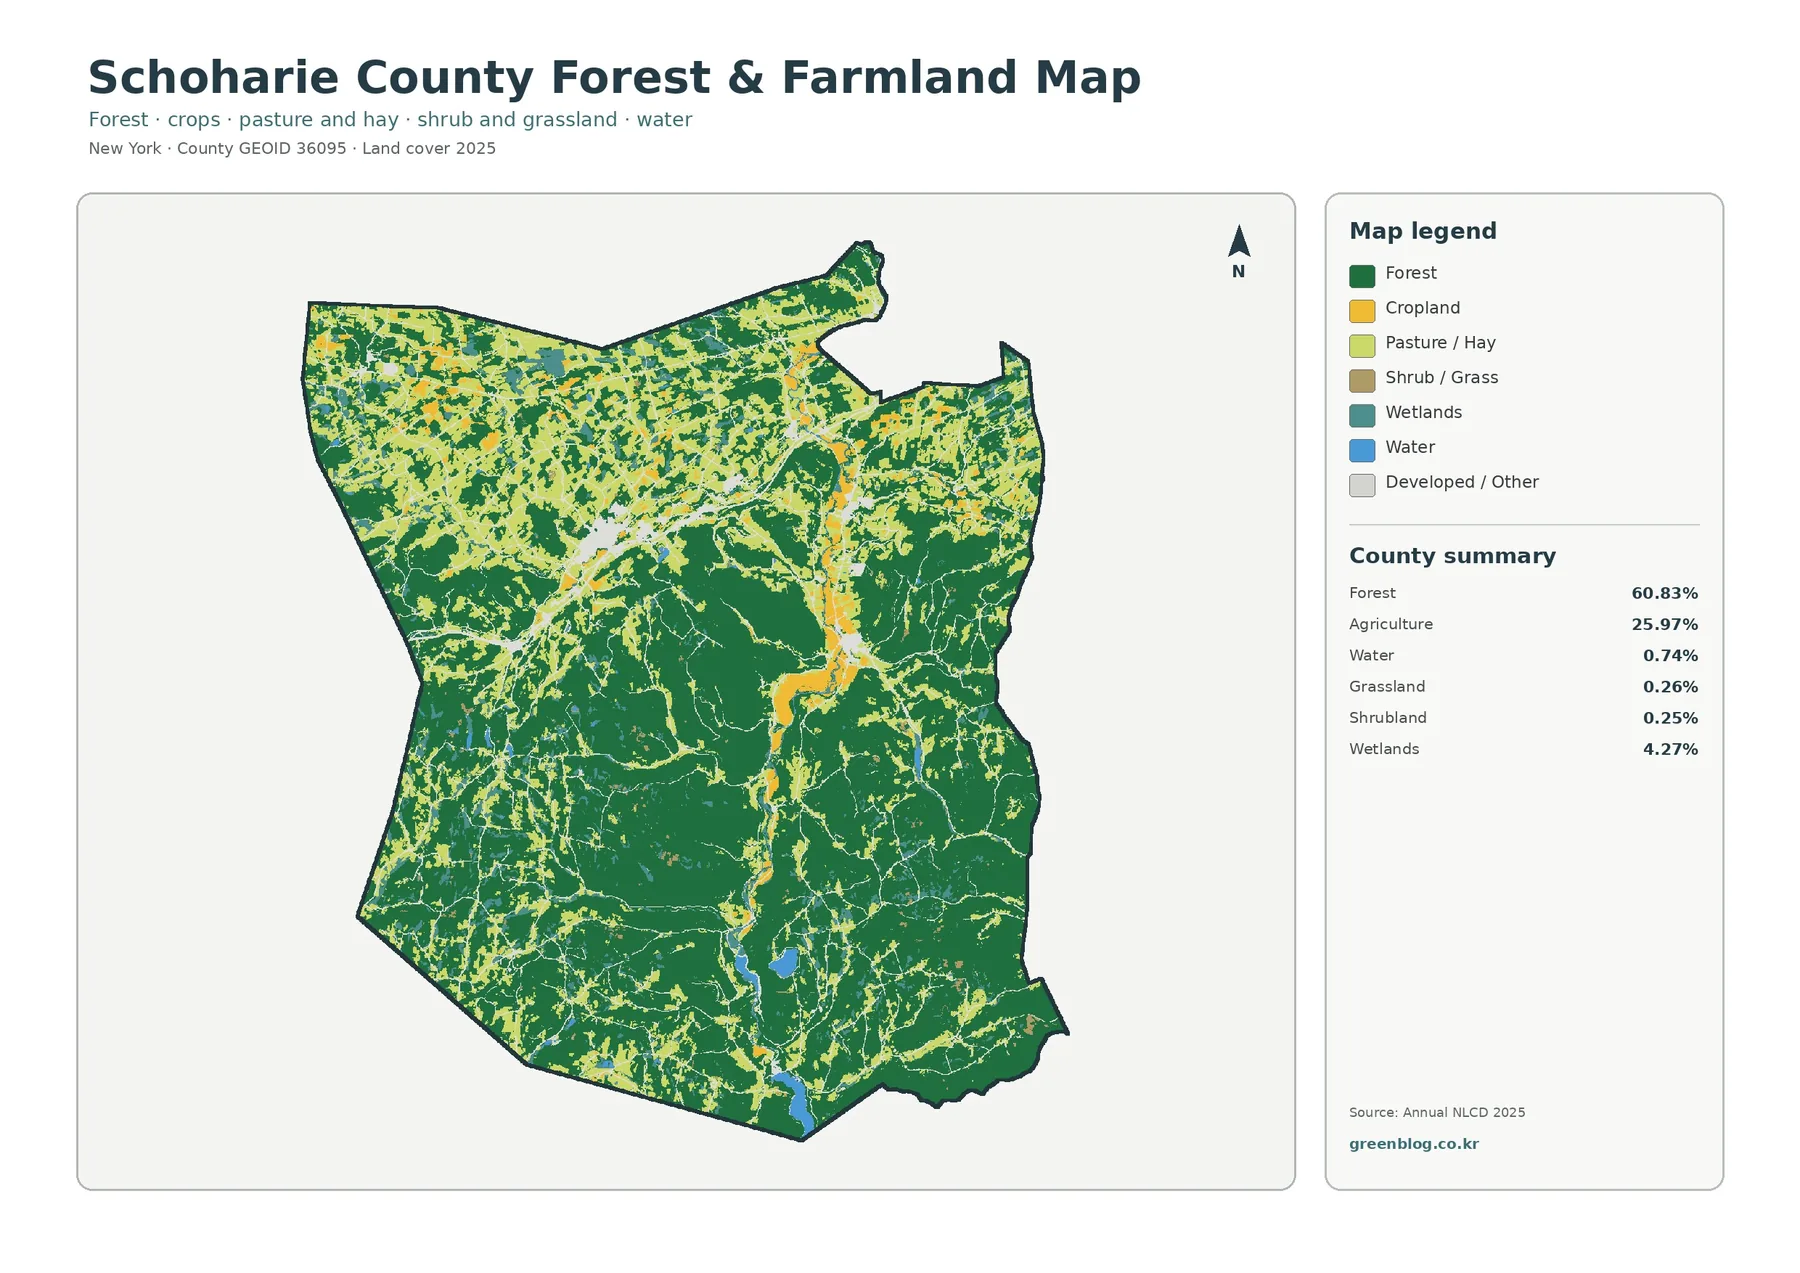
Removing most of the visual emphasis from development makes the rural pattern much easier to read. Dark green is nearly continuous across large parts of the south, while yellow and light agricultural tones are much more frequent in the north. In the middle of the county, fields often follow open areas between wooded uplands. The map is especially useful for comparing the shape of farmland rather than simply its total area, because fields appear as repeated patches and belts rather than one uninterrupted agricultural zone.
The county’s Soil and Water Conservation District describes agriculture as a major part of its natural-resource work. Its programs support local farms with practices such as riparian buffers, no-till planting, and cover crops. Those programs do not identify the farms shown by individual map cells, but they provide useful local context for why the relationship among fields, streams, soil, and vegetation matters in Schoharie County. The map can therefore support an introductory watershed or agricultural-conservation discussion without being mistaken for a farm parcel map.
Forest should be interpreted with the same care. A green cell indicates forest cover, not public ownership or protected status. Large wooded blocks in the southern county may cross many ownership boundaries, and narrow roads or clearings can be generalized within the raster cells. If the goal is to evaluate habitat continuity, timber ownership, public access, or a conservation easement, the land-cover image should be paired with more detailed roads, parcels, management boundaries, and field observations.
The smaller grassland and shrubland categories are useful around the edges of the dominant classes. They can appear where fields are not mapped as active agriculture or where vegetation is more open than forest. Because these categories occupy limited area, they are easy to overlook at full-county scale. Zooming in can help locate them, but the resolution still places a limit on precision. A narrow meadow or hedgerow can share a grid cell with trees, soil, or pavement.
For classroom use, the northern and southern halves make a clear comparison exercise. Students can choose equal-sized areas in each half and record which cover types appear most often, then relate those observations to the county percentages. A second step is to look for wetlands or water within both regions. That approach demonstrates that a forest-dominated county can still contain important farm districts, settlements, and aquatic features, while an agricultural area can still retain many wooded patches.
Impervious surface reveals small settlement centers
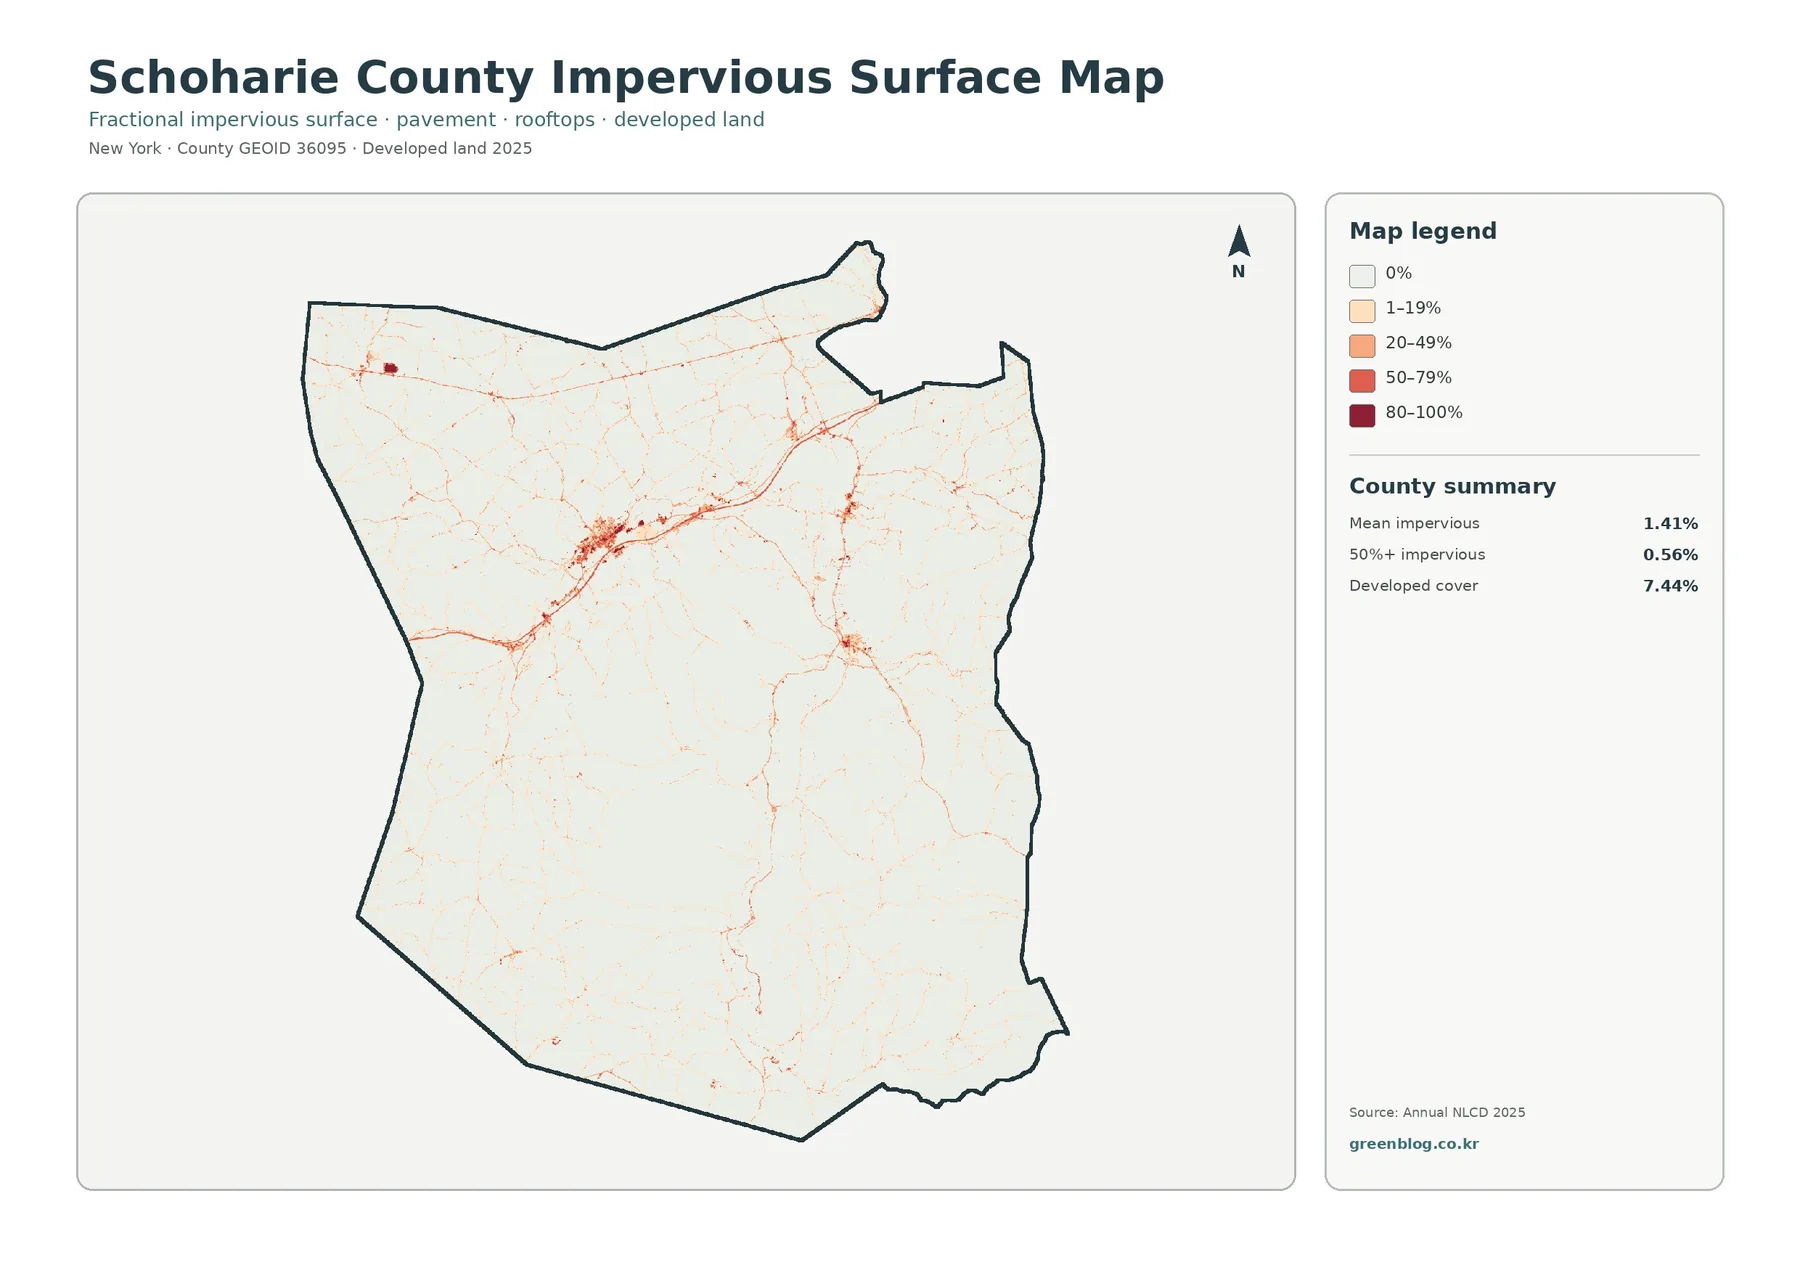
Impervious surface means pavement, rooftops, parking areas, and other hard surfaces that do not readily absorb rain into the soil. Schoharie County’s mean impervious value is only 1.41%, and areas with at least 50% impervious cover account for 0.56%. Those figures fit the forest-and-farm character of the county. Most of the map stays near zero, while higher values form compact dots and thin lines rather than broad urban fields.
The most noticeable clusters sit in the northern and north-central portion of the county. A larger concentration appears around the Cobleskill area, with additional marks around Schoharie and other communities along the broader transportation corridor. Thin lines extend between settlement nodes and into rural areas. The pattern makes a useful distinction: developed land can cover 7.44% of the county even though the average amount of truly hard surface is much lower.
That difference occurs because a developed land-cover cell can include grass, trees, soil, and other permeable surfaces along with buildings or pavement. A low-density residential area may be classified as developed while most of the cell is still lawn or vegetation. The impervious layer measures the hard-surface fraction more directly. For that reason, developed percentage and mean impervious percentage should never be treated as interchangeable measurements.
The southern part of the county remains very light overall, but faint road and settlement traces are still visible inside the forest. This is useful when explaining that rural does not mean roadless or unbuilt. The difference is one of concentration. Hard surfaces occupy smaller, narrower footprints in the forested south than around the northern community centers. Comparing this map with the general land-cover layer shows where a red developed class contains a dense hard core and where it contains more vegetation.
Impervious cover is often discussed in connection with stormwater, but this map should not be used as a flood-risk map. More pavement generally leaves less ground available for infiltration, yet flood behavior also depends on slope, soils, rainfall, drainage infrastructure, stream condition, and many other variables. Schoharie County Soil and Water Conservation District maintains separate stream and drainage programs, which is a useful reminder that surface-cover mapping is only one part of watershed assessment.
What changed between 1985 and 2025?
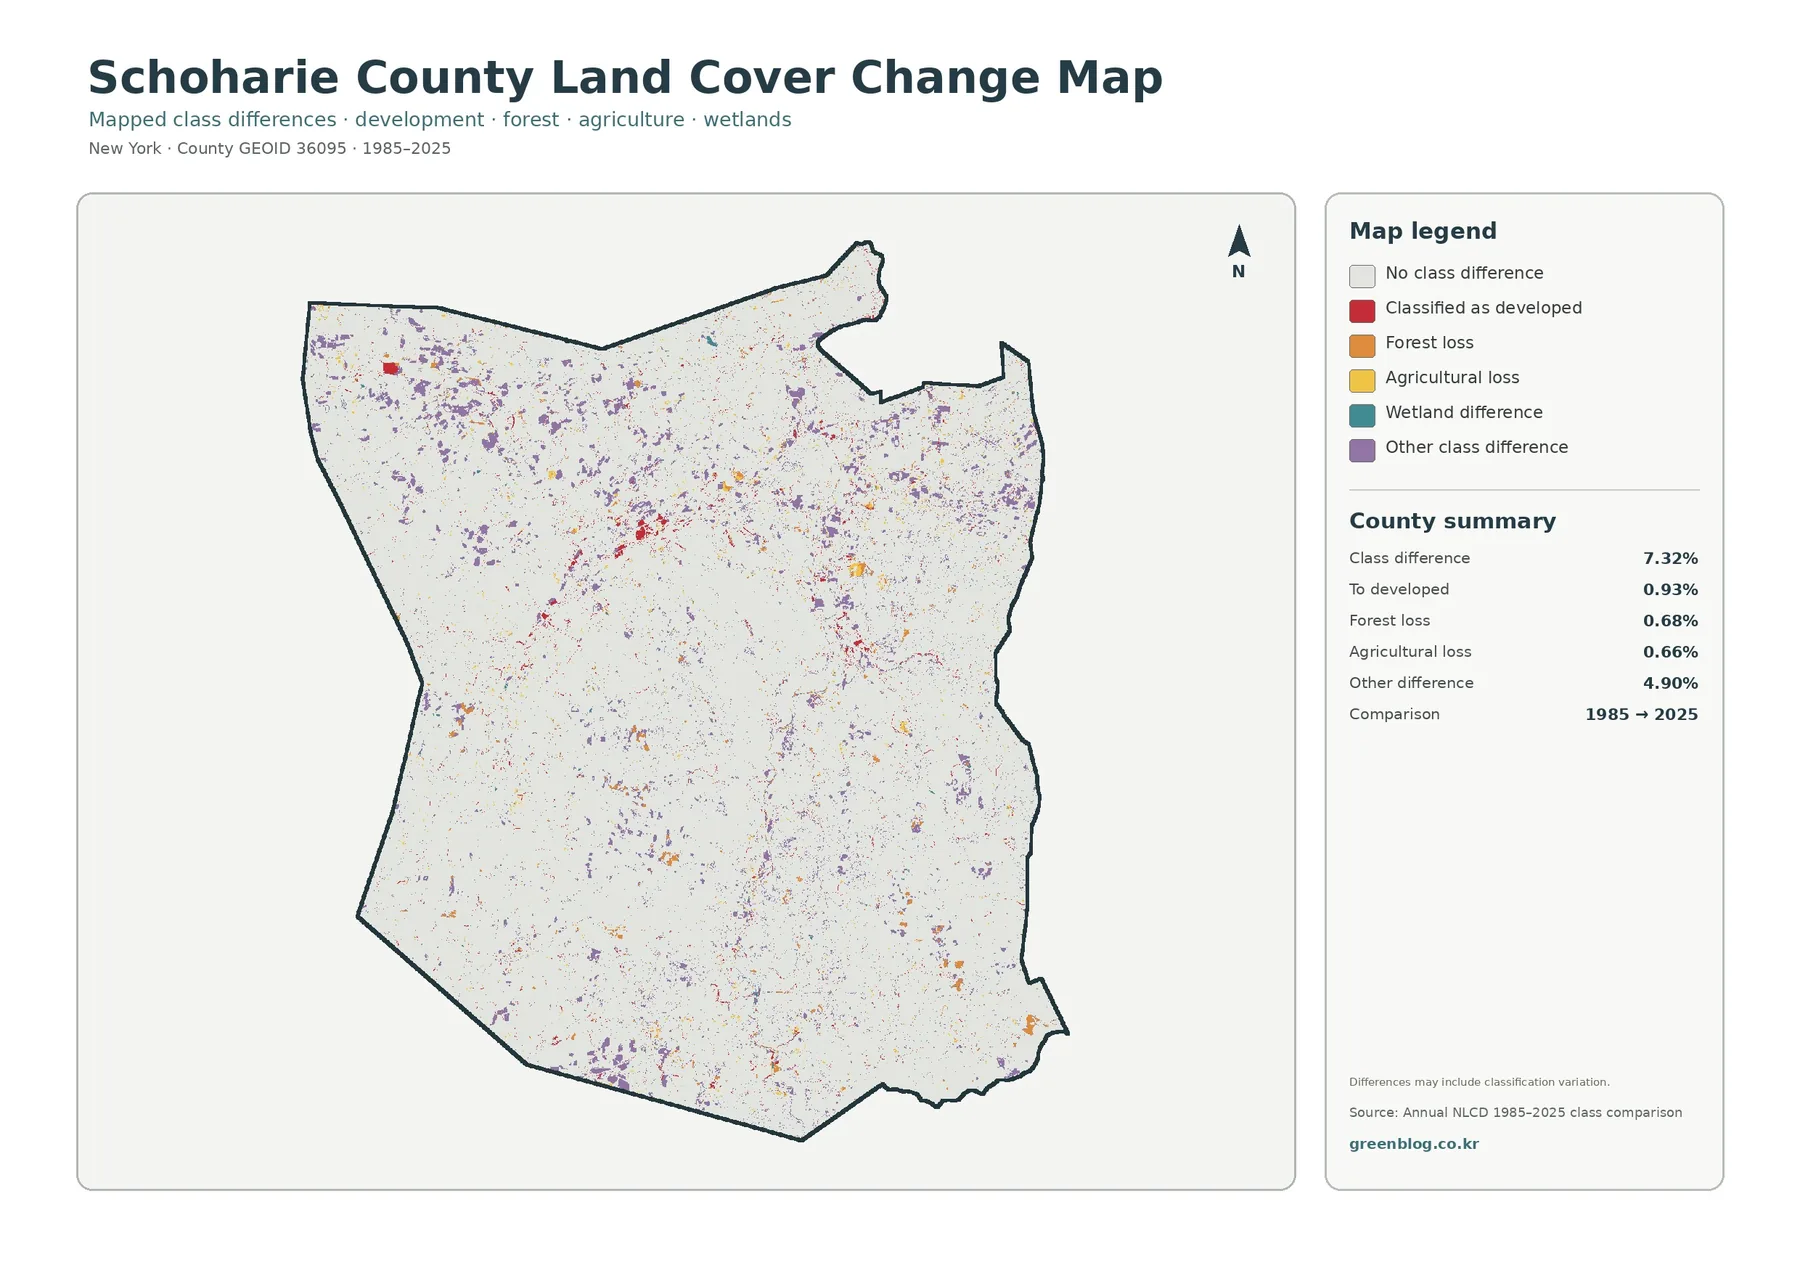
The two-date comparison reports a class difference across 7.32% of the county. Change to developed accounts for 0.93%, forest loss for 0.68%, agricultural loss for 0.66%, and other class differences for 4.90%. The large light background is important: most cells are not marked as different between the two endpoints. The colored cells identify places that deserve closer examination rather than proving that every marked location experienced one specific type of land-use event.
Red “to developed” marks are more noticeable around the northern settlement corridor and in several smaller nodes. Some of these areas overlap places that have higher impervious values in 2025, but the layers answer different questions. The impervious map measures hard surface at the current endpoint, while the change map compares class labels between two years. A location can be developed in 2025 without being newly developed in the comparison, and a class difference can occur without producing a high impervious value.
Forest-loss and agricultural-loss cells appear as small, dispersed marks across both northern and southern parts of the county. That scattered pattern cautions against a single countywide narrative. A change cell may reflect a real shift in vegetation or land cover, but classification boundaries, image conditions, and mixed pixels can also affect the result. Before assigning a cause such as construction, clearing, abandonment, or regrowth, compare the location with dated imagery and local records.
Other class differences make up 4.90%, the largest summarized change category. Purple marks are dispersed rather than concentrated in one huge block. That matters because the total 7.32% should not be described as “development.” It includes transitions among several cover classes as well as differences that may relate to classification. The legend needs to stay beside the map whenever the graphic is used in a presentation so viewers do not confuse all colored cells with a single type of change.
The comparison also has a time limitation. It uses 1985 and 2025 endpoints, so it cannot reconstruct the sequence of changes during the forty years between them. A field could have changed to grass and later returned to agriculture, or a disturbed forest could have regrown before 2025. Annual NLCD data from intermediate years, aerial imagery, and local planning records are better tools when the timing of a specific change is important.
Schoharie Creek and the southern water context
Water occupies only 0.74% of the county summary, yet the creek and reservoir system gives structure to several map patterns. NYC DEP identifies Schoharie Reservoir as a reservoir formed by Schoharie Creek near Gilboa and notes that the creek continues north toward the Mohawk River. The reservoir watershed includes parts of Broome, Conesville, Gilboa, and Sullivan in Schoharie County. Those named places provide real geographic context for the blue water and surrounding forest visible in the southern portion of the maps.
The county Soil and Water Conservation District also works directly with stream concerns, including bank erosion, drainage, pond evaluation, and stream design assistance. It has operated stream programs for years and maintains monitoring activity along Schoharie Creek. These services show why a land-cover map is useful as background but insufficient for a stream-management decision. Cover classes can identify surrounding forest, agriculture, wetlands, and development, while water levels, channel condition, permits, and engineering require their own datasets.
When using the maps for watershed education, begin with the creek and reservoirs as reference points and then compare the adjacent land cover. Forest is widespread around much of the southern water system, but agriculture and small developed traces are also present. Wetlands occur in scattered locations rather than forming a single band. This kind of comparison helps explain why a watershed contains many surface types even when one class, such as forest, dominates the county as a whole.
Choose the map that matches the question
Use the general land-cover map when the goal is a broad county overview. It keeps forest, agriculture, development, wetlands, water, and smaller categories visible in one legend. The forest-and-farmland version is better when the story concerns rural landscape, habitat context, or the relationship between fields and woods. Because development is visually subdued there, the north-south contrast becomes easier to explain.
The impervious map is the right choice for questions about the intensity of hard built surface. It reveals that Schoharie County has a very low mean impervious share even though several settlement nodes stand out. The change map serves a different purpose: locating cells whose classification differs between 1985 and 2025. Keeping those roles separate prevents the common mistake of using one map as evidence for a question it was not designed to answer.
For a presentation, one practical sequence is current land cover first, forest and farmland second, impervious surface third, and class change last. That order moves from the easiest countywide pattern to more specialized interpretation. A classroom worksheet can ask students to follow the same location through all four maps. Cobleskill, the Schoharie corridor, or a southern reservoir area can each reveal different relationships among present cover, hard surfaces, and mapped change.
Download the four Schoharie County JPG maps
The downloadable ZIP contains four original JPG files: general 2025 land cover, forest and farmland, impervious/developed surface, and 1985–2025 land-cover change. Each map includes its own title, legend, and county summary, so the files can be used independently after download. The set works well for printed handouts, slide decks, classroom comparison, county research notes, and map-based visual references.
Select the file according to the task rather than treating the four maps as interchangeable. Use the general map for a summary, the forest/farmland map for rural cover, the impervious map for hard-surface concentration, and the change map for two-date differences. Keeping the full set together makes it easy to return to the same location and ask a different question without searching for separate files.
Scale, date, and classification limits
Annual NLCD is raster data, meaning the landscape is represented by a grid rather than surveyed parcel shapes. One grid cell can contain more than one real-world surface. At a forest edge, for example, trees, a road shoulder, lawn, and a field can all influence what falls inside the same cell. This mixed-pixel effect is why narrow features and class boundaries should be interpreted as generalized rather than exact.
The year label is another important limit. USGS explains that Annual NLCD land-cover values are generally associated with July 1 because of the processing approach, and some spectral changes in the second half of a year can appear in the following year’s product. The 2025 maps are therefore annual classifications, not photographs taken on one precise day. Changes after the mapped year will not appear until later data are produced.
Land cover is not the same as legal land use. A forest cell does not identify a public park or conservation easement. An agricultural cell does not confirm an agricultural district or active farm parcel. Developed cover does not separate residential, commercial, and industrial zoning, and a wetland class is not a regulatory delineation. Property, tax, zoning, permit, and jurisdiction questions require current official records from the county, local municipalities, or the relevant state agency.
Countywide averages can also hide local variation. Mean impervious cover of 1.41% does not mean that every village, road corridor, or rural town is 1.41% paved. Forest at 60.83% does not mean the north and south have equal forest shares. Schoharie County has clear internal contrasts, so the statistic and the image should always be read together. The number summarizes amount; the map provides location.
The change layer carries additional uncertainty because it compares classifications from two dates. A marked cell can represent a real surface transition, but it can also be affected by classification decisions, image quality, or mixed cells. A sound workflow uses the change map to identify candidate areas and then checks those locations with intermediate imagery, planning records, field information, or other authoritative data before describing a cause.
Frequently Asked Questions
What is the largest 2025 land-cover class in Schoharie County?
Forest is the largest class at 60.83%. Agriculture follows at 25.97%. The map shows the strongest forest concentration across the south and center, while agricultural fields are especially frequent in the north and northwest. Developed land is 7.44%, wetlands 4.27%, and water 0.74%.
Why is developed cover 7.44% while mean impervious cover is only 1.41%?
A developed land-cover cell can still contain lawns, trees, soil, and other permeable surfaces. The impervious product measures the hard-surface fraction more directly. Because the two layers measure different aspects of development, a lower impervious average is expected and should not be treated as a contradiction.
Does the 7.32% class-difference value mean that 7.32% of the county was developed?
No. The 7.32% value includes all mapped class differences between 1985 and 2025. Change to developed is reported separately at 0.93%, while forest loss is 0.68%, agricultural loss is 0.66%, and other class differences total 4.90%. Some mapped differences can also reflect classification variation rather than one identifiable land-use event.
Can these maps be used for property or zoning decisions?
No. These are generalized county land-cover maps. They do not provide parcel ownership, tax boundaries, zoning districts, building rights, regulatory wetland boundaries, or survey-grade road locations. Use current county, municipal, and state records for any legal, permitting, taxation, or property-specific question.
Map File Information
The Schoharie County download bundles the current land-cover view, forest/farmland emphasis, impervious surface, and 1985–2025 class-difference map in one ZIP.
- Included Files: general land cover, forest/farmland, impervious/developed land, and land-cover change maps
- File Type: ZIP containing four original JPG maps
- Intended Use: printing, classroom work, presentations, county comparison, and map reference
Related Maps
- Albany County Land Cover Map
- Allegany County New York Land Cover Map
- Bronx County New York Land Cover Map
Sources and Reference Material
- MRLC Annual NLCD Data – official access to Annual NLCD land-cover and impervious-surface datasets
- USGS Annual NLCD Land Cover Classification – official land-cover class descriptions and product caveats
- Schoharie County Multi-Jurisdiction Hazard Mitigation Plan – county planning context for communities, transportation corridors, and natural-resource protection
- Schoharie County Soil & Water Conservation District – county-specific agricultural, stream, and natural-resource conservation context
- Schoharie County SWCD Stream Program – local stream, drainage, and Schoharie Creek program information
- NYC DEP Schoharie Reservoir – official reservoir and Schoharie Creek watershed context
Green Map creates custom-edited map images using open geographic data sources such as geoBoundaries, Natural Earth, OpenStreetMap, and government open data.
These maps are edited visual materials, not raw data files, and are provided for education, documents, presentations, and graphic reference.