Queens County is overwhelmingly urban in the 2025 land-cover summary, but the county is not a single uninterrupted block of pavement. In the 2025 summary, developed cover accounts for 82.49% of the mapped area, while water reaches 12.01%. Wetlands, forest, barren ground, grass, and other small classes fill the remaining gaps. The four maps on this page separate those pieces so the dense built surface, Jamaica Bay shoreline, green fragments, and long-term class differences can be compared without treating them as the same phenomenon.
The page includes a current land-cover map, a forest-and-farmland view, an impervious-surface map, and a 1985–2025 class-comparison map. The four original JPG maps are also available together in one ZIP for printing, classroom work, presentations, and local reference. Land cover describes what is visible on the ground from remotely sensed data; it does not establish zoning, ownership, parcel boundaries, building rights, or the legal status of a wetland.
Table of Contents
A county where developed cover dominates but water still matters
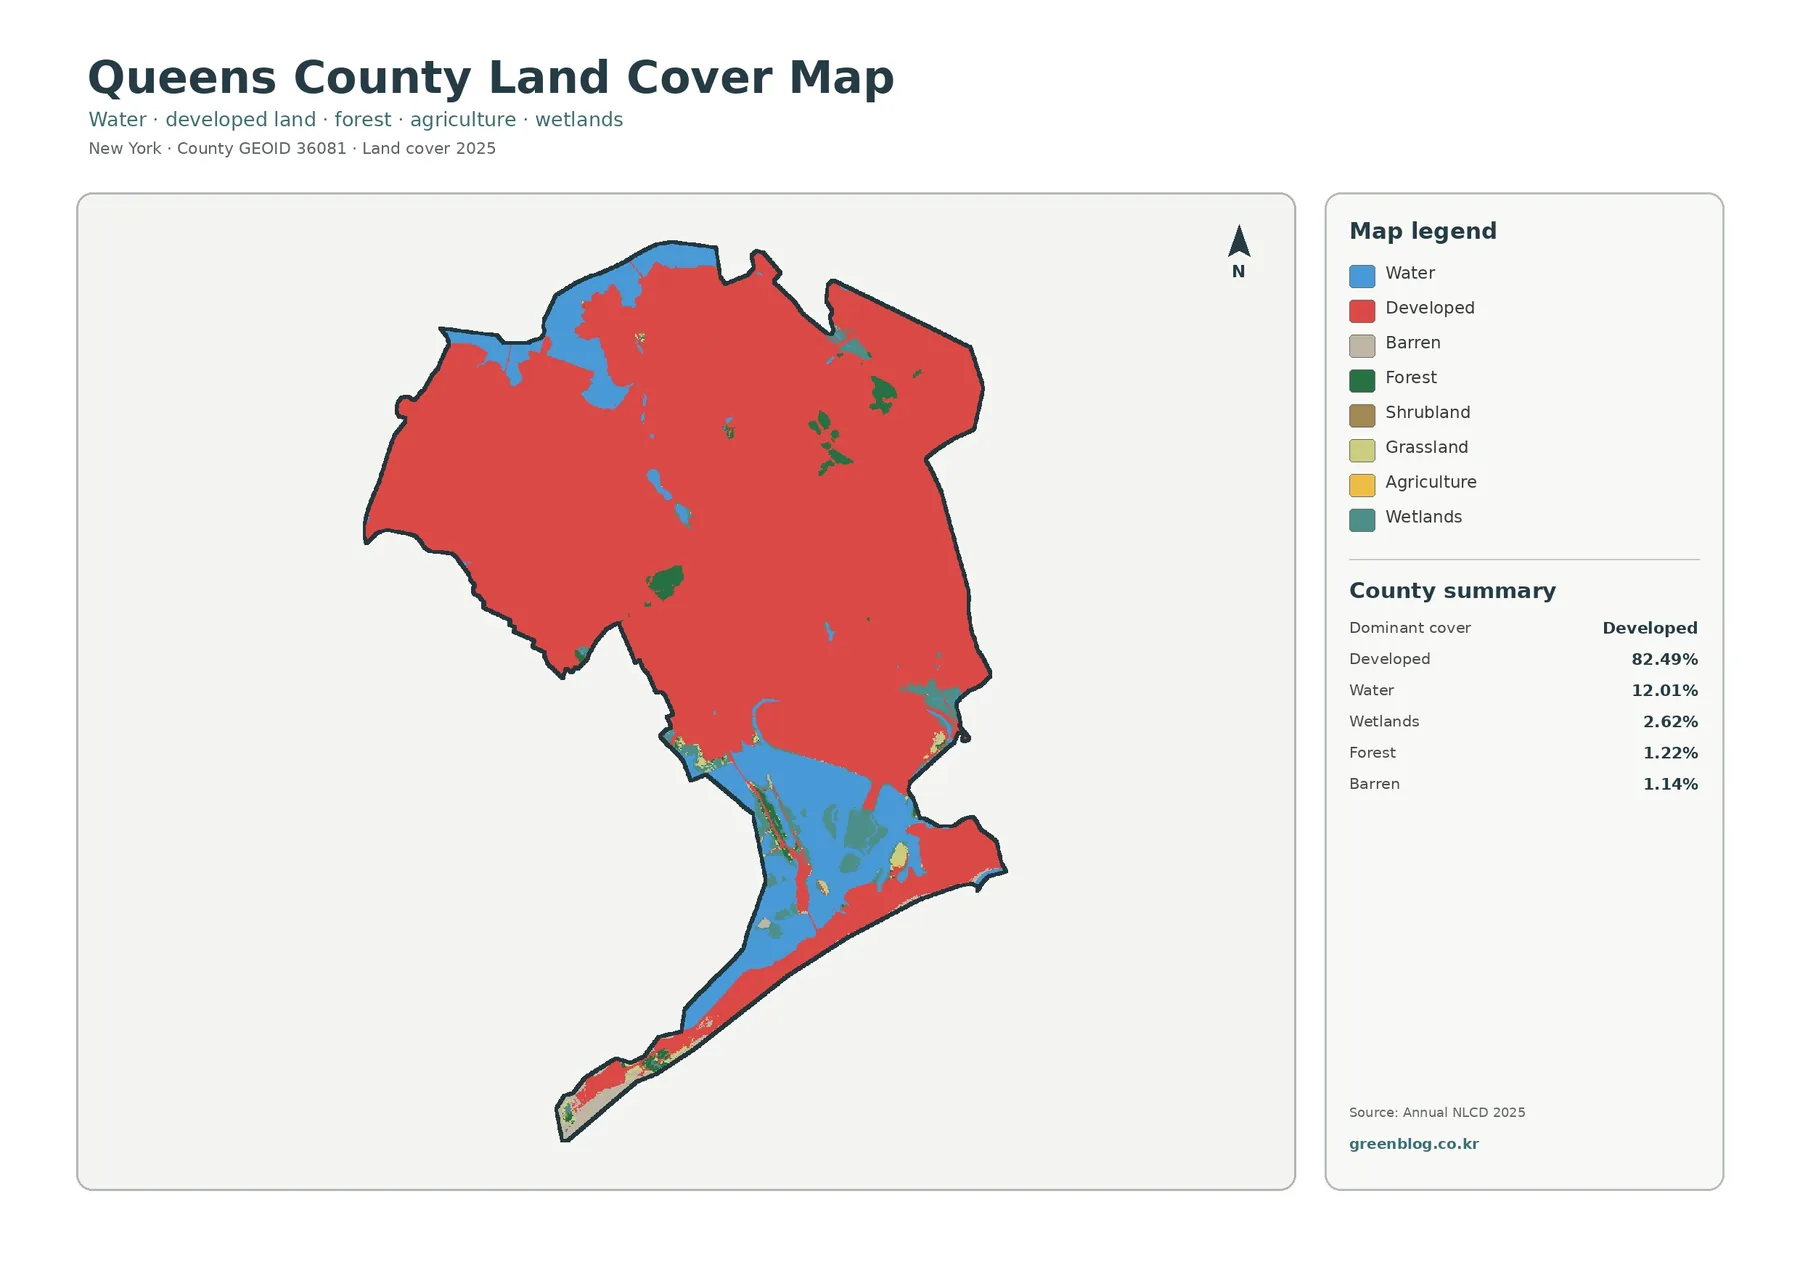
Red developed classes cover nearly all of the large northern and western landmass and continue across much of central and eastern Queens. That broad coverage makes the county look very different from upstate counties where forest or agriculture fills most of the frame. Yet the southern half of the boundary contains a large area of blue water, plus smaller wetland patches and narrow developed land around the coast. Reading the county as “urban” is accurate at a broad level, but the map also makes clear that the shoreline changes the composition substantially.
The 2025 county summary places developed cover first at 82.49%, followed by water at 12.01%, wetlands at 2.62%, forest at 1.22%, and barren land at 1.14%. Agriculture is only 0.01% in the forest-and-farmland summary. Those numbers leave little room for the broad farm belts or continuous forest blocks seen in many other New York counties. Queens instead combines a highly built mainland with major tidal water, coastal edges, parks, and small natural patches scattered through the urban fabric.
The broad water area in the south and southeast corresponds to the Jamaica Bay setting. The National Park Service describes Jamaica Bay as an urban estuary made up of open water, mud flats, salt marshes, beaches, and adjacent upland habitats. That context helps explain why blue water and teal wetland classes occupy a noticeable share of a county otherwise dominated by development. The land-cover map does not draw ecosystem-management boundaries, but it does show why coastal and tidal surfaces are essential to understanding Queens as a whole.
Small green patches become easier to see when the city is muted
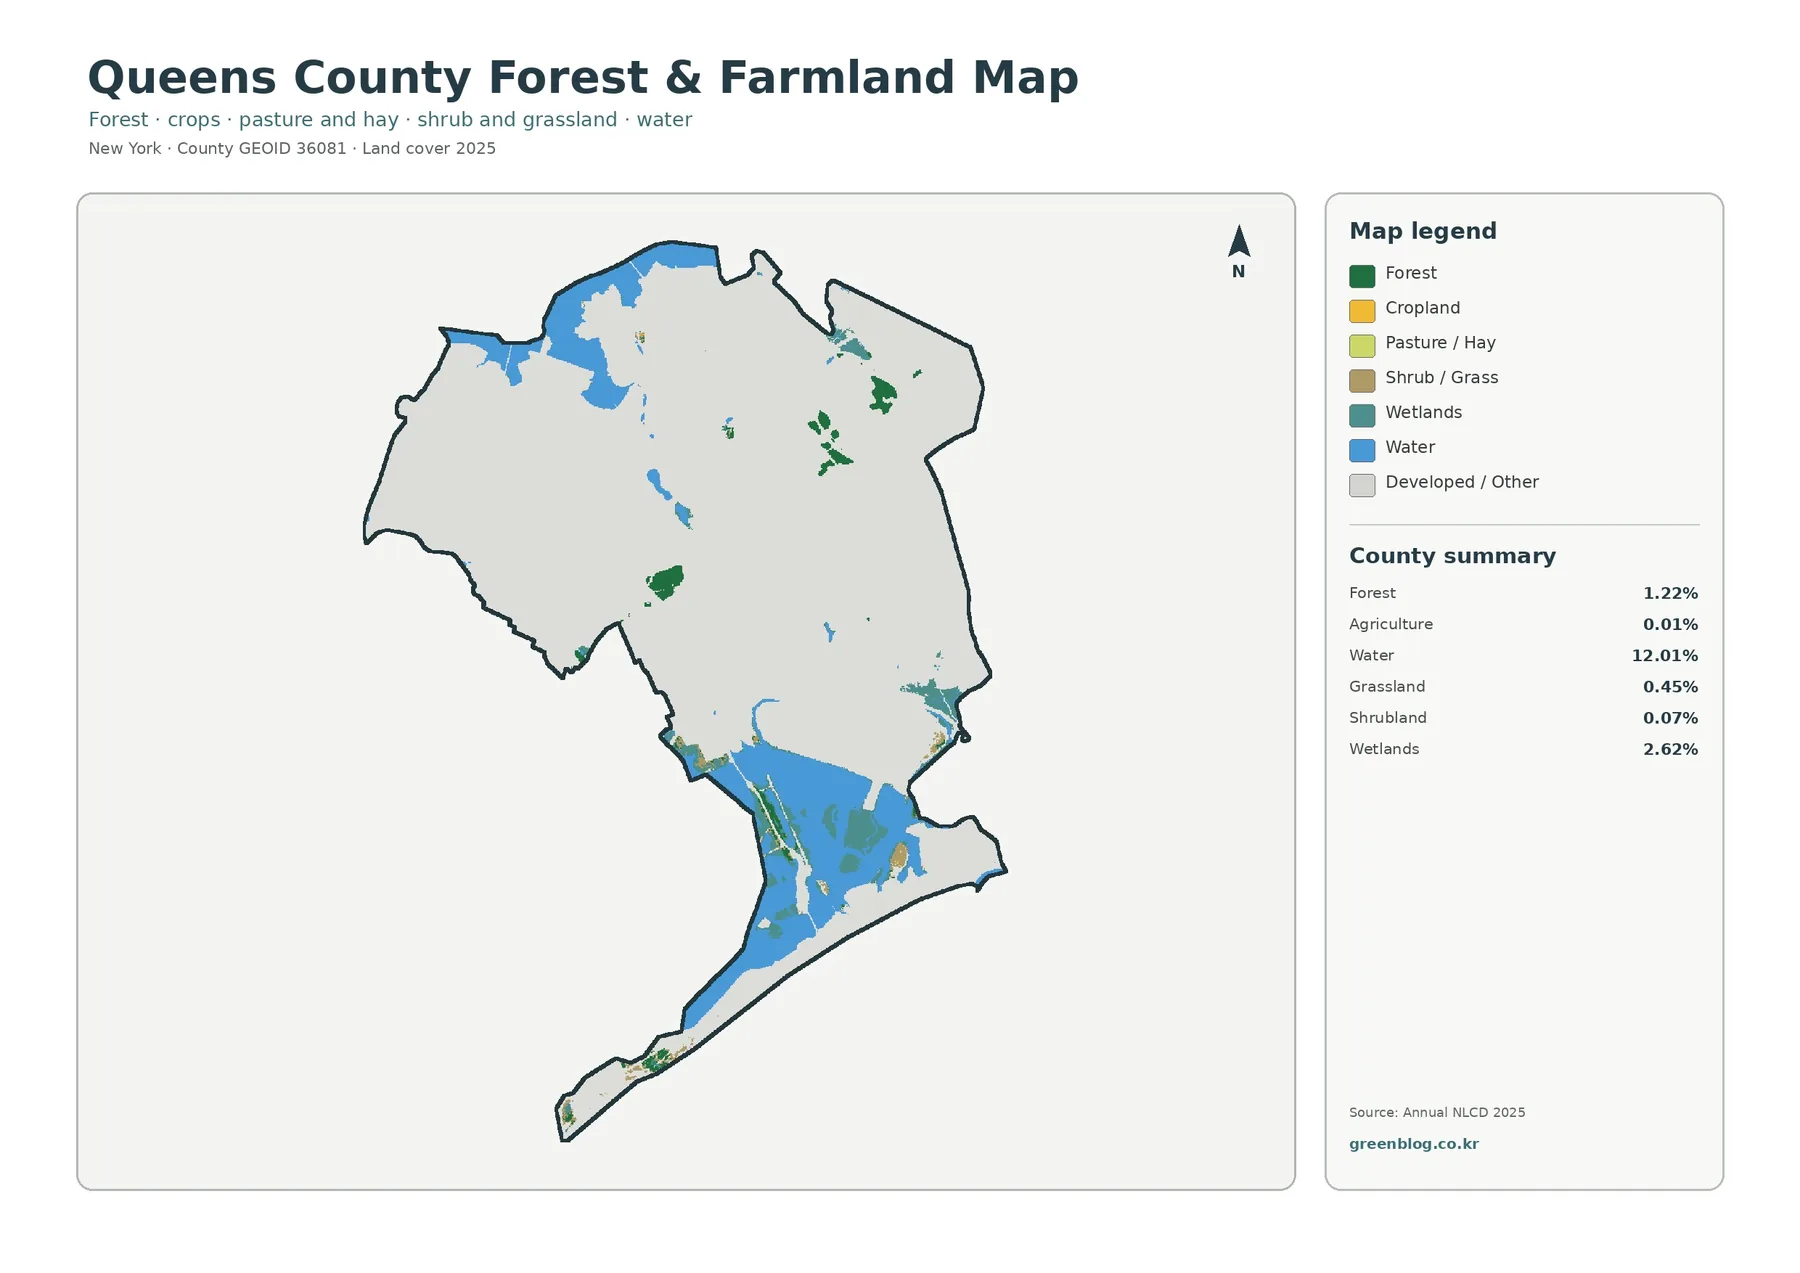
The forest-and-farmland map intentionally pushes most developed and other surfaces into a light neutral background. With the city visually quieted, the scattered green and blue pieces become much easier to locate. Forest is only 1.22% of the county, so there is no large continuous woodland crossing Queens. Instead, forest appears in separated patches, some larger and some very small, surrounded by the built environment. This view is especially useful when a presentation needs to focus on remaining vegetation rather than on streets and neighborhoods.
Agriculture is mapped at just 0.01%. That figure should not be read as a measure of whether community gardens, urban farms, or local food projects exist. Because the classification works at raster scale, tiny cultivated plots can be mixed with surrounding rooftops, lawns, sidewalks, or other urban surfaces inside the same cell. The number simply says that almost none of the county was classified into the map’s agricultural land-cover category in the 2025 summary.
Flushing Meadows Corona Park is a helpful example of why a large urban park may appear as several classes instead of one solid green polygon. NYC Parks describes the park as nearly 900 acres with lawns, mature trees, paths, recreational areas, lakes, cultural facilities, and transportation-related features. A land-cover classification therefore divides a place like this according to surface type rather than labeling every acre simply as “park.” That distinction matters whenever readers compare land cover with land use.
Jamaica Bay puts wetlands next to one of the nation’s densest urban landscapes
The National Park Service describes the bay as a mosaic of open water, intertidal flats, salt marsh, beaches, and nearby upland habitat. These environments change across short distances and respond to tides, which means a 30-meter raster necessarily simplifies their boundaries. A teal wetland cell is not a legal wetland delineation, and a blue water edge is not a surveyed shoreline. This countywide view is best for seeing the broad coastal pattern, not for making regulatory or construction decisions at a particular property.
The change map is mostly a story of classification stability, not a simple growth chart
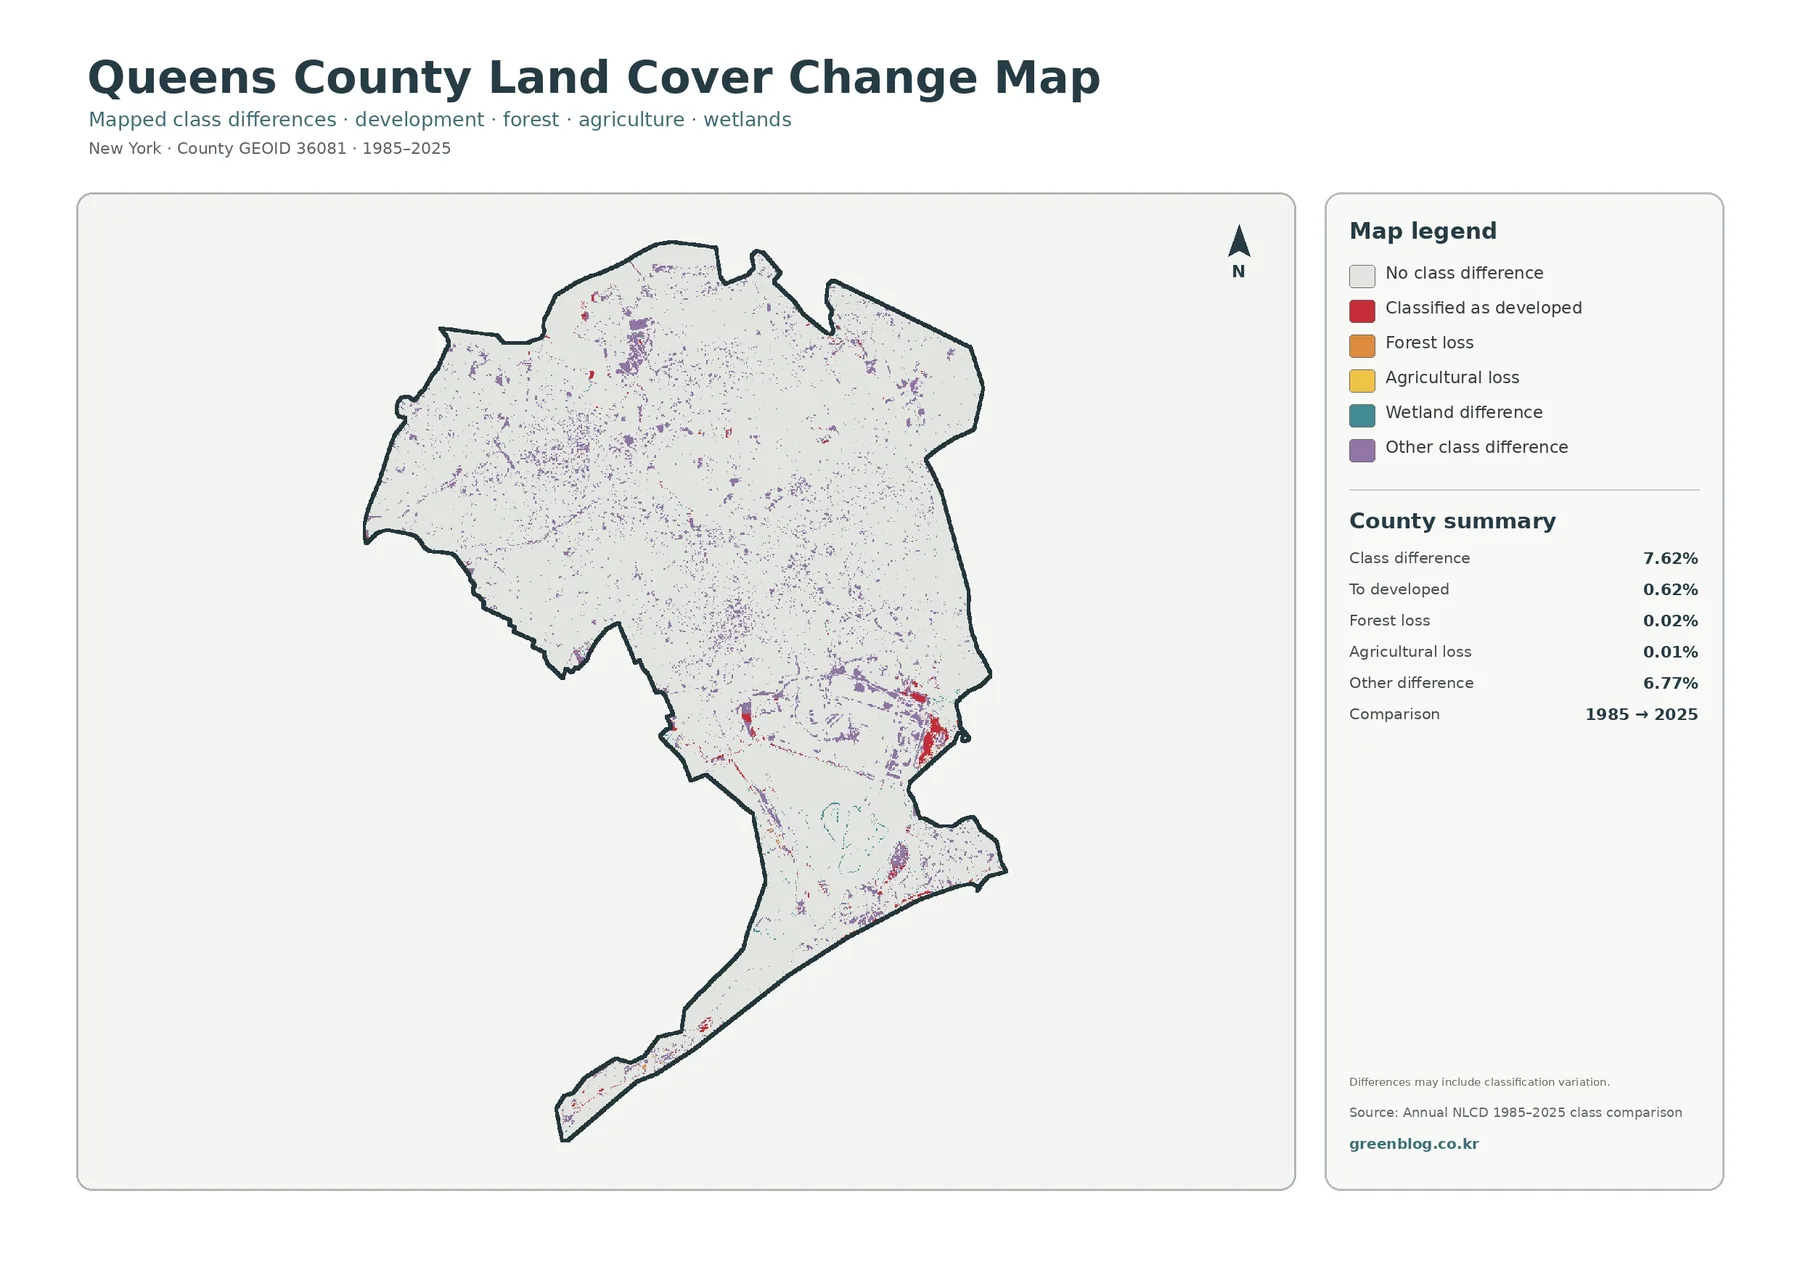
The 1985–2025 comparison highlights cells whose land-cover class differs between the two endpoints. The total class difference is 7.62%. Only 0.62% is labeled as a change to developed, while forest loss is 0.02% and agricultural loss is 0.01%. The largest category is “other difference” at 6.77%. That distribution is a strong warning against describing the map as if 7.62% of Queens were newly developed over forty years.
Current condition and historical difference answer separate questions. The 82.49% developed-cover figure describes the 2025 snapshot. The 0.62% “to developed” figure describes cells that moved into a developed classification between the 1985 and 2025 endpoints. A place can be developed today and still show no change if it was also classified as developed in 1985. Keeping those ideas separate prevents a common error when a highly urban county is paired with a relatively modest change percentage.
Classification variation can also contribute to the difference map. A 30-meter cell may contain roof, pavement, tree canopy, lawn, bare ground, or water at the same time. Small changes in the dominant signal, data processing, or the position of a shoreline can alter the assigned class even when no major construction project occurred. Anyone investigating a specific redevelopment, wetland conversion, or park change should compare dated aerial imagery and local records instead of relying on this countywide raster alone.
Impervious cover reveals how intensely the developed area is built
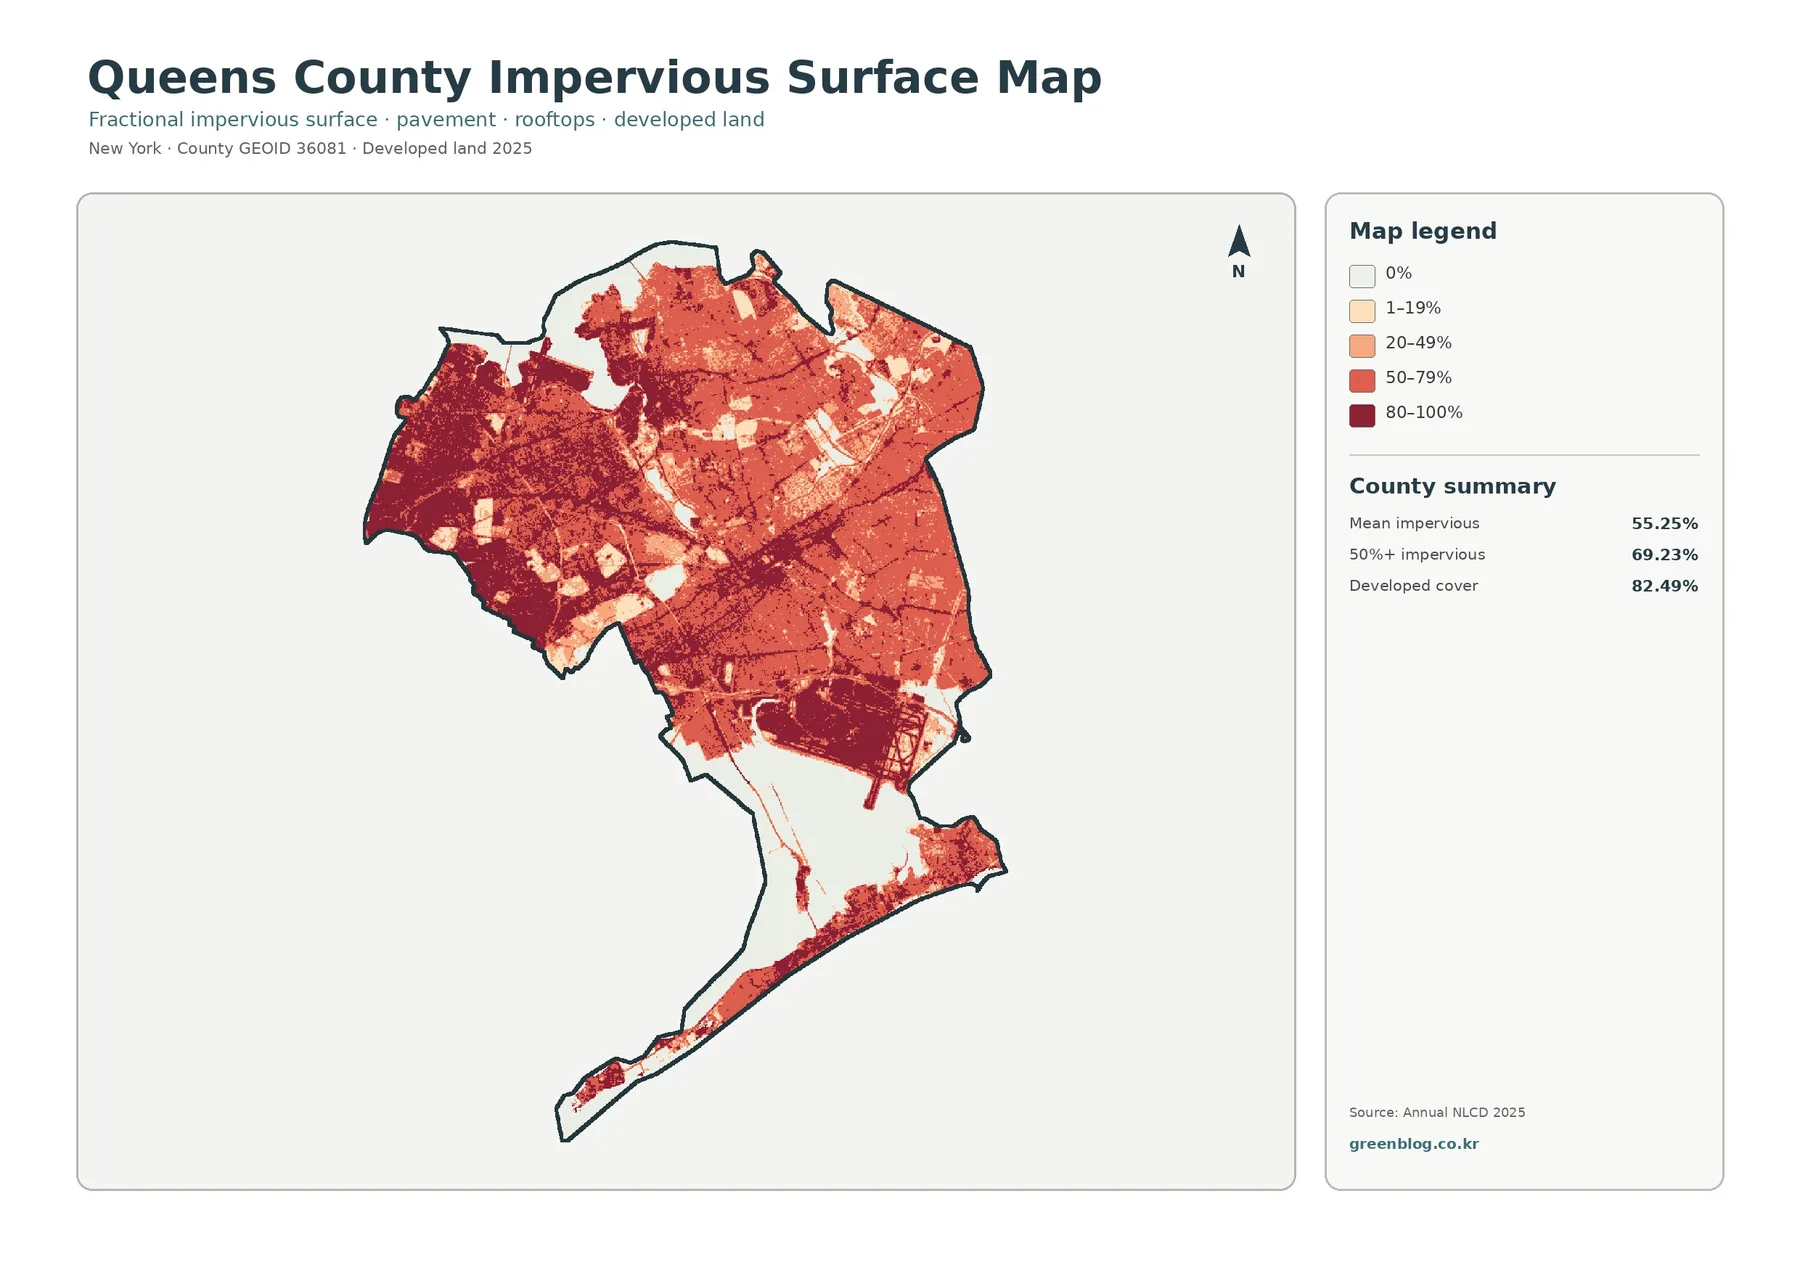
Impervious surface means roofs, pavement, parking areas, and other hard surfaces that do not readily absorb rainfall. Queens has a mean impervious value of 55.25%, and 69.23% of the mapped area falls at or above 50% impervious. Those figures are high enough that the impervious map looks very different from the forest-focused view. Dark red and orange values spread across broad parts of the mainland, with lighter gaps where water, parks, yards, or other more permeable surfaces interrupt the urban cover.
Although related, developed cover and impervious cover are not interchangeable. A developed land-cover class can include lawns, trees, landscaped areas, and other surfaces that still absorb some water. Impervious mapping isolates the hard portion more directly. That is why the 82.49% developed-cover share is higher than the 55.25% countywide mean impervious value. Looking at both maps avoids the false impression that every developed pixel is solid pavement.
The pattern is also useful for comparing urban intensity within Queens. Some blocks form broad areas of very high impervious cover, while major open spaces and water create visible breaks. The southeastern section includes another large concentration of hard surface near extensive water. Nothing in this image identifies the cause of each cluster, so it is better to describe those surfaces as concentrated together than to claim that a particular road, airport, or facility created them without a separate source.
Choosing the right Queens map for a class, report, or presentation
Download the four original JPG maps in one ZIP
The download package contains the current land-cover map, forest-and-farmland map, impervious-surface/developed-land map, and 1985–2025 land-cover comparison as four original JPG files. The images retain their legends and county summaries, making them easier to use independently in a handout or slide. For side-by-side comparison, keep the maps at similar sizes and avoid cropping away the legend, north arrow, or summary box that explains the colors and percentages.
How to read a 30-meter raster without treating it like a parcel survey
Annual NLCD products use raster cells, which divide the landscape into a regular grid and assign each cell a representative value. At county scale, this is very effective for comparing broad patterns. At property scale, it is intentionally generalized. A single cell in Queens can contain a house, street trees, sidewalk, driveway, lawn, and part of another building. The classification cannot preserve every one of those boundaries as separate map features.
Land cover is also different from land use. A red developed cell does not say whether the underlying property is residential, commercial, industrial, transportation, or institutional. A green forest cell does not indicate public ownership, and a teal wetland cell does not establish a regulated wetland boundary. Parcel, zoning, permitting, and legal wetland questions require the current records of the responsible agency.
Frequently Asked Questions
What is the dominant land cover in Queens County?
At 82.49%, developed cover is the dominant 2025 class. Water is second at 12.01%, followed by wetlands at 2.62%, forest at 1.22%, and barren land at 1.14%. The large water share is visually concentrated around the southern and southeastern part of the county, especially the Jamaica Bay setting, while most of the main landmass is developed.
Why is mean impervious cover 55.25% when developed cover is 82.49%?
Developed land can include permeable surfaces such as lawns, landscaped soil, and trees around buildings. Impervious cover focuses on hard surfaces such as roofs, pavement, and parking areas. Queens therefore has a larger developed-land share than its mean impervious value. Its county summary also reports that 69.23% of the area is at least 50% impervious, which shows how widespread high-intensity hard surface is even though not every developed area is fully paved.
Does the 7.62% class difference mean Queens grew by 7.62% from 1985 to 2025?
No. The figure represents cells whose mapped land-cover class differs between the two endpoints. Only 0.62% is specifically labeled “to developed,” while 6.77% falls into other class differences. Classification variation, mixed pixels, shoreline effects, and real land-cover changes can all contribute. A precise development history requires dated imagery and local planning or property records.
Map File Information
Queens County Land Cover Maps Download the original JPG set for 2025 land cover, forest and farmland, impervious/developed land, and the 1985–2025 class comparison in one ZIP.
- Included Files: Use only the versions confirmed in the article and supplied images
- File Type: Use the confirmed download contents
- Intended Use: Printing, education, presentations, and map-based projects
Related Maps
- Albany County Land Cover Map
- Allegany County New York Land Cover Map
- Bronx County New York Land Cover Map
Sources and reference material
- MRLC Annual NLCD Data – access to Annual NLCD land-cover products and related data
- USGS Annual NLCD Land Cover Classification – definitions and documentation for land-cover classes
- U.S. Census Bureau TIGER/Line Shapefiles – county boundary and geographic reference data
- National Park Service – Introducing Jamaica Bay – official background on Jamaica Bay water, salt marsh, beaches, and urban estuary habitat
- NYC Parks – Flushing Meadows Corona Park Land Use – official context for the mix of lawns, trees, lakes, recreation, and facilities in a major Queens park
Green Map creates custom-edited map images using open geographic data sources such as geoBoundaries, Natural Earth, OpenStreetMap, and government open data.
These maps are edited visual materials, not raw data files, and are provided for education, documents, presentations, and graphic reference.