Putnam County is overwhelmingly wooded in the 2025 land-cover map, but the county is not a continuous block of forest. Forest accounts for 65.05% of the mapped area, while developed land reaches 20.80%. Reservoirs and other water bodies interrupt the wooded landscape, especially through the central and eastern parts of the county, and developed cover becomes much more noticeable toward the east and along several southern settlement areas. Agriculture is only 1.91%, so it plays a much smaller visual role here than in many upstate New York counties.
This page separates that landscape into four useful views: current land cover, forest and farmland, impervious surface and developed land, and mapped class differences from 1985 to 2025. The four original JPG maps are available together in one download for printing, teaching, presentations, and county-scale reference. They describe the physical cover of the ground rather than property ownership, zoning, building rights, park boundaries, or the legal limits of regulated wetlands.
Table of Contents
A forested county broken up by reservoirs and settlement areas
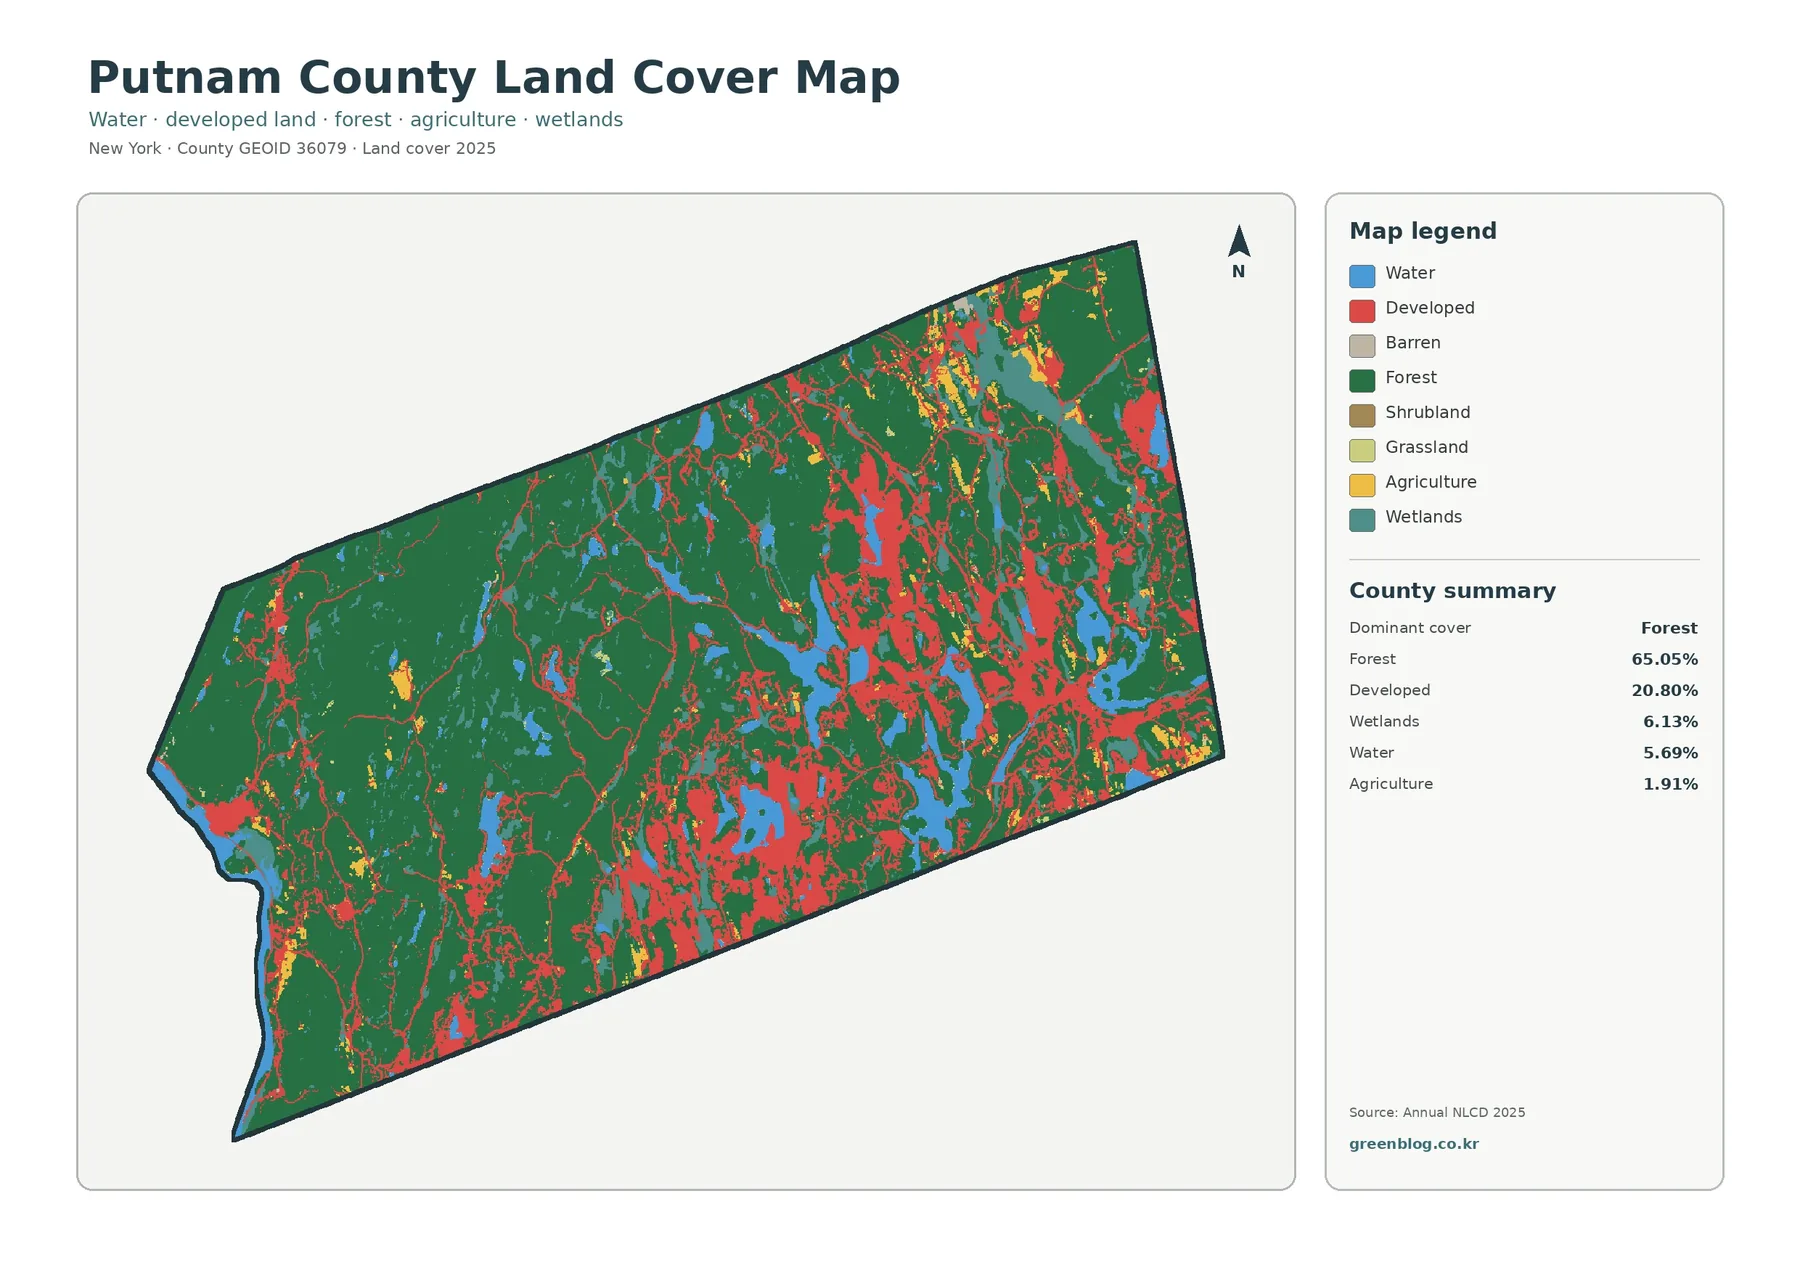
Dark green dominates the countywide map, particularly across the western half and much of the center. Red developed cover is far more concentrated on the eastern side and in several southern areas, with narrower lines and small clusters extending through the forested interior. Blue water bodies form another strong set of landmarks. Instead of one large lake, the map contains several elongated and irregular reservoirs that divide the surrounding forest and developed areas into distinct local patterns.
Putnam County’s official county profile provides a geographic frame for the map. The county lies between the Hudson River on the west and the Connecticut border on the east, and most of its land is within the Hudson Highlands. The same profile identifies the East Branch, West Branch, and Croton Falls reservoirs among the county’s major water features. Those facts help explain why forest and water are such useful orientation points when reading the land-cover map, while the map itself should not be used as a topographic or watershed-jurisdiction map.
Where paved and roofed surfaces become most concentrated
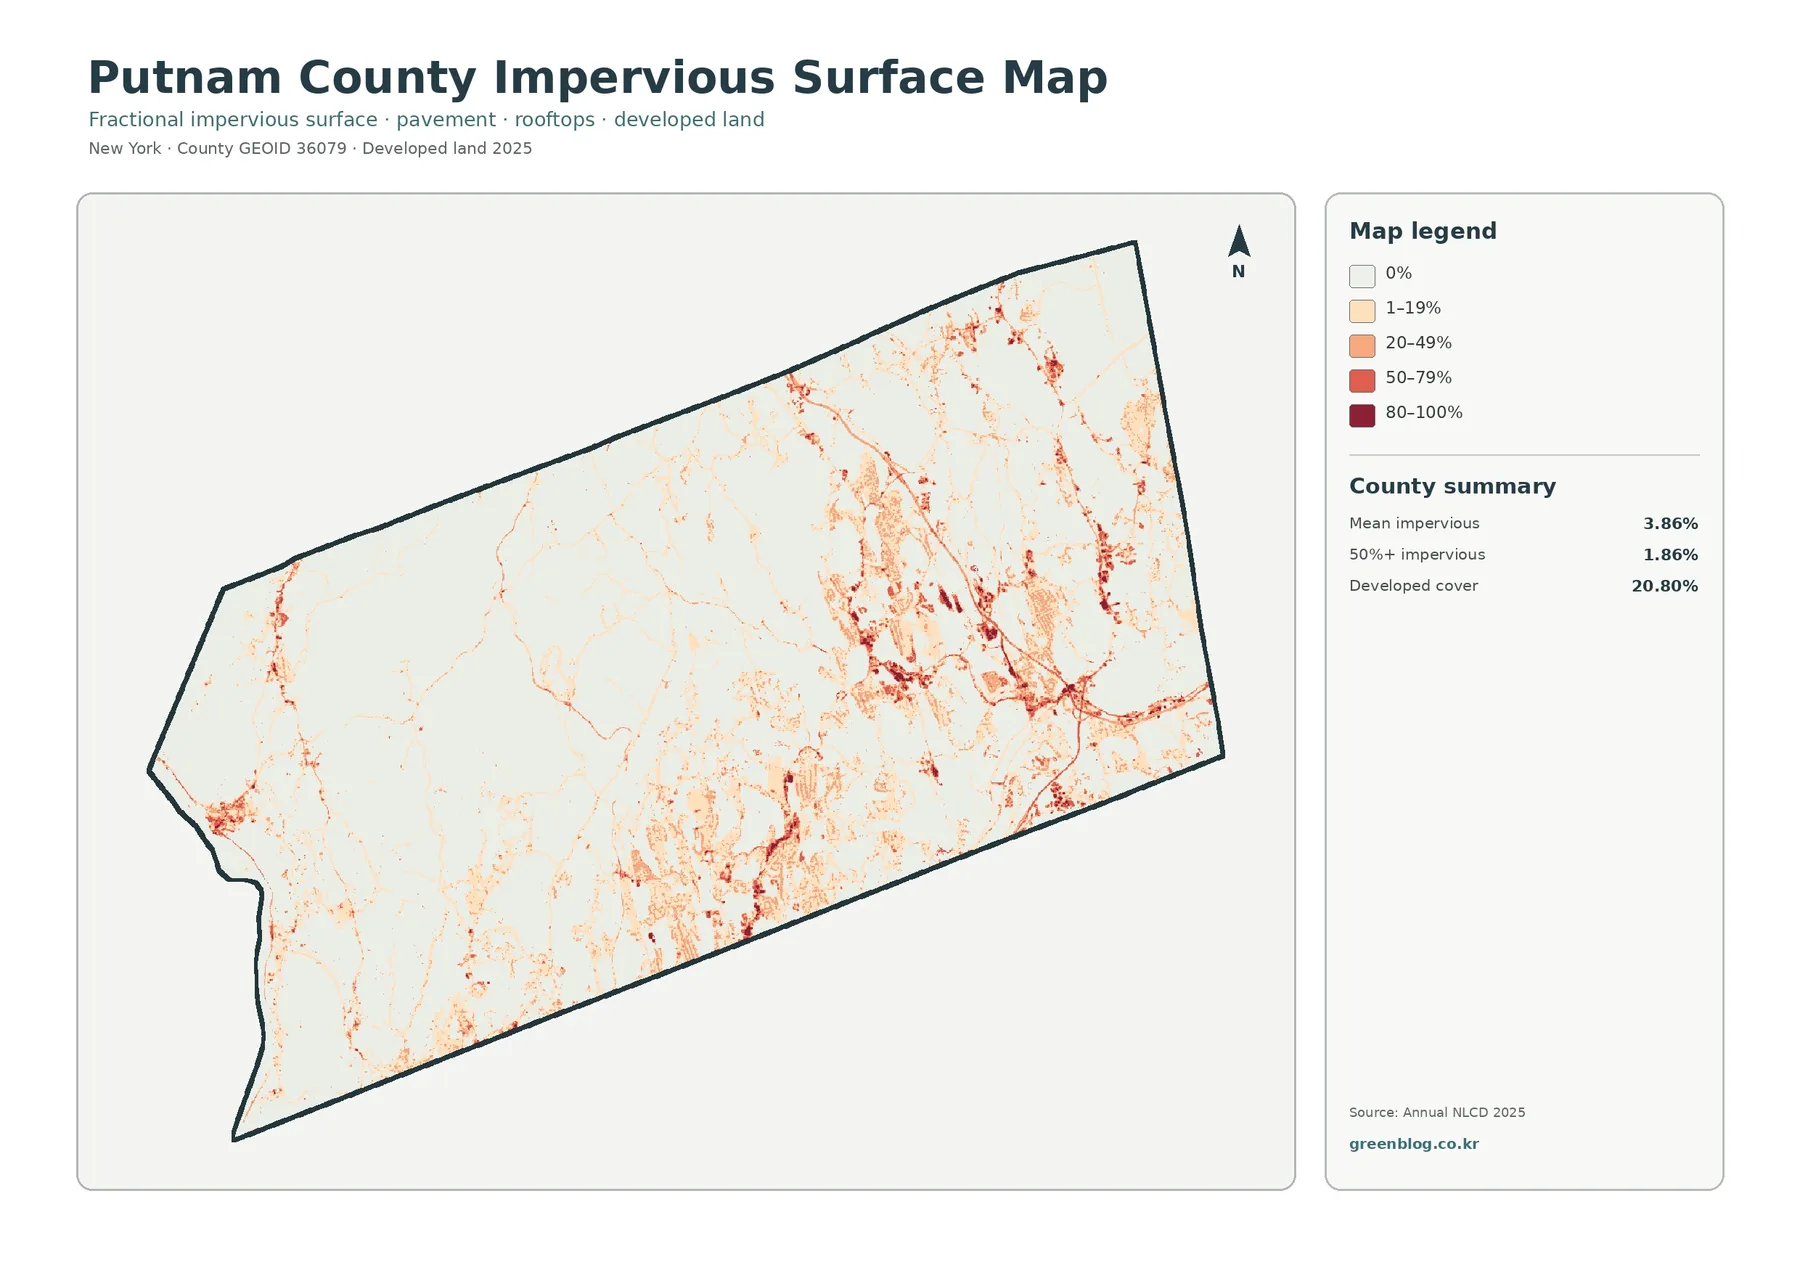
Impervious surface means pavement, rooftops, parking areas, and similar hard surfaces that do not absorb water in the same way as soil or vegetation. Putnam County has a mean impervious value of 3.86%, while 1.86% of the mapped area falls in the 50% or greater impervious category. Those numbers are much lower than the 20.80% developed-cover share because developed land can still include lawns, trees, gardens, and other permeable surfaces around buildings and streets.
The darkest impervious colors cluster most clearly in the eastern and southeastern parts of the county, with another set of stronger concentrations along the south-central area. Thin lines and smaller spots extend outward from those clusters. By contrast, large western forest areas remain mostly pale. The map therefore reveals a strong local contrast that a single county average would hide: the county can be mostly forested overall while still containing compact areas with much denser hard surfaces.
Forest and farmland: an unusually small agricultural share
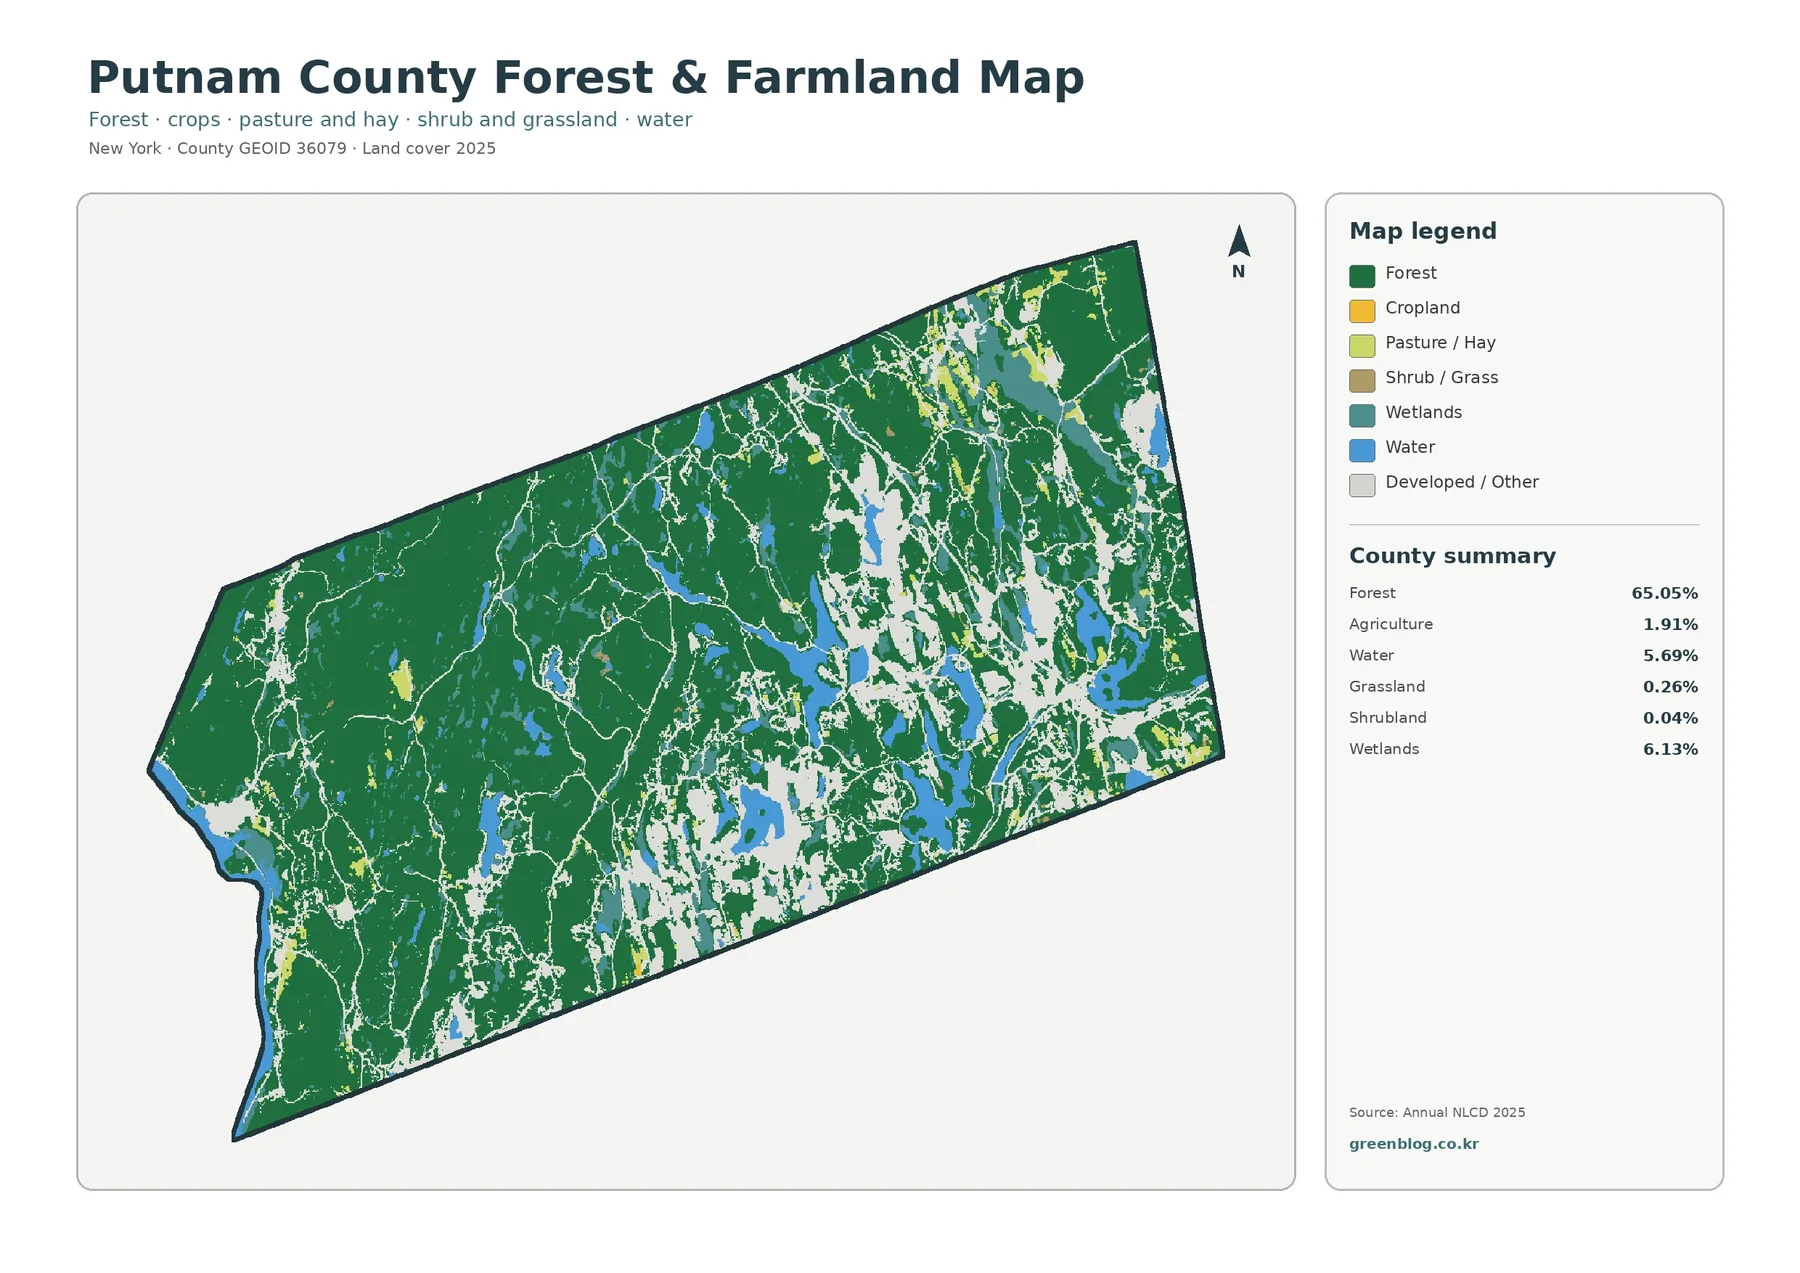
Agriculture covers only 1.91% of the county in the 2025 summary, so the forest-and-farmland map looks very different from equivalent maps in major farming counties. Green forest is broad and continuous across the west and much of the interior. Cropland and pasture or hay appear as small, scattered openings rather than a countywide field pattern. The limited agricultural colors are one reason this simplified map works well for showing just how dominant woodland is in Putnam County.
An agricultural land-cover cell should not be confused with an Agricultural District, farm parcel, or zoning designation. Land cover is derived from the appearance and classification of the ground surface. Administrative agricultural programs are created through different legal and planning processes. A parcel-level question about farm status therefore needs county or state agricultural records, even if the land-cover map shows a field in the same location.
What the 1985–2025 class-difference map is actually measuring
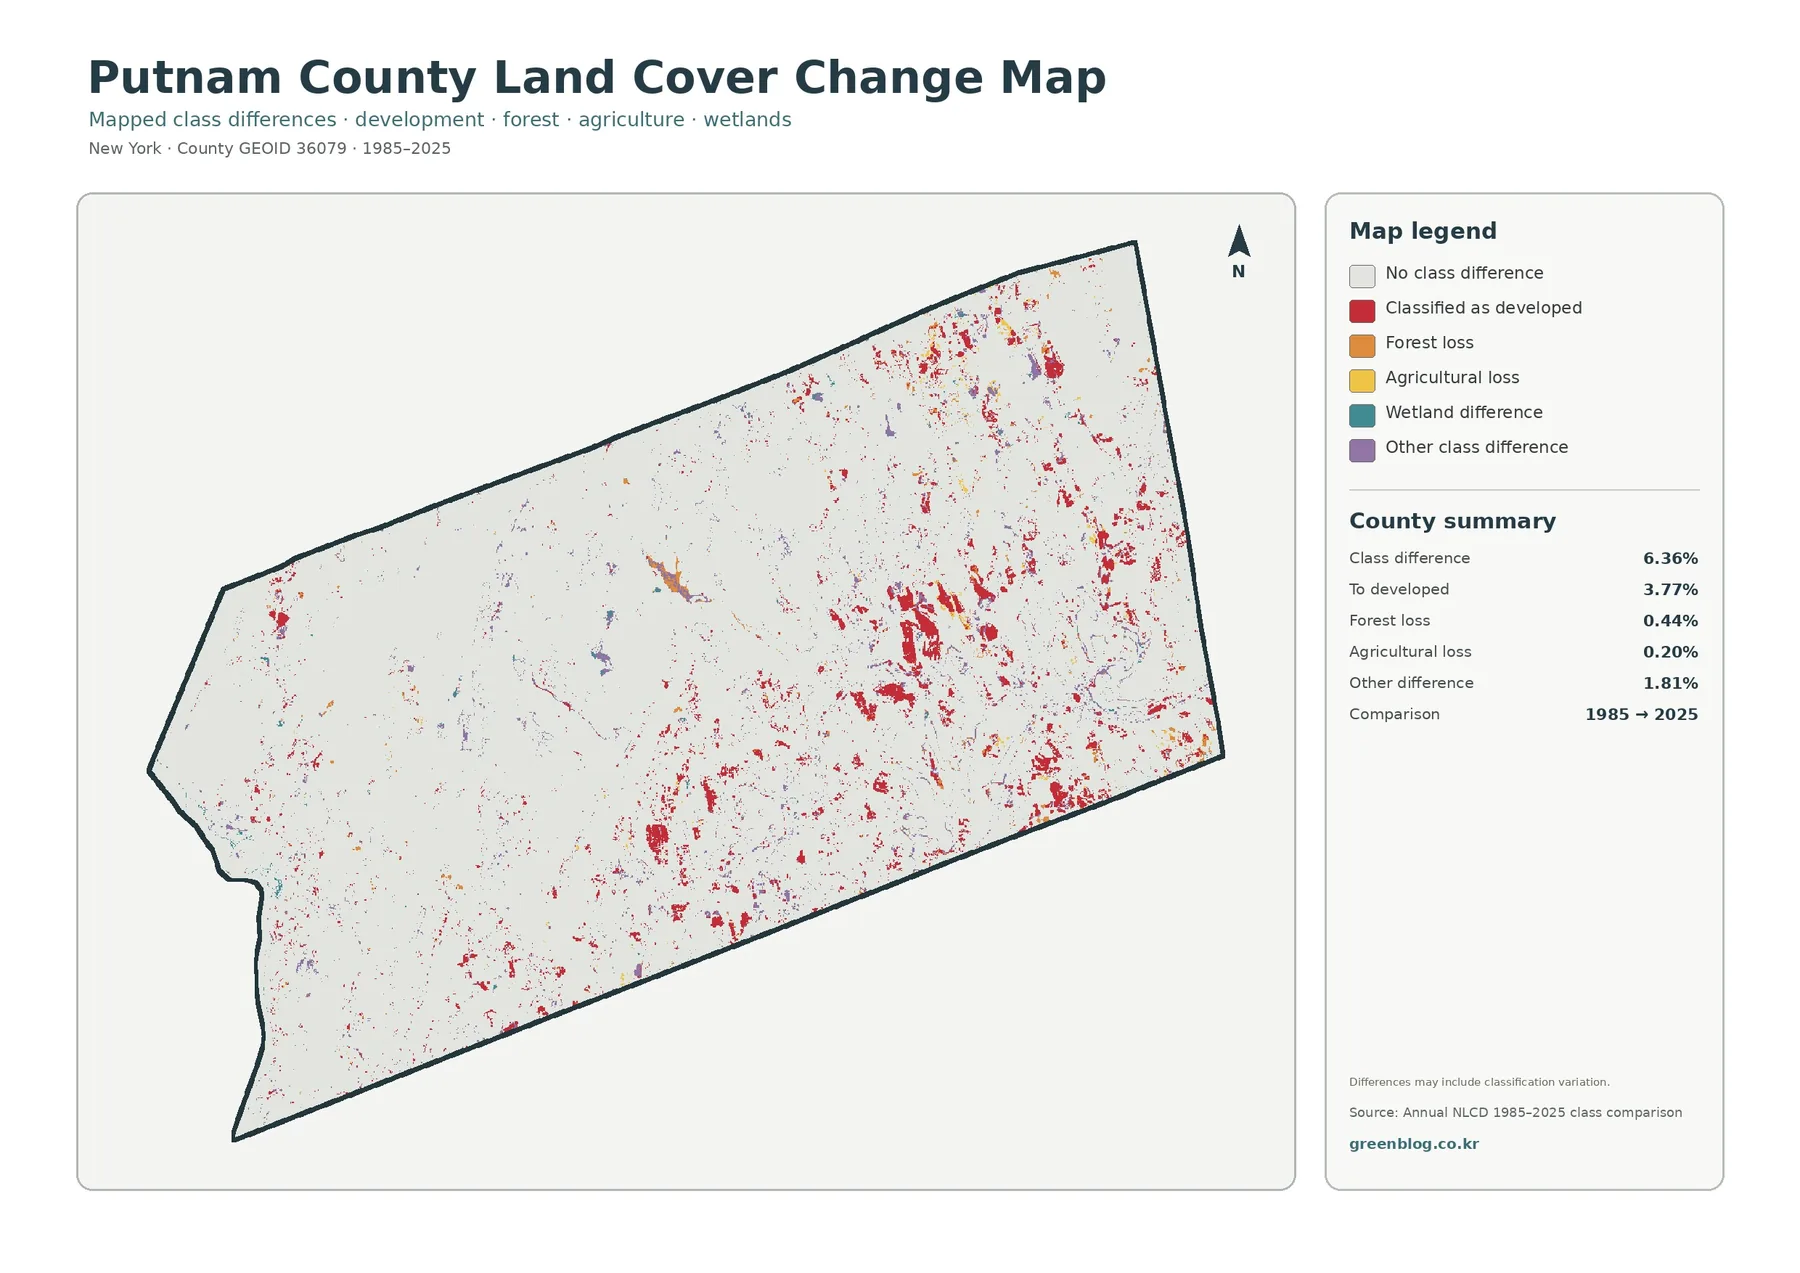
The long-term comparison highlights cells whose mapped class differs between 1985 and 2025. Putnam County’s summary reports 6.36% class difference overall. Of that, 3.77% is shown as changed to developed, 0.44% as forest loss, 0.20% as agricultural loss, and 1.81% as other class difference. Most of the county remains in the no-class-difference background, so the colored areas are selective rather than a blanket change layer.
The 6.36% figure is not the same as a measured land-use conversion rate. The map itself warns that differences can include classification variation. A 30-meter raster cell may contain tree canopy, a yard, pavement, and a building at the same time. If the dominant signal or classification changes between dates, the cell can appear as a difference even when the real-world history is more complicated than one simple conversion.
Reading Putnam County with its Hudson Highlands and reservoir setting in mind
The county’s official profile describes a landscape shaped by the Hudson Highlands and a dense network of lakes, reservoirs, streams, and rivers. That local description fits the map better than a generic rural-versus-urban label. Putnam County contains extensive forest, but it also has developed corridors and numerous water bodies. The four map views help separate those components so a reader can see which part of the landscape is being discussed at any moment.
Choosing the right JPG for print, classwork, or local reference
For a quick overview, start with the general 2025 land-cover map. It places the 65.05% forest share, 20.80% developed cover, reservoirs, wetlands, and the small agricultural component in one frame. If the topic is open space or the balance between woodland and fields, switch to the forest-and-farmland view. Its simplified palette makes the scarcity of large agricultural areas much easier to see.
The download contains all four original JPG maps: general land cover, forest and farmland, impervious surface and developed land, and 1985–2025 land-cover class differences. They can be used individually or as a coordinated set. A sequence from current cover to forest/farmland, then impervious surface, then class difference works well when the goal is to move from a broad county picture toward more specific questions.
Scale, mixed pixels, and other limits that matter
Annual NLCD products are raster datasets. A raster divides the landscape into grid cells and assigns a value to each cell; the familiar NLCD products use a 30-meter spatial resolution. That scale is well suited to countywide patterns, but it is not a survey of individual lot lines. Narrow roads, small ponds, tiny clearings, and irregular forest edges can be simplified or absorbed into the class that best represents a cell.
Legal interpretation is outside the purpose of these maps. A wetland-classified cell is not automatically the boundary of a regulated wetland. Forest is not a conservation-easement map. Agricultural cover is not an Agricultural District. Developed cover is not zoning. Property, permitting, tax, and regulatory questions should be answered with the current records of the responsible agency.
Frequently Asked Questions
Why is developed cover 20.80% when mean impervious surface is only 3.86%?
Developed land is a broad land-cover class and can include vegetation around homes, businesses, and roads. Impervious surface measures the hard fraction such as pavement and rooftops. A low-density residential cell can therefore be developed without being mostly impervious. In this map set, only 1.86% of the county falls in the 50% or greater impervious category.
Does the 6.36% class difference mean that 6.36% of the county was developed after 1985?
No. The 6.36% value includes every mapped class difference between the two selected years, and the map notes that classification variation can contribute. The portion labeled “to developed” is 3.77%, but even that should not be treated as a permit-based measure of construction. Aerial imagery and local records are needed to confirm what changed at a specific site.
Map File Information
Putnam County land cover maps Download the four original JPG maps: 2025 land cover, forest and farmland, impervious surface and developed land, and the 1985–2025 class-difference map.
- Included Files: Use only the versions confirmed in the article and supplied images
- File Type: Use the confirmed download contents
- Intended Use: Printing, education, presentations, and map-based projects
Related Maps
- Albany County Land Cover Map
- Allegany County New York Land Cover Map
- Bronx County New York Land Cover Map
Sources and references
- MRLC Annual NLCD Data – access to annual land-cover and related products
- USGS Annual NLCD Land Cover Classification – documentation for land-cover classes and interpretation
- U.S. Census Bureau TIGER/Line Shapefiles – county boundary and geographic reference data
- Putnam County Hazard Mitigation Plan – County Profile – official county context for the Hudson Highlands, Hudson River, reservoirs, and major waterways
Green Map creates custom-edited map images using open geographic data sources such as geoBoundaries, Natural Earth, OpenStreetMap, and government open data.
These maps are edited visual materials, not raw data files, and are provided for education, documents, presentations, and graphic reference.