The Lewis County New York Land Cover Map is defined by broad forest cover, extensive wetlands, and a distinct band of agricultural land that runs through the central part of the county toward the southeast. In the 2025 summary, forest accounts for 60.32%, wetlands for 17.77%, and agriculture for 15.11%. Only 3.93% of the county is classified as developed, so the overall pattern is much more rural and forested than urban.
Four map views are included on the page: general land cover, forest and farmland, impervious surface and developed land, and mapped land-cover differences from 1985 to 2025. The WebP images are designed for quick browsing, while the four original JPG maps are available together in a ZIP download for printing, teaching, presentations, and offline map comparison.
Table of Contents
Forest dominates, but the agricultural corridor is easy to spot
The first impression comes from the large dark-green areas that cover the north, east, and much of the southwest. Forest makes up 60.32% of the county, and its distribution is broad rather than confined to a few isolated blocks. Agriculture is much smaller at 15.11%, yet its yellow pattern is visually prominent because it forms a long concentration through the central and southeastern portions and also expands across part of the west-central area.
Wetlands are the second-largest class at 17.77%. Teal patches appear within forested areas, near water, and across several northern and eastern sections. Their distribution is important because it breaks up what might otherwise look like uninterrupted woodland. The general map and the simplified forest-and-farmland map both show that large parts of the county combine forest and wet ground rather than only dry upland forest.
At 3.93%, developed cover remains a minor part of the county; shrubland accounts for 1.12%, grassland 0.57%, and water 1.04%. Development appears in compact concentrations and narrow connecting lines rather than as a continuous urban field. Those smaller classes add detail to the broad contrast between forest and agriculture without changing the county’s strongly rural character.
Reading the 2025 general land-cover map
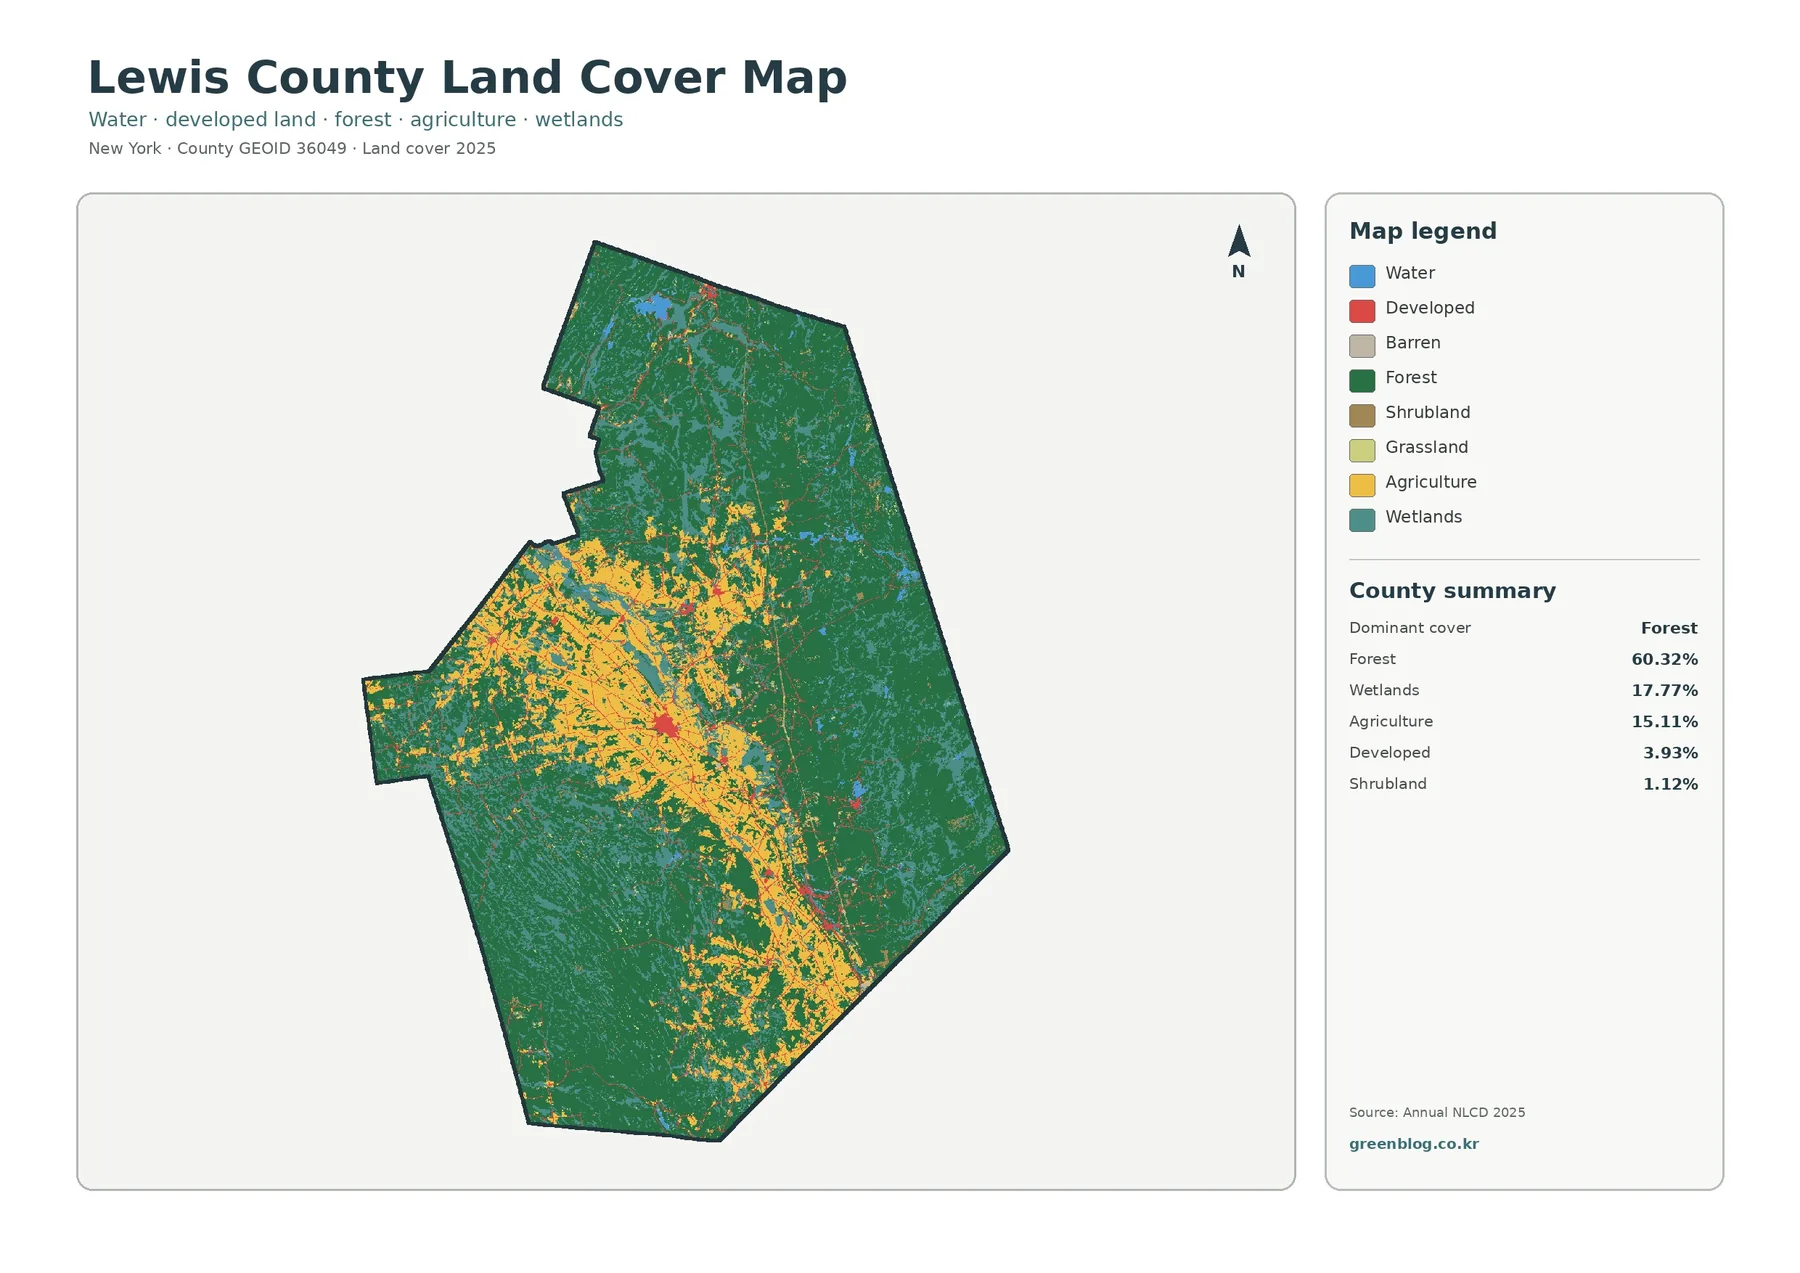
The general map is the best starting point because it keeps all major classes visible at the same time. Forest is especially extensive across the northern half and eastern side. Agricultural colors increase through the middle and continue toward the southeast, with another broad concentration in the west-central portion. Wetlands repeatedly interrupt the forest pattern and often sit close to small water features.
Small developed concentrations occur within the same broad corridor as much of the agricultural cover. That visible pattern supports describing settlements, roads, and farm cover as appearing near one another in the same corridor, but it does not establish cause and effect. A land-cover map can show proximity; it cannot demonstrate that one feature created another without additional evidence.
Land cover is also different from legal land use. The classes describe the physical surface identified from remotely sensed data—forest, agriculture, water, wetland, developed land, and related categories. They do not show parcel ownership, zoning, development rights, or the exact crop being grown in an agricultural cell.
Each class is assigned to raster cells. In plain language, the landscape is divided into a grid and every cell receives one representative label. A cell on a forest edge may contain trees, grass, a road, and a wet patch at the same time, yet the final map must assign one class. Boundaries should therefore be read as generalized patterns rather than survey lines.
The forest-and-farmland view sharpens the rural contrast
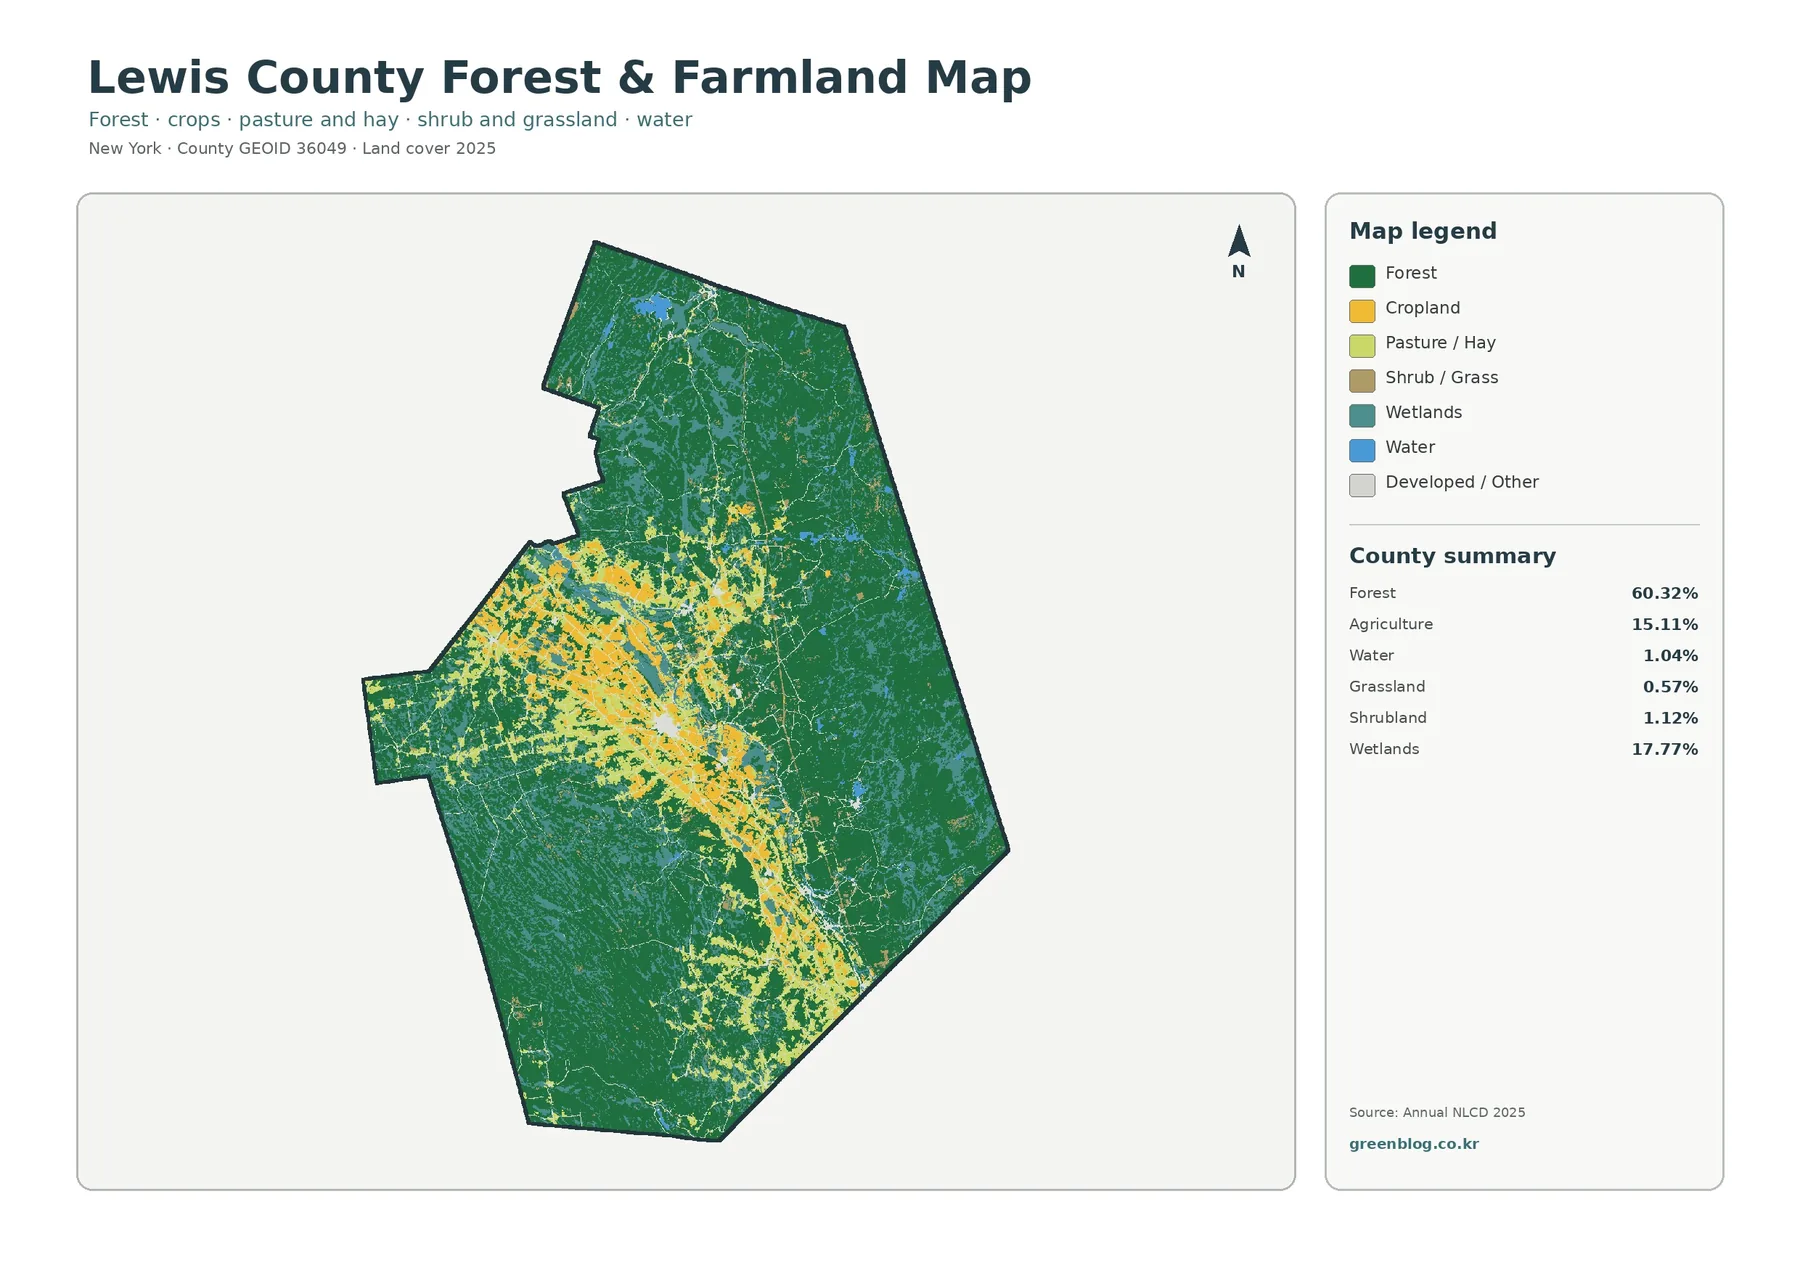
Removing much of the developed detail makes the 60.32% forest share and the 15.11% agricultural share easier to compare. The north and east remain overwhelmingly green, while yellow and light-green agricultural colors stretch through the central part of the county and continue southeastward. The western side also contains a broad agricultural area surrounded by woodland.
Agriculture is subdivided into cropland and pasture or hay. That distinction helps show that the agricultural landscape is not uniform, but the map should not be treated as a field-by-field farm inventory. It is more appropriate for seeing county-scale patterns—where agriculture is concentrated, how it meets forest, and where wetland or water interrupts the farm belt.
Wetlands remain visible at 17.77%, which is useful because they occupy a much larger share than the 1.04% open-water class. Teal wetland patches are embedded throughout forested country and extend close to portions of the agricultural corridor. This makes the simplified map useful for discussing the relationship among farms, forest, and wet areas without the distraction of every developed category.
Lewis County is therefore better described as a heavily forested county with a distinct agricultural corridor than as a simple split between forest and farm country. The simplified map makes that structure easier to see than the percentages alone.
Impervious surface is low and highly localized
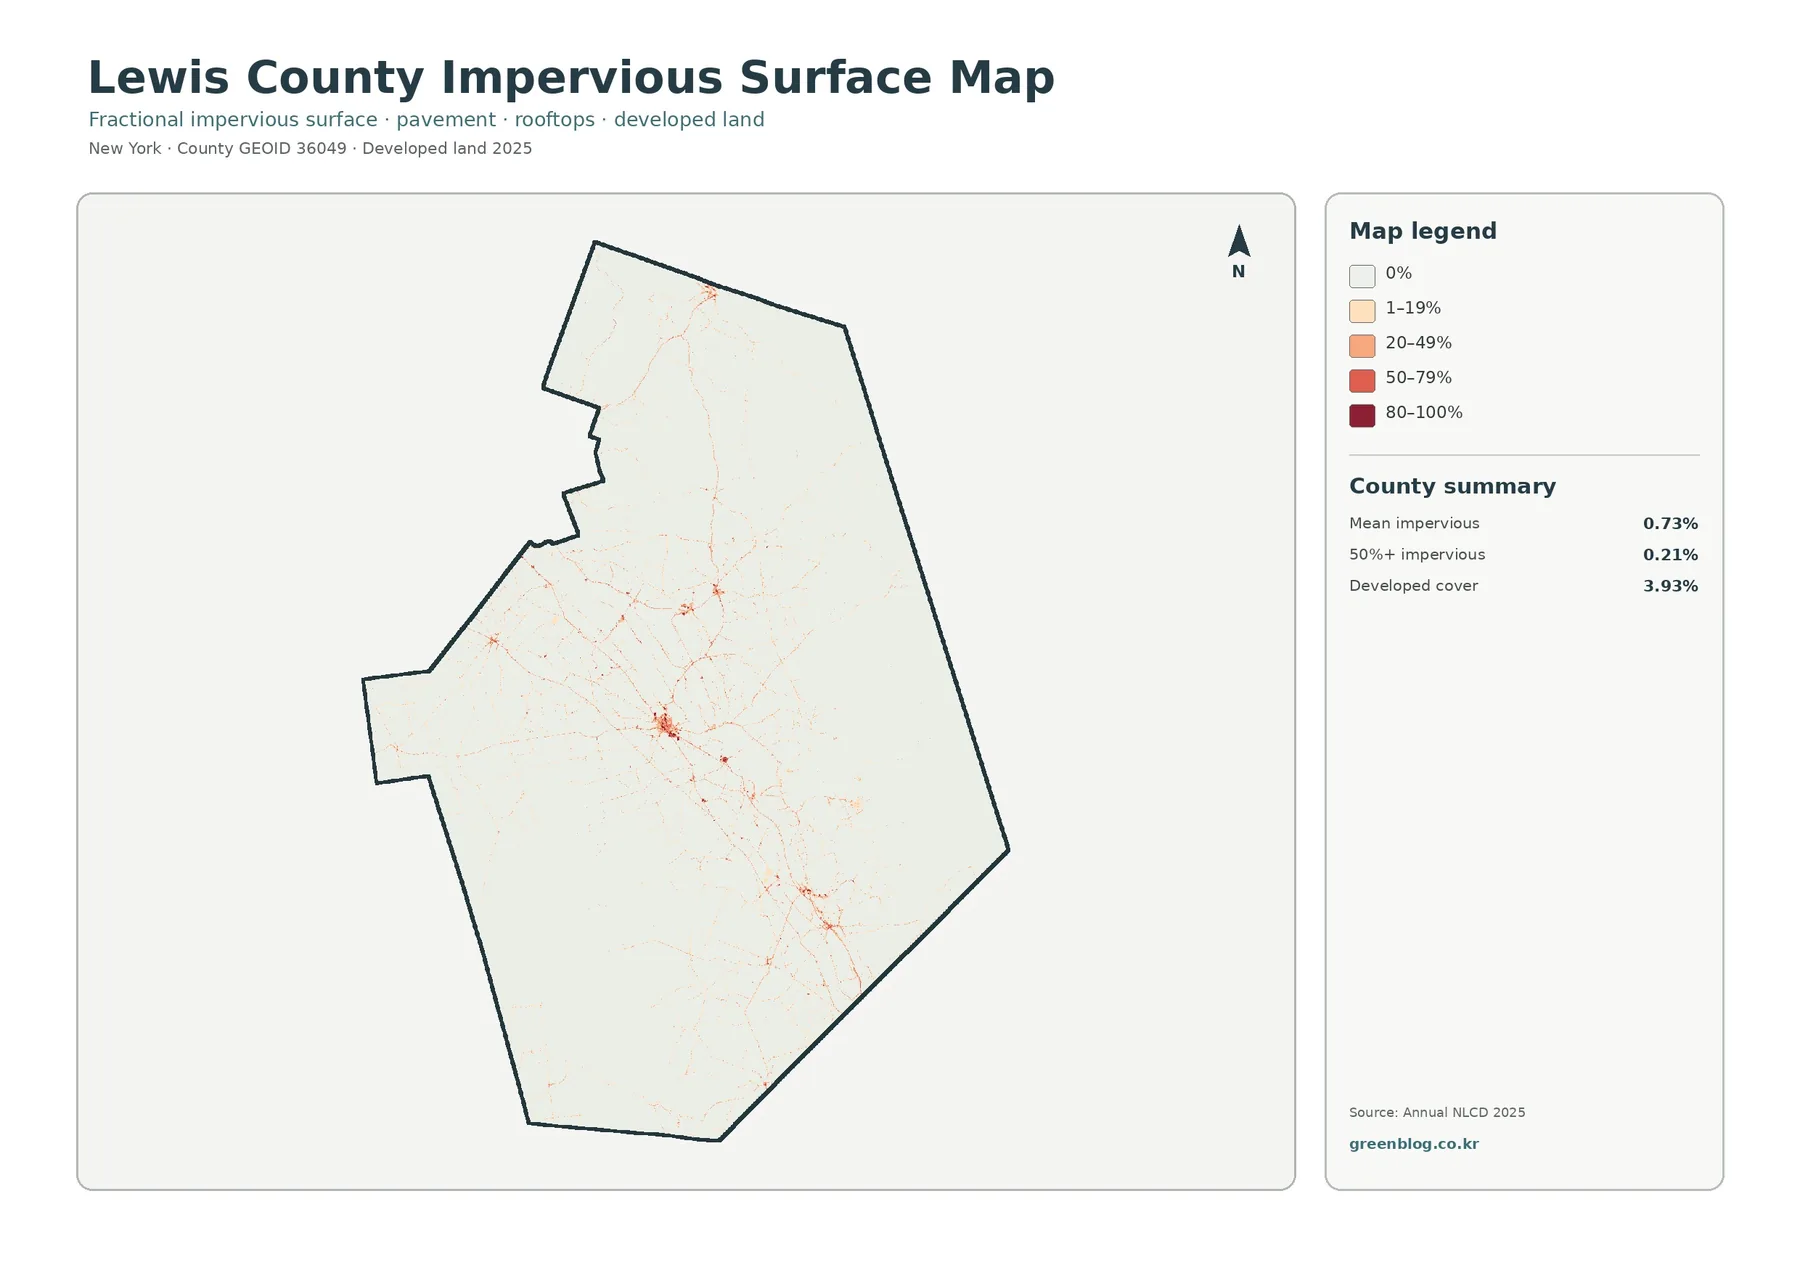
Impervious surface means pavement, rooftops, parking areas, and similar hard surfaces that do not readily absorb rainfall. The county-wide mean is only 0.73%, and just 0.21% of the mapped area reaches at least 50% impervious cover. With developed cover at 3.93% in the general summary, dense built surfaces clearly occupy only a limited part of the county.
Most of the impervious map is white or very pale. Red and orange concentrations appear around a central settlement area, several smaller southeastern locations, and thin connecting corridors. Large forested areas in the north and east contain very little strong impervious color, making the contrast between rural land and development especially clear.
The graduated legend adds information that a single developed class cannot provide. A low-density developed cell may fall into the 1–19% range, while a more intensively built cell can reach 50–79% or 80–100%. Looking at these classes helps distinguish scattered roads and buildings from compact areas with much more pavement and roof cover.
Low impervious cover should not be interpreted as proof of low flood risk. Runoff also depends on rainfall, soils, slopes, drainage systems, streams, and wetlands. For this purpose, the layer works best as a measure of where hard surfaces are concentrated, not as a complete environmental-risk model.
The 1985–2025 comparison records an 11.31% class difference
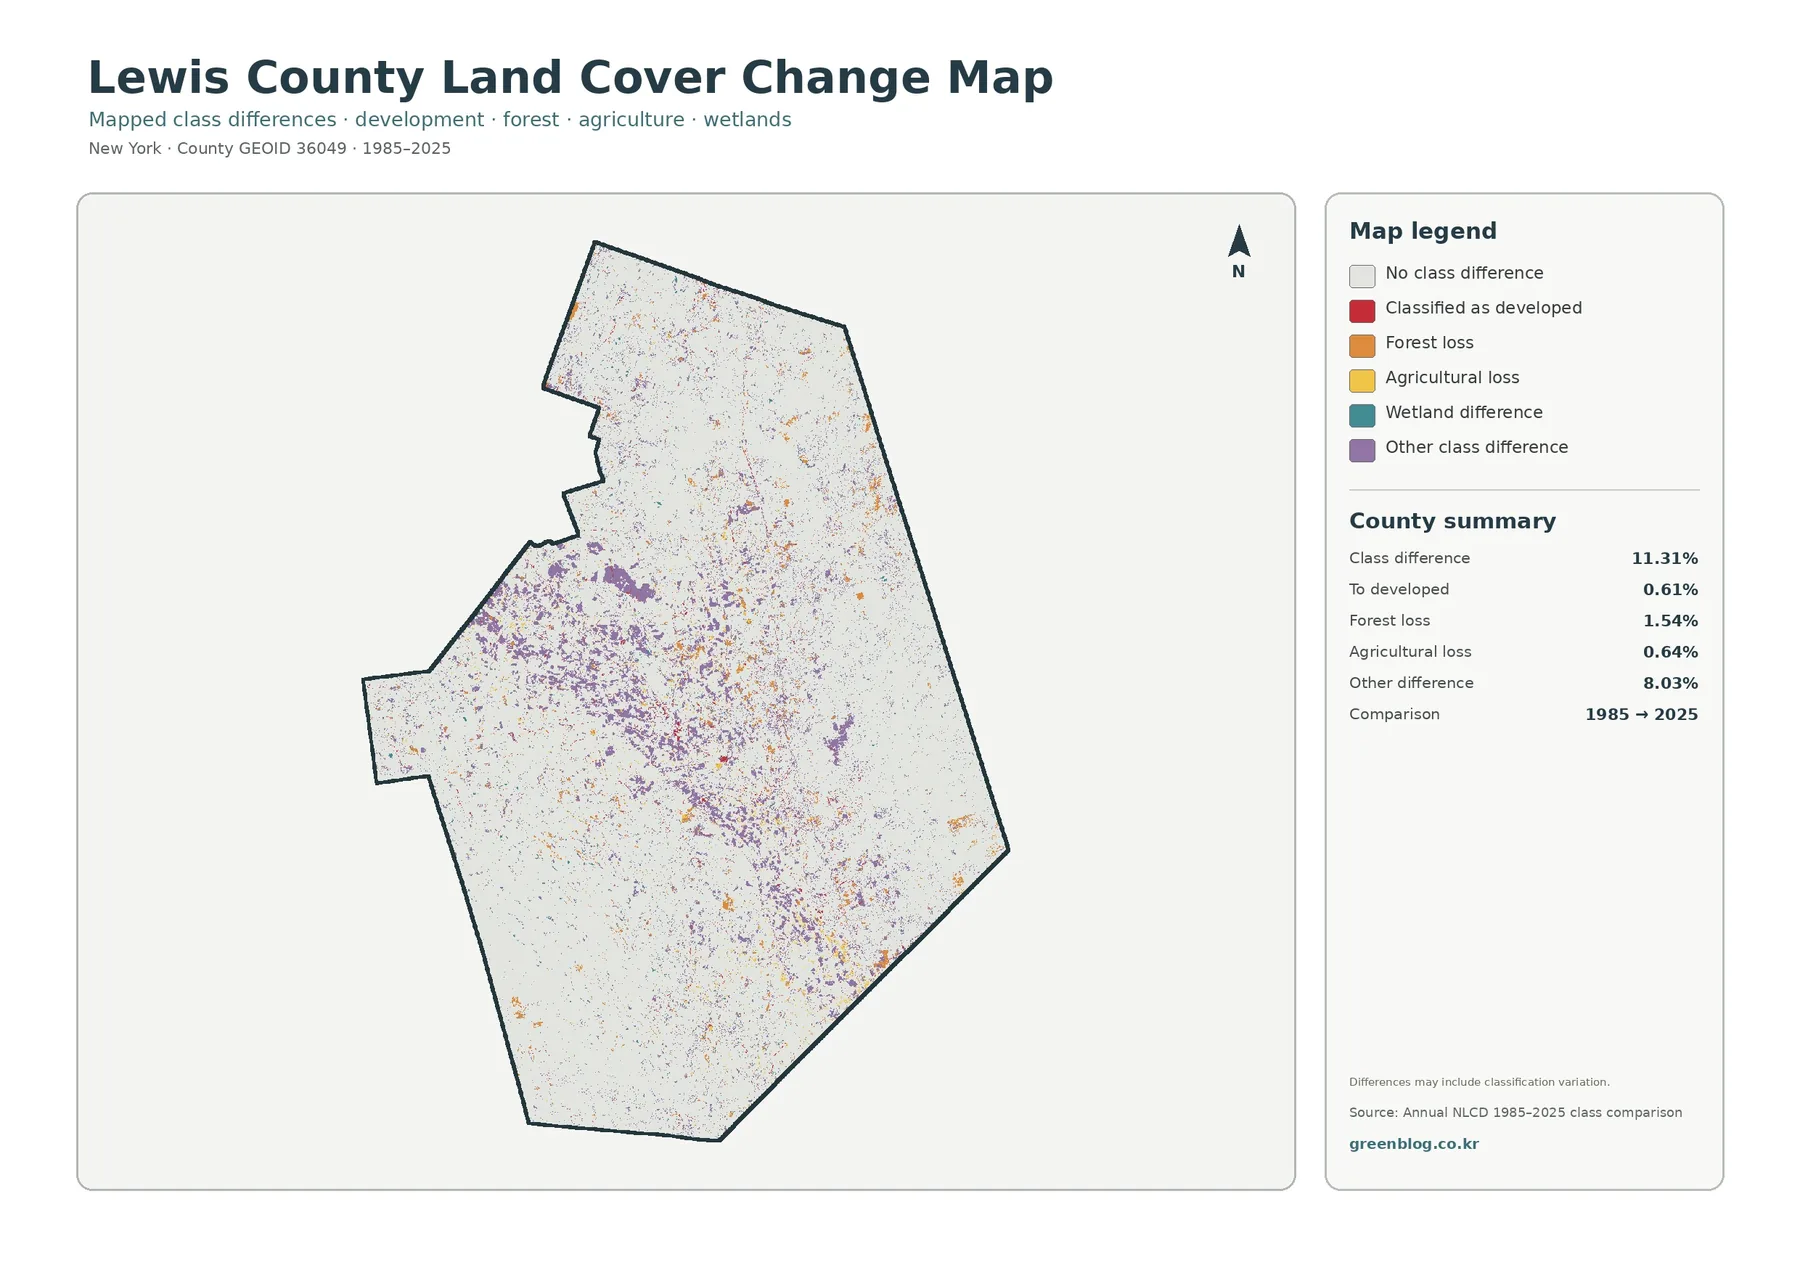
The comparison map reports class differences across 11.31% of the county. Areas classified as developed account for 0.61%, forest loss for 1.54%, agricultural loss for 0.64%, and other class differences for 8.03%. Most of the county remains in the no-class-difference category.
Purple other-difference patches are especially noticeable in parts of the west-central and southeastern areas. Orange forest-loss cells and yellow agricultural-loss cells are scattered more widely, while red developed differences appear in smaller concentrations. The pattern is made up of many local changes rather than one county-wide block.
A colored cell does not automatically prove a specific land-use event. The comparison notes that classification variation may be included, so real surface change, mixed pixels, imagery differences, and classification decisions can all affect the result. Small isolated patches are best treated as places to investigate rather than as final explanations.
For long-term comparison, larger clusters and repeated patterns are usually more informative than single pixels. Once a location of interest is identified, historical aerial imagery or local records can help determine what actually changed on the ground.
A practical way to use all four maps
Begin with the general land-cover map to understand the main structure: broad forest, extensive wetlands, and a central agricultural corridor. The forest-and-farmland view then simplifies the picture and makes the boundary between woodland and agricultural cover much easier to follow. If settlement intensity is the main question, move to the impervious map, and use the change map last to locate differences between the two comparison periods.
For a classroom or presentation, the four maps work well side by side because they use the same county outline but answer different questions. One image emphasizes the full land-cover mix, another isolates rural cover, a third measures hard-surface intensity, and the fourth adds time. Following the same location across all four views can make the differences much easier to explain.
The set can also support broad local-reference work. Readers can compare wetland-rich forest with agricultural areas, identify where developed cover is concentrated, or find sections of the county where mapped classes changed. Parcel-level planning, permits, ownership, and zoning still require official local records.
Download the four original JPG maps
The ZIP download contains the four original JPG maps shown on this page: general land cover, forest and farmland, impervious surface and developed land, and the 1985–2025 class-difference map. The larger JPG files are more suitable than the WebP previews for printing, slide decks, worksheets, and offline reference.
Limits to remember before using the maps
Land-cover products generalize the ground into raster cells. Narrow roads, small buildings, tiny wetlands, and mixed forest edges may not appear at their exact real-world size. Enlarging the image makes the cells easier to see, but it does not create additional survey-level detail.
The impervious layer is an estimate of the share of hard surface within each cell, not a building footprint or parcel map. Legal property boundaries, ownership, zoning, and development rights are outside the scope of these images and must be checked in separate official records.
The 2025 land-cover map is a classified snapshot for that period. The 1985–2025 map compares two classified datasets and can include classification differences in addition to real physical change. Detailed change analysis should be checked against additional imagery or local historical information.
Frequently Asked Questions
What is the largest land-cover class in Lewis County?
Forest is the largest class at 60.32% in the supplied 2025 summary. Wetlands are second at 17.77%, followed by agriculture at 15.11%, creating a landscape where broad woodland surrounds a distinct agricultural corridor.
How much impervious surface does Lewis County have?
The county-wide mean impervious value is 0.73%, and only 0.21% of the mapped area reaches at least 50% impervious cover. Most intense hard-surface areas are limited to compact settlements and connecting corridors.
What is included in the download?
The ZIP contains four original JPG maps: general land cover, forest and farmland, impervious surface and developed land, and mapped land-cover differences from 1985 to 2025. The WebP versions in the article are optimized for quick preview. Map File Information Lewis County Land Cover Map Files
Map File Information
Download the map files associated with this page for reference, printing, and compatible visual projects.
- Included Files: Use only the versions confirmed in the article and supplied images
- File Type: Use the confirmed download contents
- Intended Use: Printing, education, presentations, and map-based projects
Related Maps
- Albany County Land Cover Map
- Allegany County New York Land Cover Map
- Bronx County New York Land Cover Map
Sources and reference data
Annual NLCD land-cover information and U.S. Census geographic boundary data provide the basis for this map set. The official pages below provide the classification definitions, downloadable datasets, and county boundary files used for this type of map.
- MRLC Annual NLCD Data
- USGS Annual NLCD Land Cover Classification
- U.S. Census Bureau TIGER/Line Shapefiles
Green Map creates custom-edited map images using open geographic data sources such as geoBoundaries, Natural Earth, OpenStreetMap, and government open data.
These maps are edited visual materials, not raw data files, and are provided for education, documents, presentations, and graphic reference.